. 2023 Dec 16;24(1):782.
doi: 10.1186/s12864-023-09799-z.

Whole genome-scale assessment of gene fitness of Novosphingobium aromaticavorans during spaceflight

Affiliations

Whole genome-scale assessment of gene fitness of Novosphingobium aromaticavorans during spaceflight

Gayatri Sharma et al. BMC Genomics. .

Abstract

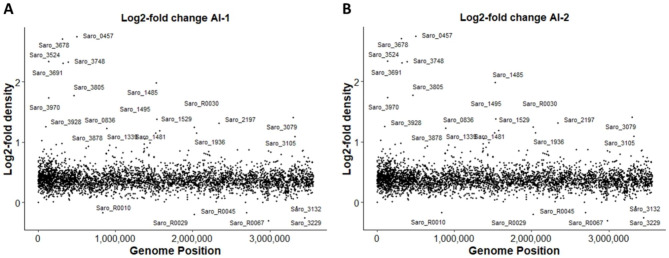
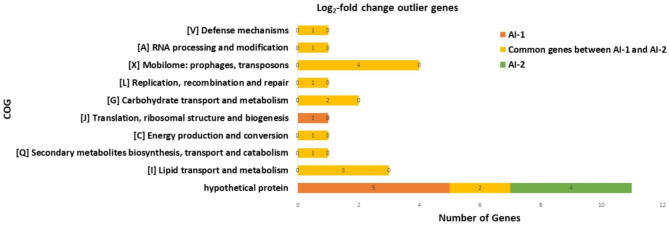
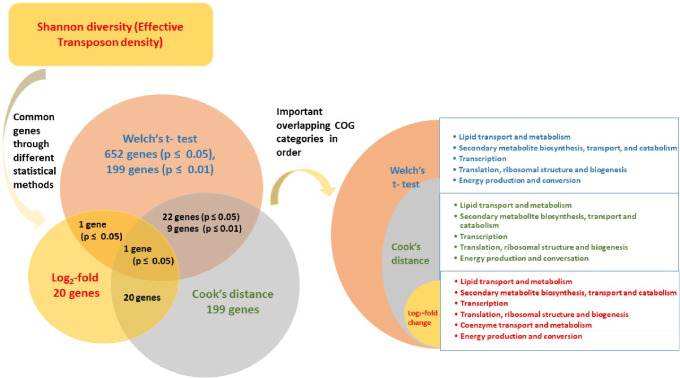
In microgravity, bacteria undergo intriguing physiological adaptations. There have been few attempts to assess global bacterial physiological responses to microgravity, with most studies only focusing on a handful of individual systems. This study assessed the fitness of each gene in the genome of the aromatic compound-degrading Alphaproteobacterium Novosphingobium aromaticavorans during growth in spaceflight. This was accomplished using Comparative TnSeq, which involves culturing the same saturating transposon mutagenized library under two different conditions. To assess gene fitness, a novel comparative TnSeq analytical tool was developed, named TnDivA, that is particularly useful in leveraging biological replicates. In this approach, transposon diversity is represented numerically using a modified Shannon diversity index, which was then converted into effective transposon density. This transformation accounts for variability in read distribution between samples, such as cases where reads were dominated by only a few transposon inserts. Effective density values were analyzed using multiple statistical methods, including log2-fold change, least-squares regression analysis, and Welch's t-test. The results obtained across applied statistical methods show a difference in the number of significant genes identified. However, the functional categories of genes important to growth in microgravity showed similar patterns. Lipid metabolism and transport, energy production, transcription, translation, and secondary metabolite biosynthesis and transport were shown to have high fitness during spaceflight. This suggests that core metabolic processes, including lipid and secondary metabolism, play an important role adapting to stress and promoting growth in microgravity.

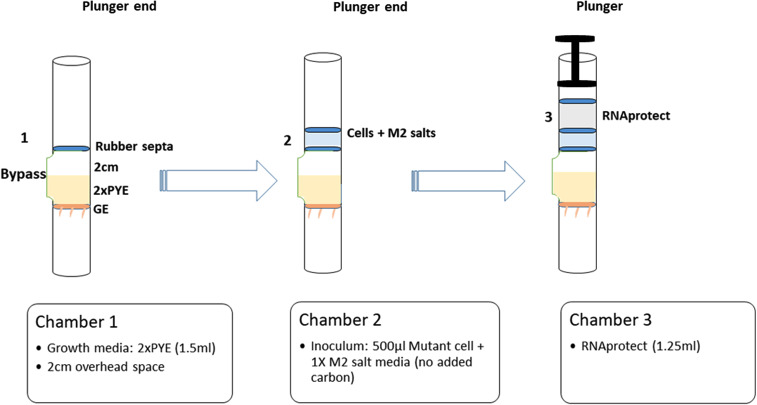
Keywords: Comparative TnSeq; Fluid processing apparatus; Genome fitness; International space station; Microgravity; Novosphingobium.


Conflict of interest statement

The authors declare no competing interests.

Figures

Fig. 1
Fig. 1
Schematic of FPA assembly used to culture N. aromaticivorans in spaceflight. Chamber 1 contained 1.5 ml of 2XPYE with an additional 2 cm of airspace and was capped on the non-plunger end by a gas exchange membrane. Chamber 2 contained 1 ml of N. aromaticivorans TnSeq library inoculum in M2 salts. Chamber 3 contained 1.25 ml of RNAprotect fixative. Chambers were mixed by pressing the terminal septum with a plunger. When an internal septum reached the bypass, the liquid from the upper chamber was transferred to the lower chamber and mixed by shaking by hand
Fig. 2
Fig. 2
Assessment of viability during cold stowage and growth time in FPAs. (A) N. aromaticivorans TnSeq libraries were assessed for viability loss during storage at low temperatures. Cells were resuspended in carbon-deficient 1X M2 salts in FPAs and incubated at 2 oC, 4 oC and 6 oC for 21 days. One replicate was removed every 7 days. Cells were serially diluted and plated on PYE agar plates and CFU/ml was calculated. (B) N. aromaticivorans TnSeq libraries were cultured inside FPAs and CFU/ml was assessed over 5 days. The numbers in blue indicate number of growth generations at each time point. The number of generations of growth at the time of sample extraction for the analysis has been indicated in red
Fig. 3
Fig. 3
Scatterplot of average effective density for Ground and ISS samples. Average effective density was calculated for each from Ground (orange) and ISS (blue) sample for AI-1 (A) and AI-2 (B) data sets. The average effective densities were then plotted by genome position. ISS samples had consistently lower average effective densities
Fig. 4
Fig. 4
Scatterplot of log2-fold change ratio of average effective densities. For each gene, the average effective density of Ground samples was divided by the average effective density of ISS samples and log2 transformed. This was performed for the AI-1 (A) and AI-2 (B) data sets. This data was then plotted by genome position. Genes with ratios above 1 have 2-fold higher effective density in Ground replicates compared to ISS replicates, suggesting transposon insertions in these genes caused reduced fitness in microgravity. The displayed scattered points indicate the 22 outlier genes in the AI-1 and 20 outlier genes in the AI-2.
Fig. 5
Fig. 5
Scatterplot of mean effective density data of Ground vs. ISS samples with linear regression line. Average effective densities from the AI-1 (A) and AI-2 (B) data sets were used to calculate linear regression models. Dashed lines indicate the ideal model where no difference between conditions is observed, while the blue lines represent the model fit to the effective density data. Disproportionate distribution of genes along the fitted line was observed due to 200 influential genes in AI-1 and 199 influential genes in AI-2, indicated in red, which had a significant impact on the regression model. These influential genes pulled the fitted line towards the Ground genes
Fig. 6
Fig. 6
COG category prediction of genes identified as significant by log2-fold change. Genes from the AI-1 (orange) and AI-2 (green) or both (yellow) data sets that had log2-fold change values of 1 or greater were assessed for COG category prediction. In the case where a given gene had more than one COG prediction, all predictions were used, meaning that there are more predictions than the total number of genes. Total number of genes for both data sets (AI-1 and AI-2) is the sum of number of genes in each data set and the common genes
Fig. 7
Fig. 7
COG category prediction of genes identified as significant by Cook’s distance. Genes identified as influential by Cook’s distance from the AI-1 (orange) and AI-2 (green) or both (yellow) data sets were assessed for COG category prediction. In the case where a given gene had more than one COG prediction, all predictions were used, meaning that there are more predictions than the total number of genes. Total number of genes for both data sets (AI-1 and AI-2) is the sum of number of genes in each data set and the common genes
Fig. 8
Fig. 8
COG category prediction of genes identified as significant by Welch’s t-test. Genes identified as significant by Welch’s t-test from the AI-1 (orange), AI-2 (green), or both (yellow) data sets, at p ≤ 0.05 (A) and p ≤ 0.01 (B) were assessed for predicted function by COG category. Total number of genes for both data sets (AI-1 and AI-2) is the sum of number of genes in each data set and the common genes. In the case where a given gene had more than one COG prediction, all predictions were used, meaning that there are more predictions than the total number of genes
Fig. 9
Fig. 9
Summary of significant genes from three analytical methods. Diagram summarizing the numbers and overlap of important genes identified across three analysis methods and COG categories associated with genes identified as significant to growth in microgravity, listed based on their abundance

References

    1. Horneck G, Klaus DM, Mancinelli RL. Space Microbiology. Microbiol Mol Biol Rev. 2010;74:121–56. doi: 10.1128/mmbr.00016-09. - DOI - PMC - PubMed
    1. Nickerson CA, Ott CM, Wilson JW, Ramamurthy R, Pierson DL. Microbial responses to Microgravity and other low-shear environments. Microbiol Mol Biol Rev. 2004;68:345–61. doi: 10.1128/mmbr.68.2.345-361.2004. - DOI - PMC - PubMed
    1. Sielaff AC, Urbaniak C, Babu G, Mohan M, Stepanov VG, Tran Q, Wood JM, Minich J, Mcdonald D, Mayer T, et al. Characterization of the total and viable bacterial and Fungal Communities Associated with the International Space Station surfaces. Microbiome. 2019;7:50. doi: 10.1186/s40168-019-0666-x. - DOI - PMC - PubMed
    1. Zea L, Prasad N, Levy SE, Stodieck L, Jones A, Shrestha S, Klaus D. A molecular genetic basis explaining altered bacterial behavior in space. PLoS ONE. 2016;11:1–23. doi: 10.1371/journal.pone.0164359. - DOI - PMC - PubMed
    1. Tixador R, Gasset G, Eche B, Moatti N, Lapchine L, Woldringh C, Toorop P, Moatti JP, Delmotte F, Tap G. Behavior of Bacteria and antibiotics under space conditions. Aviat Sp Environ Med 1994. - PubMed

LinkOut - more resources