. 2023 Dec 15;21(1):357.
doi: 10.1186/s12964-023-01328-5.

Neuron-targeted overexpression of caveolin-1 alleviates diabetes-associated cognitive dysfunction via regulating mitochondrial fission-mitophagy axis

Affiliations

Neuron-targeted overexpression of caveolin-1 alleviates diabetes-associated cognitive dysfunction via regulating mitochondrial fission-mitophagy axis

Wenxin Tang et al. Cell Commun Signal. .

Abstract

Background: Type 2 diabetes mellitus (T2DM) induced diabetes-associated cognitive dysfunction (DACD) that seriously affects the self-management of T2DM patients, is currently one of the most severe T2DM-associated complications, but the mechanistic basis remains unclear. Mitochondria are highly dynamic organelles, whose function refers to a broad spectrum of features such as mitochondrial dynamics, mitophagy and so on. Mitochondrial abnormalities have emerged as key determinants for cognitive function, the relationship between DACD and mitochondria is not well understood.

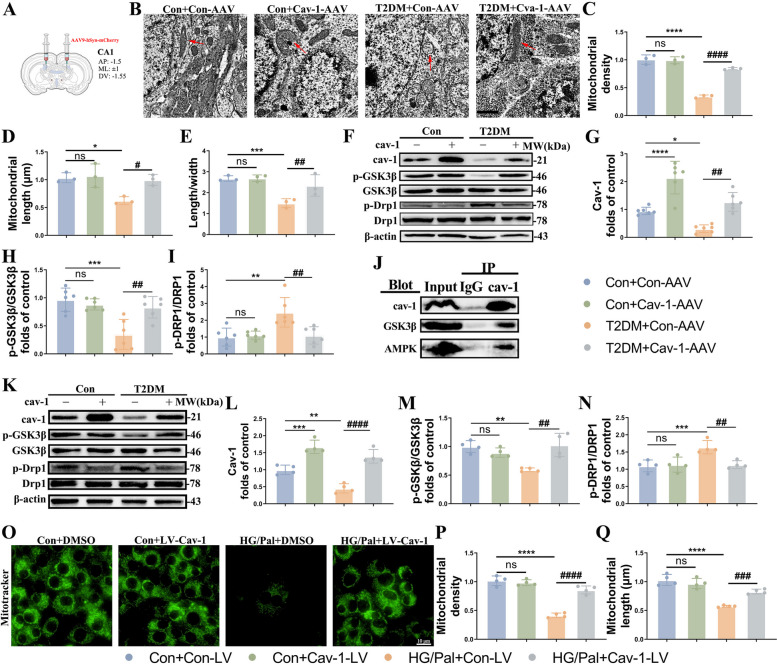
Methods: Here, we explored the underlying mechanism of mitochondrial dysfunction of T2DM mice and HT22 cells treated with high glucose/palmitic acid (HG/Pal) focusing on the mitochondrial fission-mitophagy axis with drug injection, western blotting, Immunofluorescence, and electron microscopy. We further explored the potential role of caveolin-1 (cav-1) in T2DM induced mitochondrial dysfunction and synaptic alteration through viral transduction.

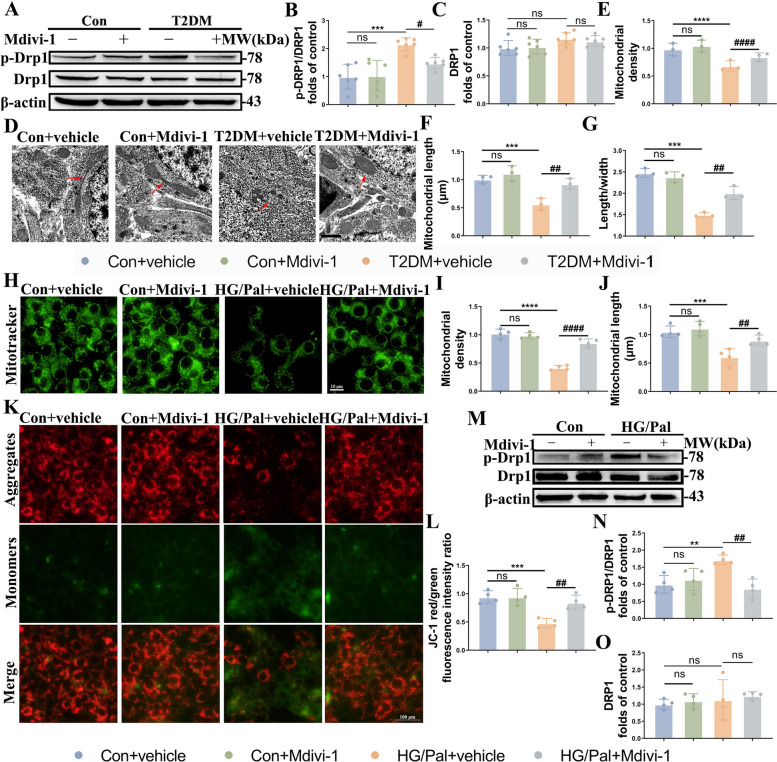
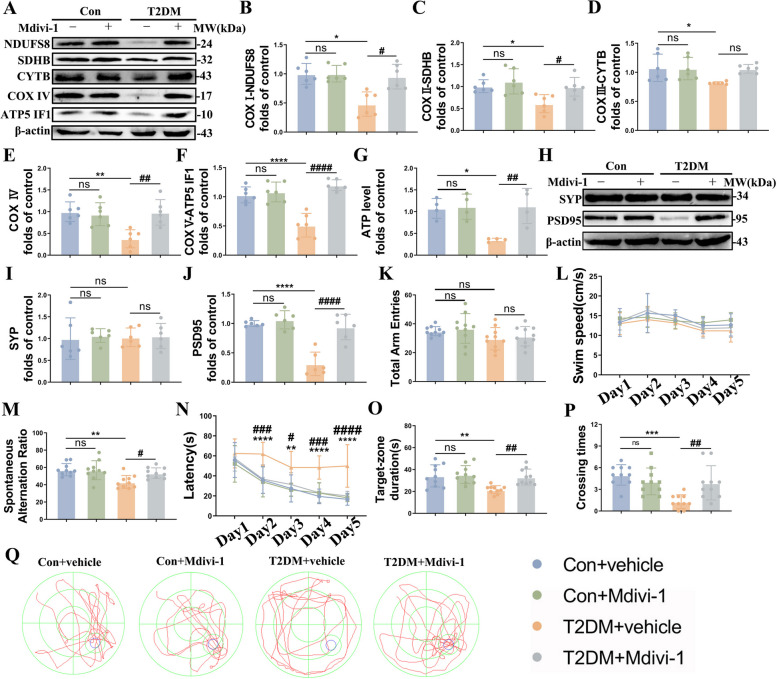
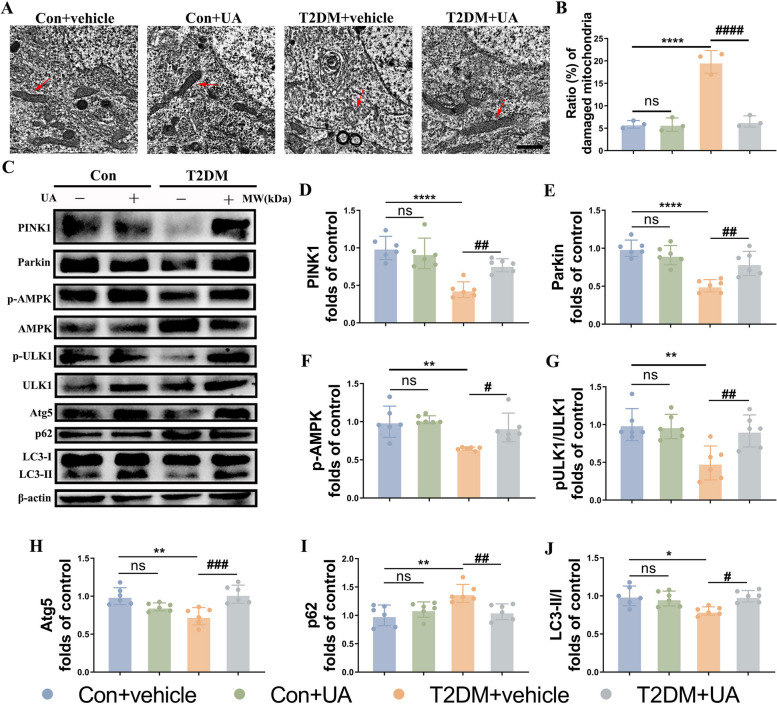
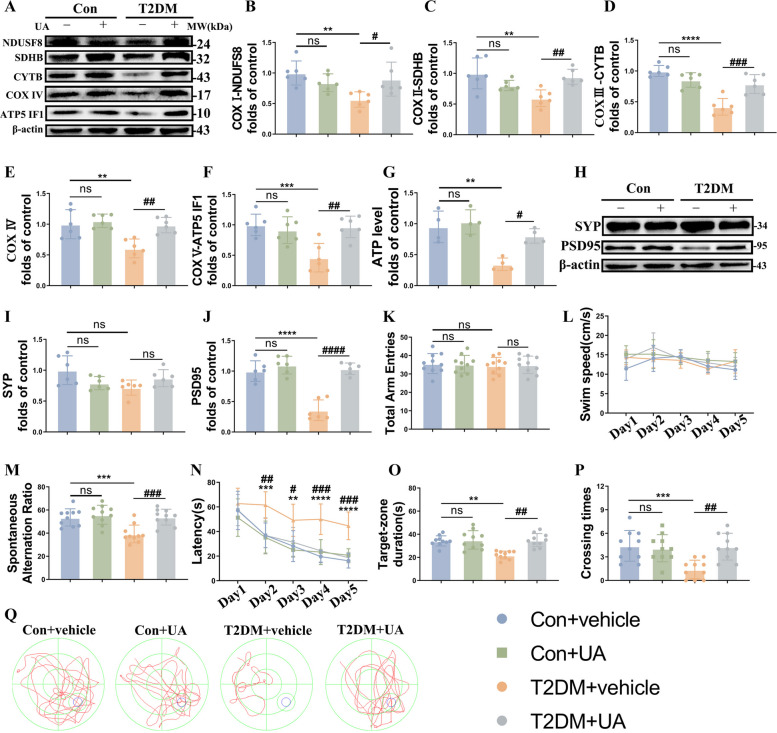
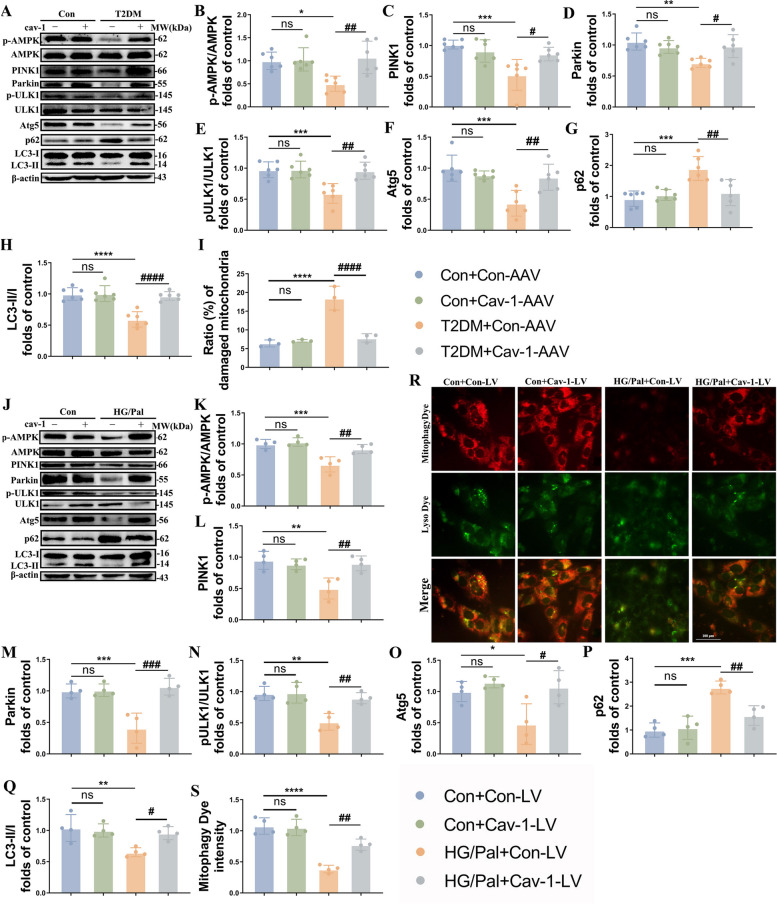
Results: As previously reported, T2DM condition significantly prompted hippocampal mitochondrial fission, whereas mitophagy was blocked rather than increasing, which was accompanied by dysfunctional mitochondria and impaired neuronal function. By contrast, Mdivi-1 (mitochondrial division inhibitor) and urolithin A (mitophagy activator) ameliorated mitochondrial and neuronal function and thereafter lead to cognitive improvement by inhibiting excessive mitochondrial fission and giving rise to mitophagy, respectively. We have previously shown that cav-1 can significantly improve DACD by inhibiting ferroptosis. Here, we further demonstrated that cav-1 could not only inhibit mitochondrial fission via the interaction with GSK3β to modulate Drp1 pathway, but also rescue mitophagy through interacting with AMPK to activate PINK1/Parkin and ULK1-dependent signlings.

Conclusions: Overall, our data for the first time point to a mitochondrial fission-mitophagy axis as a driver of neuronal dysfunction in a phenotype that was exaggerated by T2DM, and the protective role of cav-1 in DACD. Graphic Summary Illustration. In T2DM, excessive mitochondrial fission and impaired mitophagy conspire to an altered mitochondrial morphology and mitochondrial dysfunction, with a consequent neuronal damage, overall suggesting an unbalanced mitochondrial fission-mitophagy axis. Upon cav-1 overexpression, GSK3β and AMPK are phosphorylated respectively to activate Drp1 and mitophagy-related pathways (PINK1 and ULKI), ultimately inhibits mitochondrial fission and enhances mitophagy. In the meantime, the mitochondrial morphology and neuronal function are rescued, indicating the protective role of cav-1 on mitochondrial fission-mitophagy axis. Video Abstract.

Keywords: Caveolin-1; Diabetes-associated cognitive dysfunction; Mitochondrial fission; Mitophagy.


Conflict of interest statement

The authors declare no competing interests.

Figures

Fig. 1
Fig. 1
Mitochondria fission is increased in the T2DM environment. A-C Representative Western blot and densitometric analysis of p-Drp1/Drp1 and Drp1 in the hippocampal tissue lysates (n = 6). D-G Transmission electron microscopy showing mitochondrial morphology of neurons in the hippocampus of different groups, and measurements of mitochondrial density (E), length (F), ratio of length to width (G) (n = 3). Scale bar: 1 µm. H-J Representative Mito-Tracker and densitometric analysis of mitochondrial density and length in HT22 cells from the different groups (n = 4). Scale bar: 10 µm. K, L Representative JC-1 staining images and analysis in HT22 cells of different groups (n = 4). Red and green showed JC-1 aggregates and monomers respectively. Scale bar: 100 µm. M–O Representative Western blot and densitometric analysis of p-Drp1/Drp1 and Drp1 in the lysates of HT22 cells (n = 4). The results are represented as mean ± SD. *P < 0.05 versus Control + vehicle, #P < 0.05 versus T2DM + vehicle group, **P or ##P < 0.01, ***P or ###P < 0.001, ****P or.####P < 0.0001
Fig. 2
Fig. 2
Inhibition of mitochondria fission by Mdivi-1 improves mitochondrial and neuronal function in HFD/STZ mice. A-F Representative Western blot and densitometric analysis of OXPHOS-related proteins, including complex I (NDUFS8), complex II (SDHB), complex III (CYTB), complex IV and complex V (ATPase IF1) in the hippocampal tissue lysates (n = 6). β-actin is used as a loading control. G ATP level in the hippocampus (n = 4). H-J Representative Western blot and densitometric analysis of PSD95 and SYP levels in the hippocampal tissue lysates (n = 6). β-actin is used as a loading control. K, M Total arm entries (left) and spontaneous alteration ratio (right) in the Y-maze test (n = 10). L, N-P The Morris water maze (MWM) analysis is quantified to obtain the (L) swimming speed, (N) latency, (O) crossing times, and (P) target-zone duration (n = 10). Q Representative traces from the MWM test. The results are represented as mean ± SD. *P < 0.05 versus Control + vehicle, #P < 0.05 versus T2DM + vehicle group, **P or ##P < 0.01, ***P or ###P < 0.001, ****P or ####P < 0.0001
Fig. 3
Fig. 3
Mitophagy is decreased in the hippocampus of T2DM mice. A Transmission electron microscopy showing mitochondrial morphology of neurons in the hippocampus of different groups, and ratio of damaged mitochondria (n = 3). C-J Representative Western blot and densitometric analysis of PINK1, Parkin, p-AMPK/AMPK, p-ULK1/ULK1, Atg5, p62 and ratio of LC3II/I in the hippocampal tissue lysates (n = 6). β-actin is used as a loading control. The results are represented as mean ± SD. *P < 0.05 versus Control + vehicle, #P < 0.05 versus T2DM + vehicle group, **P or ##P < 0.01, ***P or ###P < 0.001, ****P or.####P < 0.0001
Fig. 4
Fig. 4
Enhancement of mitophagy by UA relieves mitochondrial and neuronal injury and cognitive dysfunction of T2DM mice. A-F Representative Western blot and densitometric analysis of OXPHOS-related proteins, including complex I (NDUFS8), complex II (SDHB), complex III (CYTB), complex IV and complex V (ATPase IF1) in the hippocampal tissue lysates (n = 6). β-actin is used as a loading control. G ATP level in the hippocampus (n = 4). H-J Representative Western blot and densitometric analysis of PSD95 and SYP levels in the hippocampal tissue lysates (n = 6). β-actin is used as a loading control. K, M Total arm entries (left) and spontaneous alteration ratio (right) in the Y-maze test (n = 10). L, N-P The Morris water maze (MWM) analysis is quantified to obtain the (L) swimming speed, (N) latency, (O) crossing times, and (P) target-zone duration (n = 10). Q Representative traces from the MWM test. The results are represented as mean ± SD. *P < 0.05 versus Control + vehicle, #P < 0.05 versus T2DM + vehicle group, **P or ##P < 0.01, ***P or ###P < 0.001, ****P or.####P < 0.0001
Fig. 5
Fig. 5
Cav-1 overexpression inhibits mitochondrial fission by GSK3β/Drp1 pathway. A Schematic figure of virus injection. The AAV vector was injected into left and right CA1 areas in the T2DM mouse. B-E Transmission electron microscopy showing mitochondrial morphology of neurons in the hippocampus of different groups (B), and measurements of mitochondrial density (C), length (D), ratio of length to width (E) (n = 3). Scale bar: 1 µm. F-I Representative Western blot and densitometric analysis of cav-1, p-Drp1/Drp1 and Drp1 in the hippocampal tissue lysates (n = 6). β-actin is used as a loading control. J Densitometry of immunoreactive bands (n = 3). K-N Representative Western blot and densitometric analysis of cav-1, p-Drp1/Drp1 and Drp1 in the HT22 cells of different groups (n = 4). β-actin is used as a loading control. O-Q Representative Mito-Tracker and densitometric analysis of mitochondrial density and length in HT22 cells from the different groups (n = 4). Scale bar: 10 µm. The results are represented as mean ± SD. *P < 0.05 versus Control + Con-AAV/LV, #P < 0.05 versus T2DM + Con-AAV/LV group, **P or ##P < 0.01, ***P or ###P < 0.001, ****P or.####P < 0.0001
Fig. 6
Fig. 6
Cav-1 overexpression boosts mitophagy via AMPK pathway. A-H Representative Western blot and densitometric analysis of p-AMPK/AMPK, PINK1, Parkin, p-ULK1/ULK1, Atg5, p62 and ratio of LC3II/I in the hippocampal tissue lysates (n = 6). β-actin is used as a loading control. I The proportion of damaged mitochondria in the neurons of hippocampus (n = 3). J-Q Representative Western blot and densitometric analysis of p-AMPK/AMPK, PINK1, Parkin, p-ULK1/ULK1, Atg5, p62 and ratio of LC3II/I in the HT22 cells (n = 4). β-actin is used as a loading control. R, S Representative mitophagy dye and lyso dye and densitometric analysis of mitophagy dye intensity (n = 4). Scale bar: 100 µm. The results are represented as mean ± SD. *P < 0.05 versus Control + Con-AAV/LV, #P < 0.05 versus T2DM + Con-AAV/LV group, **P or ##P < 0.01, ***P or ###P < 0.001, ****P or.####P < 0.0001
Fig. 7
Fig. 7
Cav-1 overexpression improves neuronal function and synaptic morphology, as well as cognitive ability in T2DM mice. A Representative HE staining of mouse hippocampus sections in each group. Scale bar: 100 µm. B Golgi imaging for the neuronal morphology (left) and 3D reconstruction of dendrites (right) in hippocampal pyramidal neurons of CA1 region in the experimental groups (n = 3). Scale bar: 100 (left) and 10 (right) µm. C Statistical analysis for the dendritic complexity. (D-G) Quantification of the total spine density (D), stubby spine density (E), mushroom spine density (F), long thin spine density (G), and filopodia/dendrite spine density (H) in hippocampal CA1 pyramidal neurons of each group. I-K Representative Western blot and densitometric analysis of PSD95 and SYP levels in the hippocampal tissue lysates (n = 6). β-actin is used as a loading control. L, N Total arm entries (left) and spontaneous alteration ratio (right) in the Y-maze test (n = 10). M, O-Q The Morris water maze (MWM) analysis is quantified to obtain the (M) swimming speed, (O) latency, (P) crossing times, and (Q) target-zone duration (n = 10). R Representative traces from the MWM test. The results are represented as mean ± SD. *P < 0.05 versus Control + Con-AAV, #P < 0.05 versus T2DM + Con-AAV group, **P or ##P < 0.01, ***P or ###P < 0.001, ****P or.####P < 0.0001

References

    1. Livingston G, Huntley J, Sommerlad A, Ames D, Ballard C, Banerjee S, et al. Dementia prevention, intervention, and care: 2020 report of the Lancet Commission. The Lancet. 2020;396(10248):413–446. doi: 10.1016/S0140-6736(20)30367-6. - DOI - PMC - PubMed
    1. Biessels GJ, Despa F. Cognitive decline and dementia in diabetes mellitus: mechanisms and clinical implications. Nat Rev Endocrinol. 2018;14(10):591–604. doi: 10.1038/s41574-018-0048-7. - DOI - PMC - PubMed
    1. Rawlings AM, Sharrett AR, Albert MS, Coresh J, Windham BG, Power MC, et al. The Association of Late-Life Diabetes Status and Hyperglycemia With Incident Mild Cognitive Impairment and Dementia: The ARIC Study. Diabetes Care. 2019;42(7):1248–1254. doi: 10.2337/dc19-0120. - DOI - PMC - PubMed
    1. Dove A, Shang Y, Xu W, Grande G, Laukka EJ, Fratiglioni L, et al. The impact of diabetes on cognitive impairment and its progression to dementia. Alzheimers Dement. 2021;17(11):1769–1778. doi: 10.1002/alz.12482. - DOI - PubMed
    1. van Gennip ACE, Stehouwer CDA, van Boxtel MPJ, Verhey FRJ, Koster A, Kroon AA, et al. Association of Type 2 Diabetes, According to the Number of Risk Factors Within Target Range, With Structural Brain Abnormalities, Cognitive Performance, and Risk of Dementia. Diabetes Care. 2021;44(11):2493–2502. doi: 10.2337/dc21-0149. - DOI - PMC - PubMed

Publication types

Substances