. 2023 Dec 15;22(1):207.
doi: 10.1186/s12943-023-01900-0.

Acidosis-mediated increase in IFN-γ-induced PD-L1 expression on cancer cells as an immune escape mechanism in solid tumors

Affiliations

Acidosis-mediated increase in IFN-γ-induced PD-L1 expression on cancer cells as an immune escape mechanism in solid tumors

Philipp Knopf et al. Mol Cancer. .

Abstract

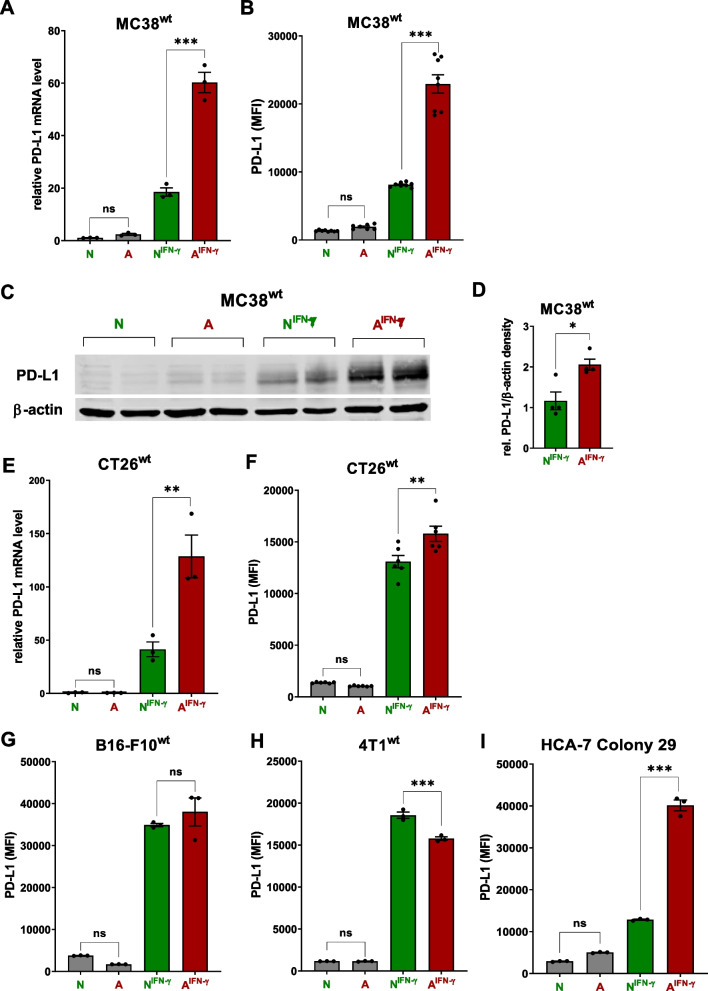
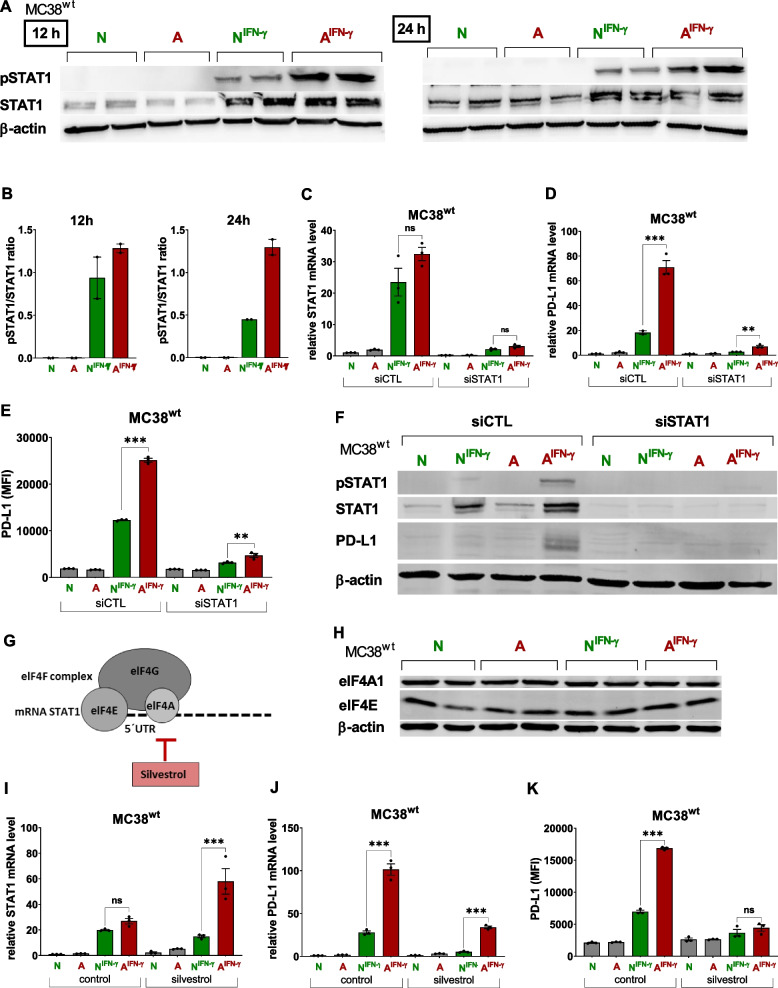
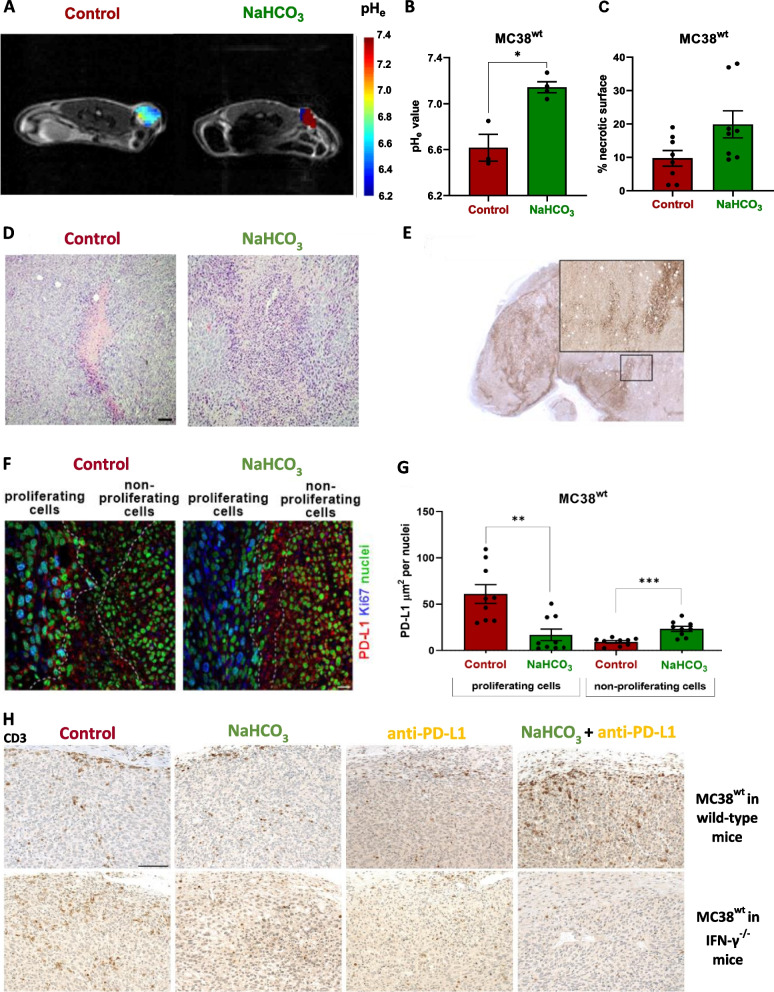
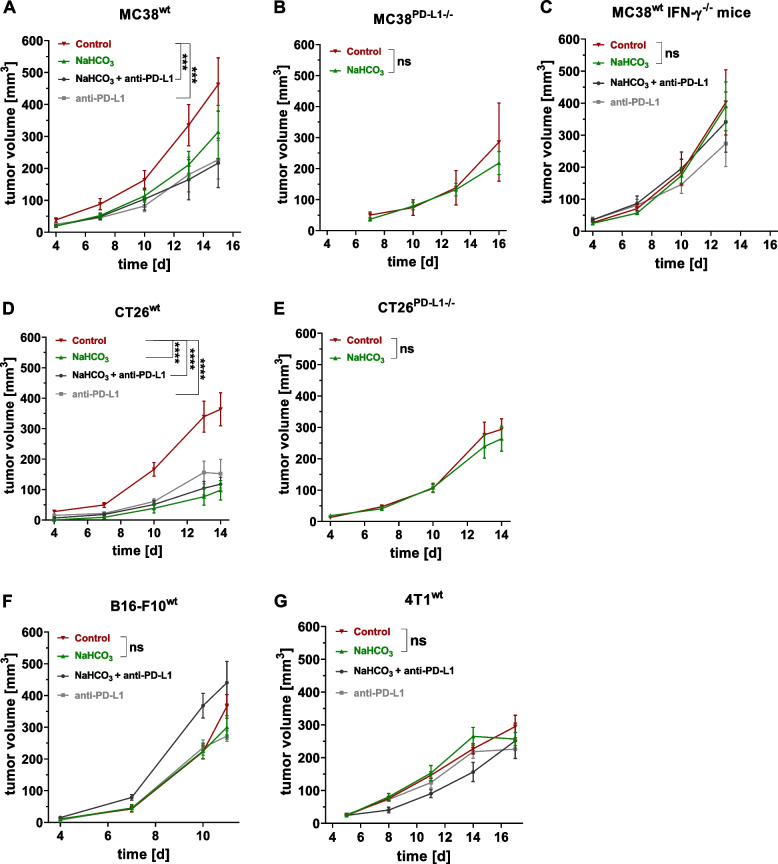
Immune checkpoint inhibitors have revolutionized cancer therapy, yet the efficacy of these treatments is often limited by the heterogeneous and hypoxic tumor microenvironment (TME) of solid tumors. In the TME, programmed death-ligand 1 (PD-L1) expression on cancer cells is mainly regulated by Interferon-gamma (IFN-γ), which induces T cell exhaustion and enables tumor immune evasion. In this study, we demonstrate that acidosis, a common characteristic of solid tumors, significantly increases IFN-γ-induced PD-L1 expression on aggressive cancer cells, thus promoting immune escape. Using preclinical models, we found that acidosis enhances the genomic expression and phosphorylation of signal transducer and activator of transcription 1 (STAT1), and the translation of STAT1 mRNA by eukaryotic initiation factor 4F (elF4F), resulting in an increased PD-L1 expression. We observed this effect in murine and human anti-PD-L1-responsive tumor cell lines, but not in anti-PD-L1-nonresponsive tumor cell lines. In vivo studies fully validated our in vitro findings and revealed that neutralizing the acidic extracellular tumor pH by sodium bicarbonate treatment suppresses IFN-γ-induced PD-L1 expression and promotes immune cell infiltration in responsive tumors and thus reduces tumor growth. However, this effect was not observed in anti-PD-L1-nonresponsive tumors. In vivo experiments in tumor-bearing IFN-γ-/- mice validated the dependency on immune cell-derived IFN-γ for acidosis-mediated cancer cell PD-L1 induction and tumor immune escape. Thus, acidosis and IFN-γ-induced elevation of PD-L1 expression on cancer cells represent a previously unknown immune escape mechanism that may serve as a novel biomarker for anti-PD-L1/PD-1 treatment response. These findings have important implications for the development of new strategies to enhance the efficacy of immunotherapy in cancer patients.

Keywords: Biomarkers; Checkpoint inhibitors; Combination therapy; Drug resistance mechanisms in immunotherapy; Immune checkpoint inhibitors; Immune response; Immunotherapy; Modulators of tumor microenvironment; Oncology; Precision medicine; T-cells; pH modulation of the tumor microenvironment.


Conflict of interest statement

The authors declare no competing interests.

Figures

Fig. 1
Fig. 1
PD-L1 is expressed on melanoma cells located close to T cell-enriched tumor regions. H&E-stained human metastatic melanoma tissues (A, B) with necrotic tissue regions (black asterisk + encircled with white dashed lines). B-F Shows the magnification of the identical region of the tumor as indicated by the black rectangle (dashed lines) in (A). B-F In the viable melanoma tumor tissue (black asterisk), C SOX-10-expressing melanoma cells were discriminated from the (D) CD3 + T cell infiltrate. In addition, viable tumor regions were discriminated from necrotic tumor regions based on (E) Ki67 expression patterns. IHC showed that tumor regions with pronounced (F) PD-L1 expression (black rectangle) were located near the tumor immune cell infiltrate that was identified based on the cell morphology. G At higher magnification (white rectangle) it is visible that PD-L1 positive cells also express SOX-10. The immunofluorescence double staining of PD-L1 and SOX10 (H) of the serial section (F) shows the same region of the tumor (black rectangle) with PD-L1 positive cells surrounding an immune cell infiltrate. Scale bars: 500 μm (A), 100 μm (B-F), 50 μm (H), 20 μm (G)
Fig. 2
Fig. 2
AIFN−γ induces PD-L1 expression in anti-PD-L1 mAbs therapy-responsive murine cell lines while PD-L1 expression is not significantly enhanced in those that are non-responsive. A Relative Pdl1 mRNA expression normalized to Gapdh, Aldolase and β-actin (n = 3, statistics: Tukey’s multiple comparison test), B PD-L1 mean fluorescence intensity (MFI) measured using flow cytometry (pooled data from 3 experiments, n = 8, statistics: Tukey’s multiple comparison test) and (C, D) Western blot analysis and densitometry of PD-L1 and β-actin levels (pooled data from 2 experiments, n = 4, statistics: two-tailed Mann–Whitney test) in MC38wt cells treated with acidic media and/or IFN-γ (10 ng ml−1) for 72 h. Data are presented as the means ± SEM. N = neutral media, A = acidic media, NIFN−γ = neutral media plus IFN-γ, AIFN−γ = acidic media plus IFN-γ. E Relative Pdl1 mRNA expression normalized to Gapdh, Aldolase and β-actin (n = 3) and (F) PD-L1 MFI measured using flow cytometry (pooled data from 2 experiments, n = 6) in murine anti-PD-L1-responsive CT26wt cells following treatment with acidic media and/or IFN-γ (10 ng ml−1) for 72 h. PD-L1 MFI of the (G) nonresponsive murine B16-F10wt and (H) 4T1wt cell lines (n = 3) and (I) human HCA7 colony 29 cells (n = 3) treated with acidic media and/or IFN-γ (10 ng ml−1) for 72 h. Data are presented as the means ± SEM. Statistics: Tukey’s multiple comparison test. N = neutral media, A = acidic media, NIFN−γ = neutral media plus IFN-γ, AIFN−γ = acidic media plus IFN-γ
Fig. 3
Fig. 3
STAT1 is required for AIFN−γ-induced PD-L1 expression in cancer cells and elF4F inhibition blocks AIFN−γ-mediated PD-L1 expression in cancer cells. A Analysis of pSTAT1, STAT1 and β-actin protein levels in MC38wt cells treated with acidic media and/or IFN-γ (10 ng ml−1) for 12 h and 24 h as determined using Western blotting (B) Densitometry of pSTAT1/STAT1 Western blotting of A. C-F MC38wt cells were transfected with a control (siCTL) or Stat1-specific siRNA and treated for 24 h with acidic media ± IFN-γ (10 ng ml−1) before the assessment of relative (C) Stat1 and (D) Pdl1 mRNA expression normalized to Gapdh, Aldolase and β-actin (n = 3) and (E) cell surface PD-L1 expression (n = 3) using qRT-PCR and flow cytometry, respectively. (A, H) The two signals per condition represent two independent samples (n = 2); two independent experiments showed similar results. Statistics: Tukey’s multiple comparison test. F Western blot analyses of pSTAT1, STAT1, PD-L1 and β-actin levels were performed to determine the STAT1 knockdown efficiency (n = 2). Data are presented as the means ± SEM. N = neutral media, A = acidic media, NIFN−γ = neutral media plus IFN-γ, AIFN−γ = acidic media plus IFN-γ. G Schematic representation of the eukaryotic translation initiation complex elF4F composed of elF4G, elF4E and elF4A (inhibited by silvestrol) bound to the 5’UTR of the Stat1 mRNA. H Western blot analysis of elF4A1, elF4E and β-actin levels in MC38wt cells treated with acidic media and/or IFN-γ (10 ng ml−1) for 72 h (n = 2). Relative (I) Stat1 and (J) Pdl1 mRNA expression normalized to Gapdh, Aldolase and β-actin (n = 3) and (K) cell surface PD-L1 expression (n = 3) were determined in MC38wt cells treated with acidic media and/or IFN-γ (10 ng ml−1) in the presence of DMSO (control) or silvestrol (30 nM) for 24 h. Data are presented as the means ± SEM. Statistics: Tukey’s multiple comparison test. N = neutral media, A = acidic media, NIFN−γ = neutral media plus IFN-γ, AIFN−γ = acidic media plus IFN-γ
Fig. 4
Fig. 4
Tumor acidosis increases PD-L1 expression on cancer cells and alleviates the immigration of CD3+ T cells. A Representative pHe maps overlaid on T2-weighted axial MRI images of MC38wt tumor-bearing mice injected with iopamidol (i.v.) at day 10 after the cancer cell injection. Mice with intact IFN-γ signaling received either NaHCO3-enriched water three days prior to cancer cell injection or regular drinking water (Control). Individual images of the tumors are shown in Fig. S7. B Average pHe across the whole tumor. The NaHCO3 treatment significantly increased the tumor pHe measured using acidoCEST MRI (n = 3–4 animals per group; 2 mice were excluded from the quantitative analysis because the measured pHe-values were out of the calibration range, see Fig. S7, statistics: one-tailed Mann–Whitney test). C The percentage of necrosis in MC38wt tumors from the NaHCO3 and Control groups was quantified using H&E staining, as shown in Fig. S8. D Representative H&E staining of MC38wt tumors isolated from experimental mice on day 18 after control or NaHCO3 treatment. H&E staining show the well-delimited necrotic area in the MC38wt tumor of a control treated mouse (center, pink area). In contrast, within the MC38wt tumor of a NaHCO3 treated mouse the necrosis is diffuse surrounded by areas of hypoxia reflected by abundant pyknotic cells (hyperchromatic; magnitude: 10x; scalebar: 100 µm). E Representative PD-L1 IHC of a MC38wt tumor isolated from experimental mice on day 18 after control treatment. (magnitude: 12.5x, scalebar 2 mm; insert: 50x; scalebar 500 µm). F Representative fluorescence microscopy images of PD-L1, the proliferation marker Ki67 in MC38wt tumors isolated on day 18 after treatment with NaHCO3 and control groups. G PD-L1 expression was quantified in proliferating and non-proliferating cells from MC38wt tumor regions. Statistics: two-tailed Mann–Whitney test. H Representative CD3 immunohistochemistry of s.c. MC38wt tumors derived from wild-type C57BL/6 J (day 18) or IFN-γ−/− mice (day 17) after the four different treatment conditions. Animals received regular drinking water (control), NaHCO3 in water (NaHCO3), anti-PD-L1 mAb or NaHCO3 & anti-PD-L1 mAb. N = 3 – 4 representative tumors of each experimental group were subjected to CD3 staining. (magnitude: 400x; scalebar: 100 µm)
Fig. 5
Fig. 5
Tumor growth upon a combinatory or mono-treatment with NaHCO3 and anti-PD-L1 in anti-PD-L1 responsive and nonresponsive tumor models. A Tumor volumes of MC38wt (n = 8 animals per group), B MC38PD−L1−/− (n = 4–5 animals per group), C IFN-γ knockout mice (neutral and acidosis, n = 7–8 animals per group). D CT26wt (n = 7–8 animals per group), and E CT26PD−L1−/− (n = 8 animals per group) tumor volumes  of mice treated with NaHCO3 and/or anti-PD-L1 mAb. F Tumor volumes of B16-F10wt (n = 5–8 animals per group) and (G) 4T1wt tumors (n = 5–8 animals per group) growing in mice treated with NaHCO3 and/or anti-PD-L1 mAb. Treatment with NaHCO3-enriched water (200 mM, NaHCO3) started three days prior to cancer cell inoculation; anti-PD-L1 mAb (200 µg per mouse) was administered every third day starting on day 4 (MC38wt, CT26wt, B16-F10wt) or day 5 (4T1wt) after the cancer cell inoculation. Tumors from mice with intact IFN-γ signaling that received regular drinking water developed an acidic tumor pHe (Control). Data are presented as the means ± SEM. Statistics: Tukey’s multiple comparison test (A, C, D, and F) and Sidak’s multiple comparison test (B and E)

References

    1. Hamid O, et al. Five-year survival outcomes for patients with advanced melanoma treated with pembrolizumab in KEYNOTE-001. Ann Oncol. 2019;30(4):582–588. doi: 10.1093/annonc/mdz011. - DOI - PMC - PubMed
    1. Grossman JE, et al. Is PD-L1 a consistent biomarker for anti-PD-1 therapy? The model of balstilimab in a virally-driven tumor. Oncogene. 2021;40(8):1393–1395. doi: 10.1038/s41388-020-01611-6. - DOI - PMC - PubMed
    1. Tewari KS, et al. Survival with cemiplimab in recurrent cervical cancer. N Engl J Med. 2022;386(6):544–555. doi: 10.1056/NEJMoa2112187. - DOI - PubMed
    1. Gross ND, et al. Neoadjuvant cemiplimab for stage II to IV cutaneous squamous-cell carcinoma. N Engl J Med. 2022;387(17):1557–1568. doi: 10.1056/NEJMoa2209813. - DOI - PMC - PubMed
    1. Mirza MR, et al. Dostarlimab for primary advanced or recurrent endometrial cancer. N Engl J Med. 2023;388(23):2145–2158. doi: 10.1056/NEJMoa2216334. - DOI - PubMed

Publication types