

Activity budget and gut microbiota stability and flexibility across reproductive states in wild capuchin monkeys in a seasonal tropical dry forest
- PMID: 38102711
- PMCID: PMC10724892
- DOI: 10.1186/s42523-023-00280-6
Activity budget and gut microbiota stability and flexibility across reproductive states in wild capuchin monkeys in a seasonal tropical dry forest
Abstract
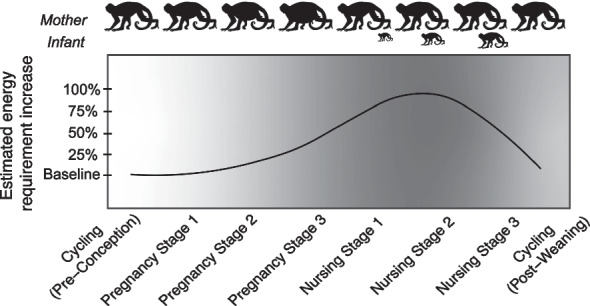
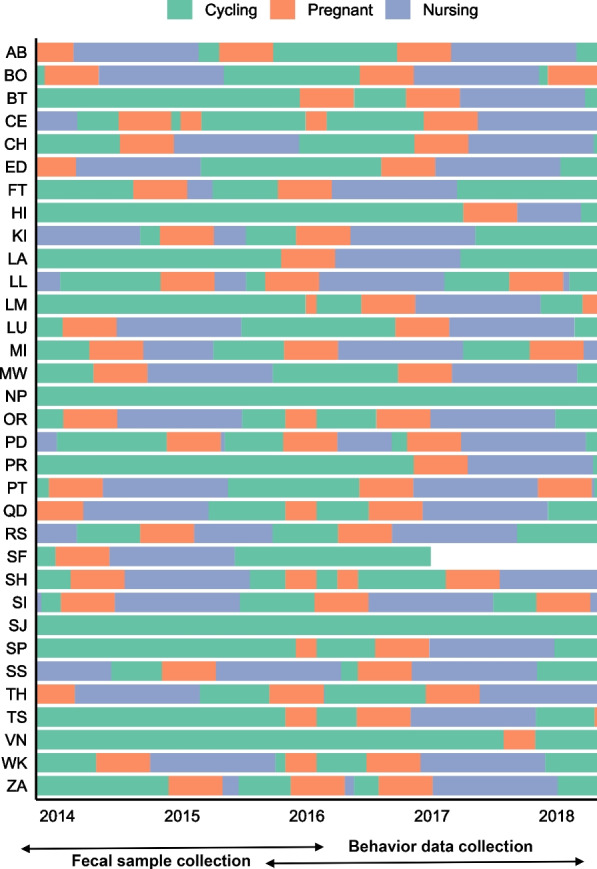
Background: Energy demands associated with pregnancy and lactation are significant forces in mammalian evolution. To mitigate increased energy costs associated with reproduction, female mammals have evolved behavioural and physiological responses. Some species alter activity to conserve energy during pregnancy and lactation, while others experience changes in metabolism and fat deposition. Restructuring of gut microbiota with shifting reproductive states may also help females increase the energy gained from foods, especially during pregnancy. The goal of this study was to examine the relationships among behaviour, gut microbiota composition, and reproductive state in a wild, non-human primate to better understand reproductive ecology. We combined life history data with > 13,000 behavioural scans and 298 fecal samples collected longitudinally across multiple years from 33 white-faced capuchin monkey (Cebus imitator) females. We sequenced the V4 region of the 16S rRNA gene and used the DADA2 pipeline to analyze microbial diversity. We used PICRUSt2 to assess putative functions.
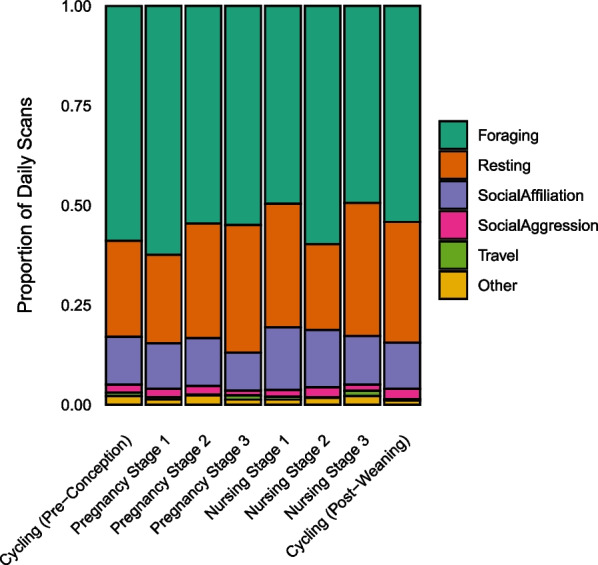
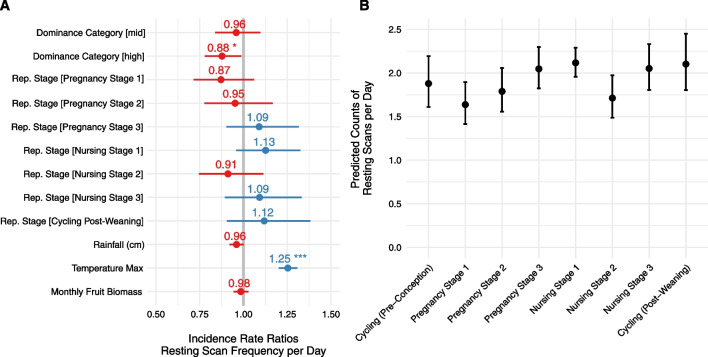
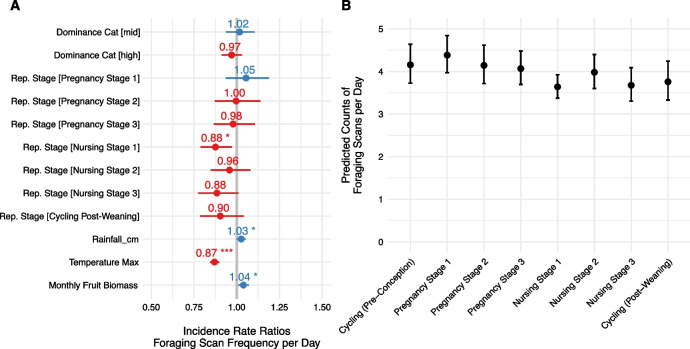
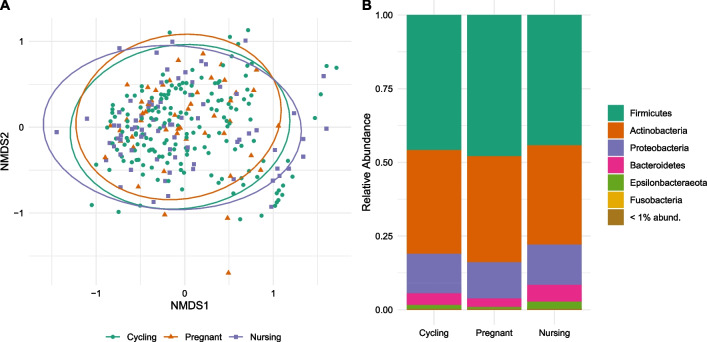
Results: Reproductive state explained some variation in activity, but overall resting behaviours were relatively stable across pregnancy and lactation. Foraging was less frequent among females in the early stage of nursing compared to the cycling stage, though otherwise remained at comparable levels. Maximum temperature was a strong, significantly positive predictor of resting, while social dominance had a small but significantly negative effect on resting. Ecological variables such as available fruit biomass and rainfall had a small but significantly positive effects on measures of foraging time. Gut microbial community structure, including richness, alpha diversity, and beta diversity remained stable across the reproductive cycle. In pairwise comparisons, pregnant females exhibited increased relative abundances of multiple microbial ASVs, suggesting small changes in relation to reproductive state. Reproductive state was not linked to differential abundance of putative metabolic pathways.
Conclusions: Previous data suggest that activity budget and the gut microbiome shifts considerably during reproduction. The present study finds that both activity and gut microbial communities are less associated with reproduction compared to other predictors, including ecological contexts. This suggests that behavioural flexibility and gut microbial community plasticity is contrained by ecological factors in this population. These data contribute to a broader understanding of plasticity and stability in response to physiological shifts associated with mammalian reproduction.
Keywords: Animal behaviour; Gut microbiome; Non-human primates; Reproductive ecology.
© 2023. The Author(s).
Conflict of interest statement
The authors declare no competing interests.
Figures
Similar articles
-
The microbial reproductive ecology of white-faced capuchins (Cebus capucinus).Am J Primatol. 2018 Aug;80(8):e22896. doi: 10.1002/ajp.22896. Epub 2018 Jul 9. Am J Primatol. 2018. PMID: 29984842
-
Fecal bacterial communities of wild black capuchin monkeys (Sapajus nigritus) from the Atlantic Forest biome in Southern Brazil are divergent from those of other non-human primates.Curr Res Microb Sci. 2021 Jul 10;2:100048. doi: 10.1016/j.crmicr.2021.100048. eCollection 2021 Dec. Curr Res Microb Sci. 2021. PMID: 34841339 Free PMC article.
-
Seasonality of the gut microbiota of free-ranging white-faced capuchins in a tropical dry forest.ISME J. 2019 Jan;13(1):183-196. doi: 10.1038/s41396-018-0256-0. Epub 2018 Aug 22. ISME J. 2019. PMID: 30135468 Free PMC article.
-
Small to modest impact of social group on the gut microbiome of wild Costa Rican capuchins in a seasonal forest.Am J Primatol. 2019 Oct;81(10-11):e22985. doi: 10.1002/ajp.22985. Epub 2019 May 13. Am J Primatol. 2019. PMID: 31081233
-
Non-human primate models for understanding the impact of the microbiome on pregnancy and the female reproductive tract†.Biol Reprod. 2023 Jul 11;109(1):1-16. doi: 10.1093/biolre/ioad042. Biol Reprod. 2023. PMID: 37040316 Free PMC article. Review.
Cited by
-
Fecal proteomics of wild capuchins reveals impacts of season, diet, age, and, sex on gut physiology.bioRxiv [Preprint]. 2025 Jun 21:2025.06.16.659980. doi: 10.1101/2025.06.16.659980. bioRxiv. 2025. PMID: 40666882 Free PMC article. Preprint.
-
Host-gut microbiota interactions during pregnancy.Evol Med Public Health. 2024 Jan 6;12(1):7-23. doi: 10.1093/emph/eoae001. eCollection 2024. Evol Med Public Health. 2024. PMID: 38288320 Free PMC article. Review.
References
-
- Altmann J. Baboon mothers and infants. University of Chicago Press; 2001.
-
- Amato KR, Leigh SR, Kent A, Mackie RI, Yeoman CJ, Stumpf RM, Wilson BA, Nelson KE, White BA, Garber PA. The role of gut microbes in satisfying the nutritional demands of adult and juvenile wild, black howler monkeys (Alouatta pigra) Am J Phys Anthropol. 2014;155(4):652–664. doi: 10.1002/ajpa.22621. - DOI - PubMed
-
- Becker NI, Encarnação JA, Tschapka M, Kalko EKV. Energetics and life-history of bats in comparison to small mammals. Ecol Res. 2013;28(2):249–258. doi: 10.1007/s11284-012-1010-0. - DOI
-
- Bergstrom ML. Seasonal effects on the nutrition and energetic condition of female white-faced capuchin monkeys [Doctoral dissertation]. University of Calgary (2015).
Grants and funding
LinkOut - more resources
Full Text Sources