

Explainable hierarchical clustering for patient subtyping and risk prediction
- PMID: 38102763
- PMCID: PMC10854470
- DOI: 10.1177/15353702231214253
Explainable hierarchical clustering for patient subtyping and risk prediction
Abstract
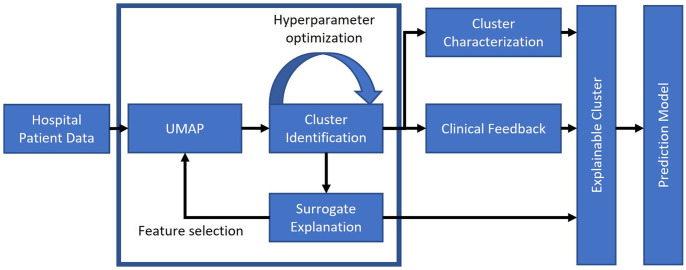
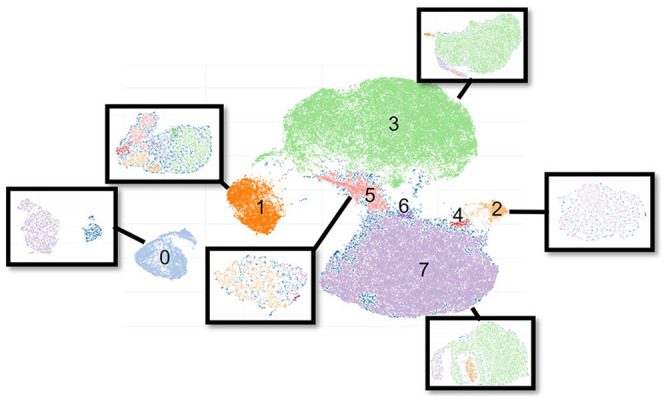
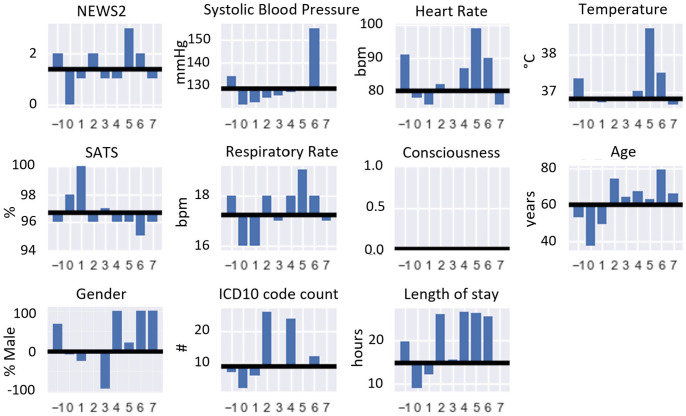
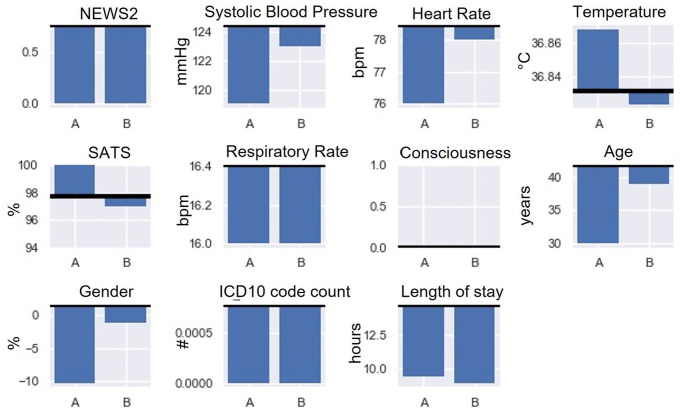
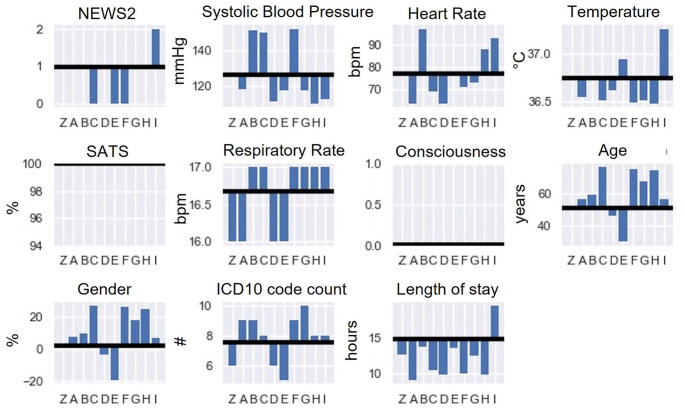
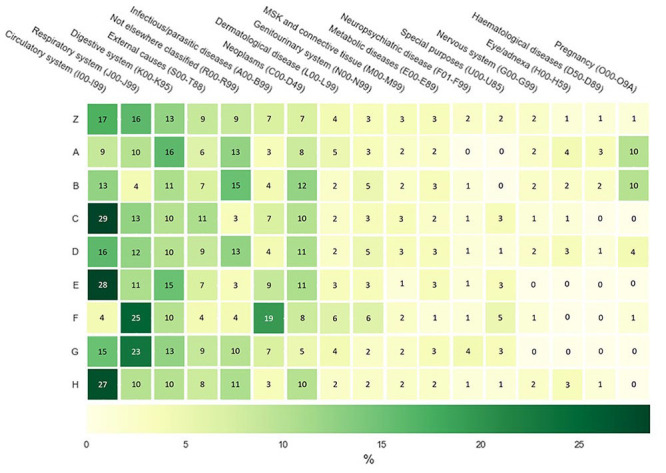
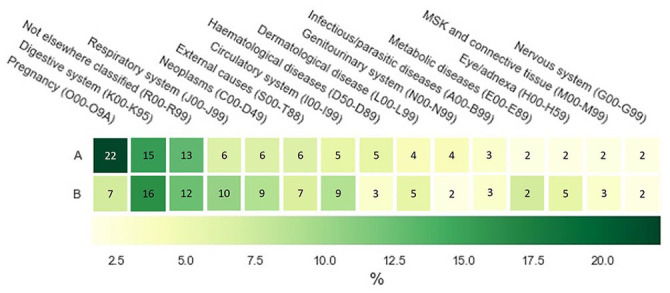
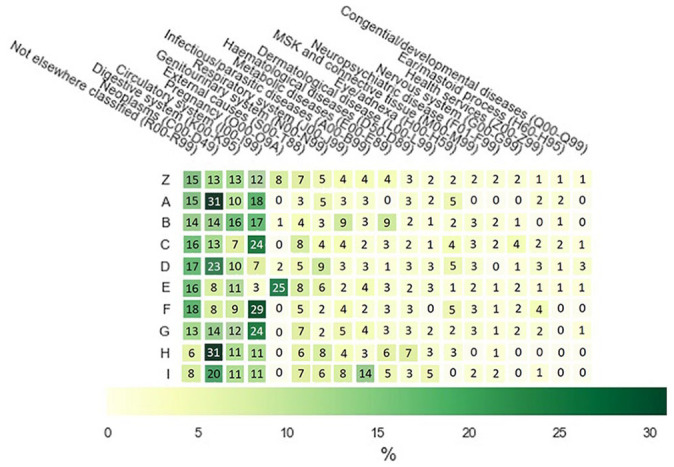
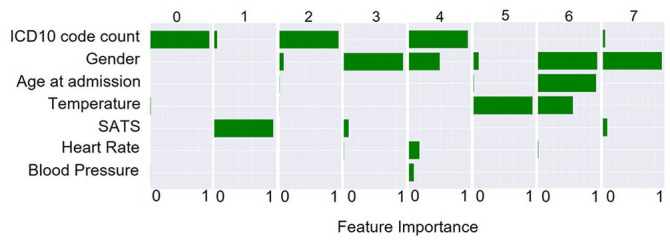
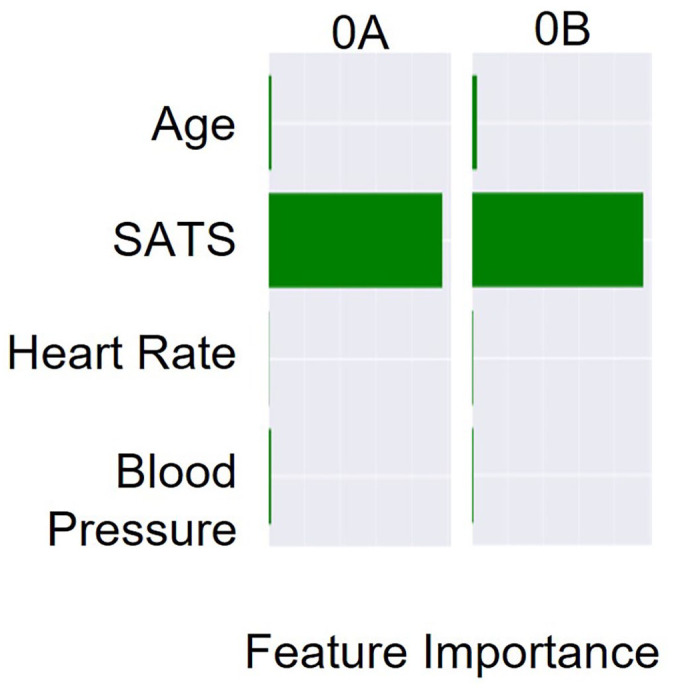
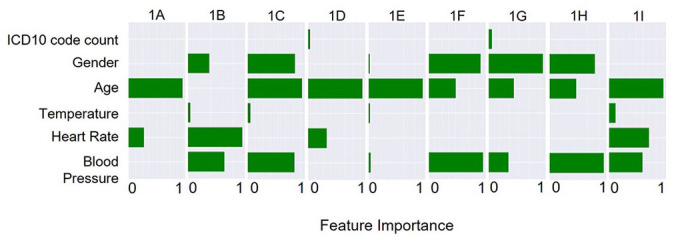
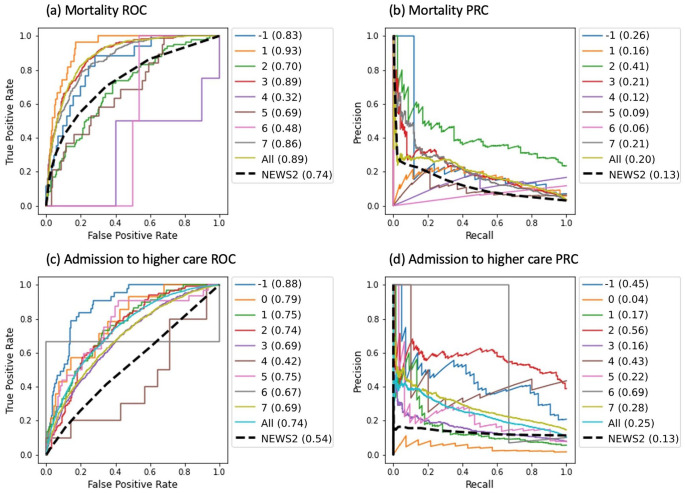
We present a pipeline in which machine learning techniques are used to automatically identify and evaluate subtypes of hospital patients admitted between 2017 and 2021 in a large UK teaching hospital. Patient clusters are determined using routinely collected hospital data, such as those used in the UK's National Early Warning Score 2 (NEWS2). An iterative, hierarchical clustering process was used to identify the minimum set of relevant features for cluster separation. With the use of state-of-the-art explainability techniques, the identified subtypes are interpreted and assigned clinical meaning, illustrating their robustness. In parallel, clinicians assessed intracluster similarities and intercluster differences of the identified patient subtypes within the context of their clinical knowledge. For each cluster, outcome prediction models were trained and their forecasting ability was illustrated against the NEWS2 of the unclustered patient cohort. These preliminary results suggest that subtype models can outperform the established NEWS2 method, providing improved prediction of patient deterioration. By considering both the computational outputs and clinician-based explanations in patient subtyping, we aim to highlight the mutual benefit of combining machine learning techniques with clinical expertise.
Keywords: Hierarchical clustering; clinical evaluation; early warning score; explainability; mortality prediction; patient subtypes.
Conflict of interest statement
Declaration of conflicting interestsThe author(s) declared no potential conflicts of interest with respect to the research, authorship, and/or publication of this article.
Figures
Similar articles
-
The Price of Explainability in Machine Learning Models for 100-Day Readmission Prediction in Heart Failure: Retrospective, Comparative, Machine Learning Study.J Med Internet Res. 2023 Oct 27;25:e46934. doi: 10.2196/46934. J Med Internet Res. 2023. PMID: 37889530 Free PMC article.
-
COVID-Net Biochem: an explainability-driven framework to building machine learning models for predicting survival and kidney injury of COVID-19 patients from clinical and biochemistry data.Sci Rep. 2023 Oct 9;13(1):17001. doi: 10.1038/s41598-023-42203-0. Sci Rep. 2023. PMID: 37813920 Free PMC article.
-
Model-Based and Model-Free Techniques for Amyotrophic Lateral Sclerosis Diagnostic Prediction and Patient Clustering.Neuroinformatics. 2019 Jul;17(3):407-421. doi: 10.1007/s12021-018-9406-9. Neuroinformatics. 2019. PMID: 30460455 Free PMC article.
-
Explainable machine learning models based on multimodal time-series data for the early detection of Parkinson's disease.Comput Methods Programs Biomed. 2023 Jun;234:107495. doi: 10.1016/j.cmpb.2023.107495. Epub 2023 Mar 23. Comput Methods Programs Biomed. 2023. PMID: 37003039
-
Challenges of Clustering Multimodal Clinical Data: Review of Applications in Asthma Subtyping.JMIR Med Inform. 2020 May 28;8(5):e16452. doi: 10.2196/16452. JMIR Med Inform. 2020. PMID: 32463370 Free PMC article. Review.
Cited by
-
A new distal radius fracture classification depending on the specific fragments through machine learning clustering method.BMC Musculoskelet Disord. 2024 Dec 30;25(1):1085. doi: 10.1186/s12891-024-08215-1. BMC Musculoskelet Disord. 2024. PMID: 39736589 Free PMC article.
-
Improving explainability of post-separation suicide attempt prediction models for transitioning service members: insights from the Army Study to Assess Risk and Resilience in Servicemembers - Longitudinal Study.Transl Psychiatry. 2025 Jan 30;15(1):37. doi: 10.1038/s41398-025-03248-z. Transl Psychiatry. 2025. PMID: 39885116 Free PMC article.
-
Unravelling lumbar disc herniation severity beyond MRI : integrated transcriptomic and metabolomic analyses highlight glycerophospholipid metabolism and inform a machine-learning diagnostic model: a pilot study.Bone Joint Res. 2025 May 12;14(5):434-447. doi: 10.1302/2046-3758.145.BJR-2024-0071.R1. Bone Joint Res. 2025. PMID: 40350161 Free PMC article.
-
Creative and generative artificial intelligence for personalized medicine and healthcare: Hype, reality, or hyperreality?Exp Biol Med (Maywood). 2023 Dec;248(24):2497-2499. doi: 10.1177/15353702241226801. Epub 2024 Feb 4. Exp Biol Med (Maywood). 2023. PMID: 38311873 Free PMC article. No abstract available.
References
-
- Baytas IM, Xiao C, Zhang X, Wang F, Jain AK, Zhou J. Patient subtyping via time-aware LSTM networks. In: Proceedings of the 23rd ACM SIGKDD international conference on knowledge discovery and data mining, Halifax, NS, Canada, 13–17 August 2017, pp.65–74. New York: ACM
-
- McWilliams CJ, Lawson DJ, Santos-Rodriguez R, Gilchrist ID, Champneys A, Gould TH, Thomas MJC, Bourdeaux CP. Towards a decision support tool for intensive care discharge: machine learning algorithm development using electronic healthcare data from MIMIC-III and Bristol, UK. BMJ Open 2019;9:e025925 - PMC - PubMed
MeSH terms
LinkOut - more resources
Full Text Sources