. 2024 Aug 1;19(8):1802-1811.
doi: 10.4103/1673-5374.389302. Epub 2023 Nov 8.

Lupenone improves motor dysfunction in spinal cord injury mice through inhibiting the inflammasome activation and pyroptosis in microglia via the nuclear factor kappa B pathway

Affiliations

Lupenone improves motor dysfunction in spinal cord injury mice through inhibiting the inflammasome activation and pyroptosis in microglia via the nuclear factor kappa B pathway

Fudong Li et al. Neural Regen Res. .

Abstract

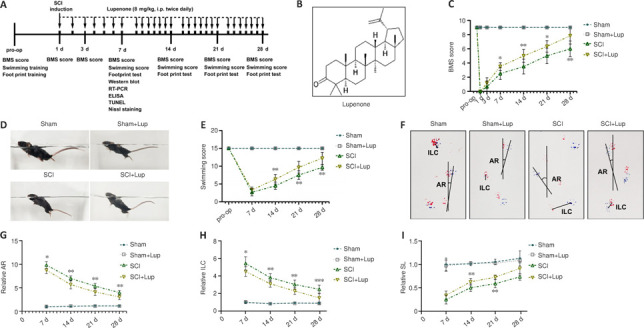
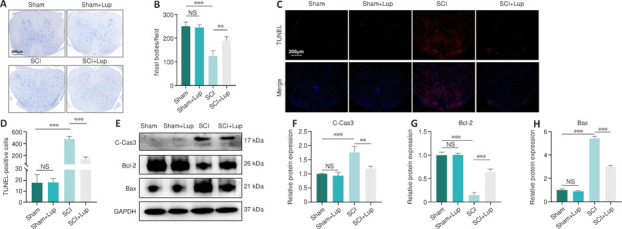
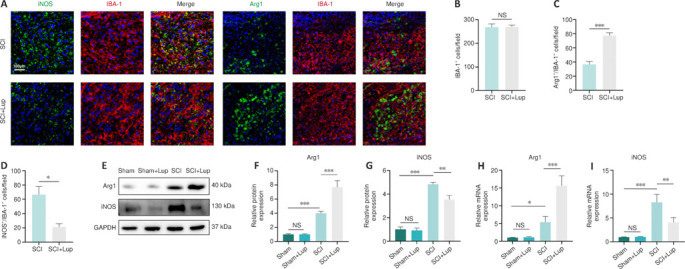
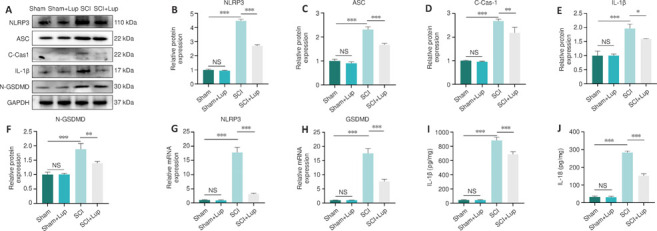
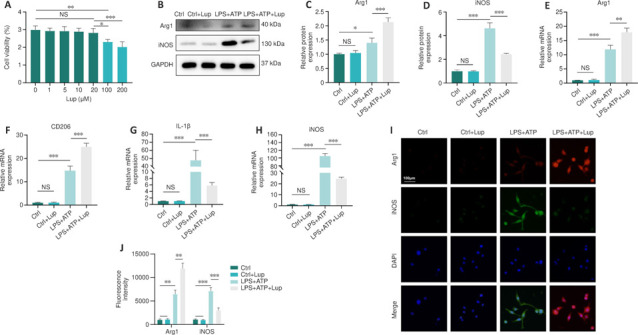
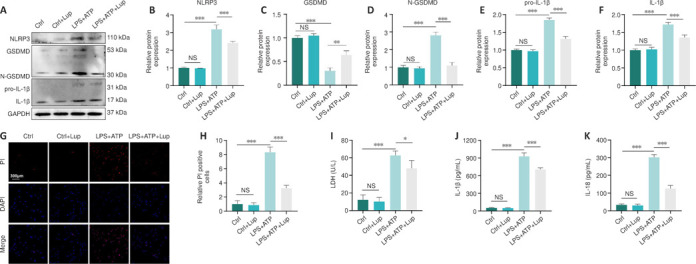
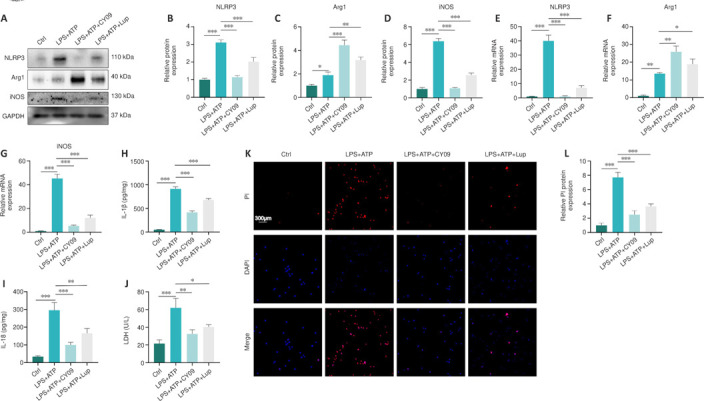
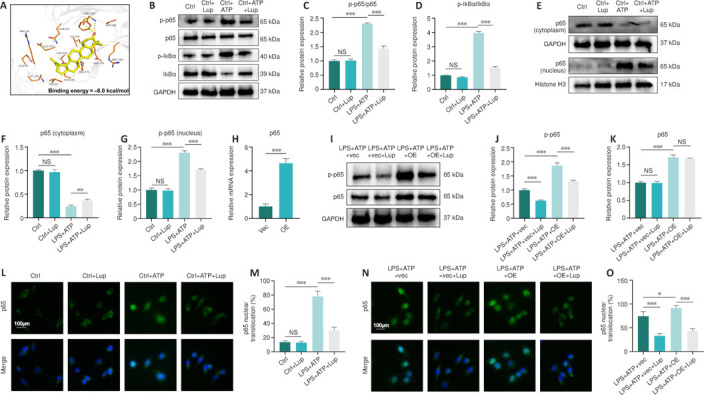
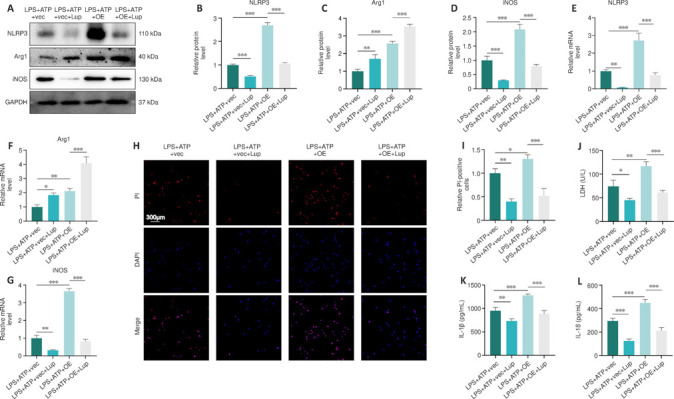
JOURNAL/nrgr/04.03/01300535-202408000-00034/figure1/v/2023-12-16T180322Z/r/image-tiff Spinal cord injury-induced motor dysfunction is associated with neuroinflammation. Studies have shown that the triterpenoid lupenone, a natural product found in various plants, has a remarkable anti-inflammatory effect in the context of chronic inflammation. However, the effects of lupenone on acute inflammation induced by spinal cord injury remain unknown. In this study, we established an impact-induced mouse model of spinal cord injury, and then treated the injured mice with lupenone (8 mg/kg, twice a day) by intraperitoneal injection. We also treated BV2 cells with lipopolysaccharide and adenosine 5'-triphosphate to simulate the inflammatory response after spinal cord injury. Our results showed that lupenone reduced IκBα activation and p65 nuclear translocation, inhibited NLRP3 inflammasome function by modulating nuclear factor kappa B, and enhanced the conversion of proinflammatory M1 microglial cells into anti-inflammatory M2 microglial cells. Furthermore, lupenone decreased NLRP3 inflammasome activation, NLRP3-induced microglial cell polarization, and microglia pyroptosis by inhibiting the nuclear factor kappa B pathway. These findings suggest that lupenone protects against spinal cord injury by inhibiting inflammasomes.


Conflict of interest statement

Conflicts of interest: There are no conflicts of interest.

Figures

Figure 1
Figure 1
Lupenone improves neurological function in mice with SCI. (A) Experimental design. (B) Chemical structure of lupenone. (C) BMS scores in the groups. (D, E) Photos of trunk instability, and LSS analysis. (F–I) Footprint test results. Data are expressed as mean ± SD (n = 6). *P < 0.05, **P < 0.01, ***P < 0.001, vs. SCI + Lup group (one-way analysis of variance followed by Tukey's honest significant difference post hoc test). AR: Angle of rotation; BMS: Basso Mouse Scale; ELISA: enzyme linked immunosorbent assay; ILC: interlimb coordination; i.p.: intraperitoneal injection; LSS: Louisville Swim Scale; Lup: lupenone; NS: no significance; op: operation; RT-PCR: real time polymerase chain reaction; SCI: spinal cord injury; SL: stride length; TUNEL: terminal deoxynucleotidyl transferase mediated dUTP nick end labeling.
Figure 2
Figure 2
SCI-induced apoptosis can be alleviated by treatment with Lup. (A) Nissl-stained neurons in the spinal cord. Neurons in the SCI group were darker and smaller than those in the sham group. The neurons in the SCI + Lup group were arranged more tightly and exhibited more intact morphology than those in the SCI group. Scale bar: 200 μm. (B) The number of Nissl bodies in the spinal cord. (C) TUNEL staining of spinal cord sections. Both the sham group and the sham + Lup group showed rare TUNEL-positive cells (red); the number of TUNEL-positive cells in the SCI group was markedly higher than that in the sham group; and the number of TUNEL-positive cells in the SCI + Lup group was markedly lower than that in the SCI group. Scale bar: 200 μm. (D) Quantification of TUNEL-positive cells. (E–H) Western blots and quantification of C-Cas3, Bcl-2, and Bax levels. Data (normalized by sham group) are expressed as mean ± SD (n = 3). **P < 0.01, ***P < 0.001 (one-way analysis of variance followed by Tukey's honest significant difference post hoc test). C-Cas3: Cleaved caspase-3; GAPDH: glyceraldehyde-3-phosphate dehydrogenase; Lup: lupenone; NS: no significance; SCI: spinal cord injury; TUNEL: terminal deoxynucleotidyl transferase mediated dUTP nick end labeling.
Figure 3
Figure 3
Lup improves microglial polarization in SCI mice. (A) Immunofluorescence staining for the microglial markers IBA-1 (red, Cy3, indicator of microglia), iNOS (green, FITC, indicator of M1 microglia), and Arg1 (green, FITC, indicator of M2 microglia). The number of IBA-1-positive cells was similar between the SCI group and the SCI + Lup group. The number of iNOS-positive cells in the SCI group was markedly higher than that in the SCI + Lup group. The number of Arg1-positive cells in the SCI group was markedly lower than that in the SCI + Lup group. Scale bar: 100 μm. (B–D) Quantification of IBA-1- (B), Arg1/IBA-1- (C) and iNOS/IBA-1- (D) positive cells. (E–G) Western blots and quantification of Arg1 and iNOS expression levels, normalized to the sham group. (H, I) Arg1 and iNOS mRNA expression levels. Data are expressed as mean ± SD (n = 3). *P < 0.05, **P < 0.01, ***P < 0.001 (one-way analysis of variance followed by Tukey's honest significant difference post hoc test). Arg1: Arginase 1; GAPDH: glyceraldehyde-3-phosphate dehydrogenase; IBA-1: ionized calcium-binding adapter molecule 1; iNOS: inductible nitric oxide synthase; Lup: lupenone; NS: no significance; SCI: spinal cord injury.
Figure 4
Figure 4
Lup inhibits over-activation of the NLRP3 inflammasome and pyroptosis in SCI mice. (A–F) Western blot assessing NLRP3 and pyroptosis-related marker expression levels, normalized to the sham group. (G, H) NLRP3 and GSDMD mRNA expression levels, normalized to the sham group. (I, J) IL-1β and IL-18 levels, as detected by enzyme-linked immunosorbent assay. Data are expressed as mean ± SD (n = 3). *P < 0.05, **P < 0.01, ***P < 0.001 (one-way analysis of variance followed by Tukey's honest significant difference post hoc test). ASC: Apoptosis-associated speck-like protein; C-Cas1: cleaved caspase-1; GAPDH: glyceraldehyde-3-phosphate dehydrogenase; IL: interleukin; Lup: lupenone; N-GSDMD: GSDMDNterm; NLRP3: NOD-like receptor protein-3; NS: no significance; SCI: spinal cord injury.
Figure 5
Figure 5
Lup regulates BV2 cell polarization. (A) BV2 cell viability. (B–D) Western blot analysis of Arg1 and iNOS expression levels. (E–H) Arg1, CD206, IL-1β, and iNOS mRNA expression levels. (I, J) Arg1 (red, Cy3) and iNOS (green, FITC) fluorescence. Weaker iNOS fluorescence intensity and stronger Arg1 fluorescence intensity were observed in the LPS + ATP + Lup group compared with the LPS + ATP group. Scale bar: 100 μm. Data (normalized to the control group) are expressed as mean ± SD (n = 3). *P < 0.05, **P < 0.01, ***P < 0.001 (one-way analysis of variance followed by Tukey's honest significant difference post hoc test). Arg1: Arginase 1; ATP: adenosine 5′-triphosphate; CD206: macrophage mannose receptor 1; Ctrl: control; GAPDH: glyceraldehyde-3-phosphate dehydrogenase; IL: interleukin; iNOS: inductible nitric oxide synthase; LPS: lipopolysaccharide; Lup: lupenone; NS: no significance.
Figure 6
Figure 6
Lup decreases NLRP3 activation and subsequent pyroptosis in BV2 cells. (A–F) NLRP3, GSDMD, N-GSDMD, pro-IL-1β, and IL-1β expression in BV2 cells, normalized to the control group. (G, H) PI staining of BV2 cells, normalized to the control group. The number of PI-positive cells in the LPS + ATP group was markedly higher than that in the control group; the number of PI-positive cells in the LPS + ATP + Lup group was markedly lower than that in the LPS + ATP group. Scale bar: 300 μm. (I) Effect of LPS + ATP and Lup on LDH release. (J, K) IL-1β and IL-18 levels, as determined by enzyme-linked immunosorbent assay. Data are expressed as mean ± SD (n = 3). *P < 0.05, **P < 0.01, ***P < 0.001 (one-way analysis of variance followed by Tukey's honest significant difference post hoc test). ATP: Adenosine 5′-triphosphate; Ctrl: control; DAPI: 4′,6-diamidino-2-phenylindole; GAPDH: glyceraldehyde-3-phosphate dehydrogenase; GSDMD: gasdermin D; IL: interleukin; LDH: lactate dehydrogenase; Lup: lupenone; N-GSDMD: GSDMDNterm; NLRP3: NOD-like receptor protein-3; NS: no significance; PI: propidium iodide; pro-IL-1β: pro-interlukin-1β.
Figure 7
Figure 7
CY-09 helps alter microglial polarization and ameliorate pyroptosis in BV2 cells. (A–D) Western blot analysis of NLRP3, Arg1, and iNOS expression levels, normalized to the control group. (E–G) Semi-quantitative analysis of NLRP3, Arg1, and iNOS mRNA levels, normalized to the control group. (H, I) Enzyme-linked immunosorbent assay for IL-1β and IL-18 levels. (J) LDH levels. (K, L) PI staining of BV2 cells and semi-quantitative analysis of PI-positive cells, normalized to the control group. The number of PI-positive cells in the LPS + ATP + CY-09 group was markedly lower than that in the LPS + ATP group; the number of PI-positive cells in the LPS + ATP + Lup group was markedly lower than that in the LPS + ATP group. Scale bar: 300 μm. Data are expressed as mean ± SD (n = 3). *P < 0.05, **P < 0.01, ***P < 0.001 (one-way analysis of variance followed by Tukey's honest significant difference post hoc test). Arg1: Arginase 1; ATP: adenosine 5′-triphosphate; Ctrl: control; CY-09: a NLRP3 specific inhibitor; DAPI: 4′,6-diamidino-2-phenylindole; GAPDH: glyceraldehyde-3-phosphate dehydrogenase; IL: interleukin; iNOS: inductible nitric oxide synthase; LDH: lactate dehydrogenase; LPS: lipopolysaccharide; Lup: lupenone; NLRP3: NOD-like receptor protein-3; PI: propidium iodide.
Figure 8
Figure 8
Activation status of the NF-κB signaling pathway is regulated by Lup. (A) Molecular docking analysis of Lup and p65. (B–D) Western blot results and semiquantitative analysis of whole-cell p-p65, p65, p-IκBα, and IκBα expression, normalized to the control group. (E–G) Western blot analysis and semiquantitative analysis of p65 expression in the cytoplasm and p-p65 expression in the nucleus, normalized to the control group. (H) Semi-quantitative analysis of p65 mRNA levels, normalized to the control group. (I–K) Western blot analysis and semiquantitative analysis of p-p65 and p65 expression levels after p65 overexpression, normalized to the control group. (L, M) Lup reduced the increased translocation of p65 (green, FITC) induced by LPS + ATP. (N, O) p65 overexpression increased p65 (green, FITC) nuclear translocation, and this effect was reversed by treatment with Lup. Scale bar: 100 μm. Data are expressed as mean ± SD (n = 3). *P < 0.05, **P < 0.01, ***P < 0.001 (one-way analysis of variance followed by Tukey's honest significant difference post hoc test). ATP: Adenosine 5′-triphosphate; Ctrl: control; GAPDH: glyceraldehyde-3-phosphate dehydrogenase; IκBα: inhibitor of nuclear factor kappa-B; LPS: lipopolysaccharide; Lup: lupenone; NS: no significance; OE: overexpression; p-IκBα: phosphorylated IκBα; p-p65: phosphorylated p65; vec: vector.
Figure 9
Figure 9
Lup ameliorates overactivation of the NLRP3 inflammasome and NLRP3 activation-induced microglial polarization and pyroptosis through the NF-κB pathway in BV2 cells. (A–D) NLRP3, Arg1, and iNOS expression levels, normalized to the LPS + ATP + vec group. (E–G) Semi-quantitative analysis of NLRP3, Arg1, and iNOS mRNA expression levels, normalized to the LPS + ATP + vec group. (H, I) PI staining was used to analyze pyroptosis in BV2 cells, normalized to the LPS + ATP + vec group. The number of PI-positive cells in the LPS + ATP + OE group was markedly higher than that in the LPS + ATP + vec group; the number of PI-positive cells in the LPS + ATP + OE + Lup group was markedly lower than that in the LPS + ATP + OE group. Scale bar: 300 μm. (J) The level of LDH. (K, L) IL-1β and IL-18 expression levels. Data are expressed as mean ± SD (n = 3). *P < 0.05, **P < 0.01, ***P < 0.001 (one-way analysis of variance followed by Tukey's honestly significant difference post hoc test). Arg1: Arginase 1; ATP: adenosine 5′-triphosphate; DAPI: 4′,6-diamidino-2-phenylindole; GAPDH: glyceraldehyde-3-phosphate dehydrogenase; IL: interleukin; iNOS: inductible nitric oxide synthase; LDH: lactate dehydrogenase; LPS: lipopolysaccharide; Lup: lupenone; NLRP3: NOD-like receptor protein-3; OE: overexpression; PI: propidium iodide; vec: vector.

Similar articles

Cited by

References

    1. Abbaszadeh F, Fakhri S, Khan H. Targeting apoptosis and autophagy following spinal cord injury: Therapeutic approaches to polyphenols and candidate phytochemicals. Pharmacol Res. 2020;160:105069. - PubMed
    1. Al Mamun A, Wu Y, Monalisa I, Jia C, Zhou K, Munir F, Xiao J. Role of pyroptosis in spinal cord injury and its therapeutic implications. J Adv Res. 2021;28:97–109. - PMC - PubMed
    1. Basso DM, Fisher LC, Anderson AJ, Jakeman LB, McTigue DM, Popovich PG. Basso Mouse Scale for locomotion detects differences in recovery after spinal cord injury in five common mouse strains. J Neurotrauma. 2006;23:635–659. - PubMed
    1. Benveniste EN. Role of macrophages/microglia in multiple sclerosis and experimental allergic encephalomyelitis. J Mol Med (Berl) 1997;75:165–173. - PubMed
    1. Brownjohn PW, Smith J, Solanki R, Lohmann E, Houlden H, Hardy J, Dietmann S, Livesey FJ. Functional studies of missense TREM2 mutations in human stem cell-derived microglia. Stem Cell Reports. 2018;10:1294–1307. - PMC - PubMed