

Neutrophil peptide 1 accelerates the clearance of degenerative axons during Wallerian degeneration by activating macrophages after peripheral nerve crush injury
- PMID: 38103249
- PMCID: PMC10960303
- DOI: 10.4103/1673-5374.387978
Neutrophil peptide 1 accelerates the clearance of degenerative axons during Wallerian degeneration by activating macrophages after peripheral nerve crush injury
Abstract
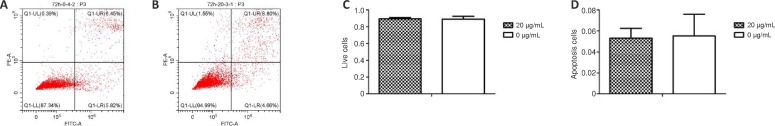
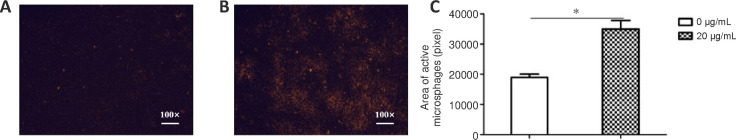
JOURNAL/nrgr/04.03/01300535-202408000-00036/figure1/v/2023-12-16T180322Z/r/image-tiff Macrophages play an important role in peripheral nerve regeneration, but the specific mechanism of regeneration is still unclear. Our preliminary findings indicated that neutrophil peptide 1 is an innate immune peptide closely involved in peripheral nerve regeneration. However, the mechanism by which neutrophil peptide 1 enhances nerve regeneration remains unclear. This study was designed to investigate the relationship between neutrophil peptide 1 and macrophages in vivo and in vitro in peripheral nerve crush injury. The functions of RAW 264.7 cells were elucidated by Cell Counting Kit-8 assay, flow cytometry, migration assays, phagocytosis assays, immunohistochemistry and enzyme-linked immunosorbent assay. Axonal debris phagocytosis was observed using the CUBIC (Clear, Unobstructed Brain/Body Imaging Cocktails and Computational analysis) optical clearing technique during Wallerian degeneration. Macrophage inflammatory factor expression in different polarization states was detected using a protein chip. The results showed that neutrophil peptide 1 promoted the proliferation, migration and phagocytosis of macrophages, and CD206 expression on the surface of macrophages, indicating M2 polarization. The axonal debris clearance rate during Wallerian degeneration was enhanced after neutrophil peptide 1 intervention. Neutrophil peptide 1 also downregulated inflammatory factors interleukin-1α, -6, -12, and tumor necrosis factor-α in vivo and in vitro. Thus, the results suggest that neutrophil peptide 1 activates macrophages and accelerates Wallerian degeneration, which may be one mechanism by which neutrophil peptide 1 enhances peripheral nerve regeneration.
Copyright © 2024 Copyright: © 2024 Neural Regeneration Research.
Conflict of interest statement
Figures


Similar articles
-
Macrophage-specific RhoA knockout delays Wallerian degeneration after peripheral nerve injury in mice.J Neuroinflammation. 2021 Oct 15;18(1):234. doi: 10.1186/s12974-021-02292-y. J Neuroinflammation. 2021. PMID: 34654444 Free PMC article.
-
Role of IL-10 in Resolution of Inflammation and Functional Recovery after Peripheral Nerve Injury.J Neurosci. 2015 Dec 16;35(50):16431-42. doi: 10.1523/JNEUROSCI.2119-15.2015. J Neurosci. 2015. PMID: 26674868 Free PMC article.
-
Neutrophils Are Critical for Myelin Removal in a Peripheral Nerve Injury Model of Wallerian Degeneration.J Neurosci. 2017 Oct 25;37(43):10258-10277. doi: 10.1523/JNEUROSCI.2085-17.2017. Epub 2017 Sep 14. J Neurosci. 2017. PMID: 28912156 Free PMC article.
-
Role of macrophages in Wallerian degeneration and axonal regeneration after peripheral nerve injury.Acta Neuropathol. 2015 Nov;130(5):605-18. doi: 10.1007/s00401-015-1482-4. Epub 2015 Sep 29. Acta Neuropathol. 2015. PMID: 26419777 Review.
-
Wallerian degeneration: gaining perspective on inflammatory events after peripheral nerve injury.J Neuroinflammation. 2011 Aug 30;8:110. doi: 10.1186/1742-2094-8-110. J Neuroinflammation. 2011. PMID: 21878126 Free PMC article. Review.
Cited by
-
Porcine decellularized nerve matrix hydrogel attenuates neuroinflammation after peripheral nerve injury by inhibiting the TLR4/MyD88/NF-κB axis.Neural Regen Res. 2026 Mar 1;21(3):1222-1235. doi: 10.4103/NRR.NRR-D-24-00302. Epub 2024 Nov 13. Neural Regen Res. 2026. PMID: 39589179 Free PMC article.
-
CXCR2 mediated trafficking of neutrophils and neutrophil extracellular traps are required for myelin clearance after a peripheral nerve injury.Exp Neurol. 2024 Dec;382:114985. doi: 10.1016/j.expneurol.2024.114985. Epub 2024 Oct 3. Exp Neurol. 2024. PMID: 39368532
-
Multilevel analysis of the central-peripheral-target organ pathway: contributing to recovery after peripheral nerve injury.Neural Regen Res. 2025 Oct 1;20(10):2807-2822. doi: 10.4103/NRR.NRR-D-24-00641. Epub 2024 Oct 22. Neural Regen Res. 2025. PMID: 39435615 Free PMC article.
-
Autophagy-targeting modulation to promote peripheral nerve regeneration.Neural Regen Res. 2025 Jul 1;20(7):1864-1882. doi: 10.4103/NRR.NRR-D-23-01948. Epub 2024 May 13. Neural Regen Res. 2025. PMID: 39254547 Free PMC article.
References
-
- Aarbiou J, Ertmann M, van Wetering S, van Noort P, Rook D, Rabe KF, Litvinov SV, van Krieken JH, de Boer WI, Hiemstra PS. Human neutrophil defensins induce lung epithelial cell proliferation in vitro. J Leukoc Biol. 2002;72:167–174. - PubMed
-
- Aarbiou J, Verhoosel RM, Van Wetering S, De Boer WI, Van Krieken JH, Litvinov SV, Rabe KF, Hiemstra PS. Neutrophil defensins enhance lung epithelial wound closure and mucin gene expression in vitro. Am J Respir Cell Mol Biol. 2004;30:193–201. - PubMed
-
- Bastien D, Lacroix S. Cytokine pathways regulating glial and leukocyte function after spinal cord and peripheral nerve injury. Exp Neurol. 2014;258:62–77. - PubMed
-
- Caputo JL. Biosafety procedures in cell culture. J Tissue Cult Methods. 1988;11:223–227.
LinkOut - more resources
Full Text Sources
