

From simple to even simpler, but not too simple: a head-to-head comparison of the Better-Worse and Drop-Down methods for measuring patient health status
- PMID: 38104119
- PMCID: PMC10725035
- DOI: 10.1186/s12874-023-02119-9
From simple to even simpler, but not too simple: a head-to-head comparison of the Better-Worse and Drop-Down methods for measuring patient health status
Abstract
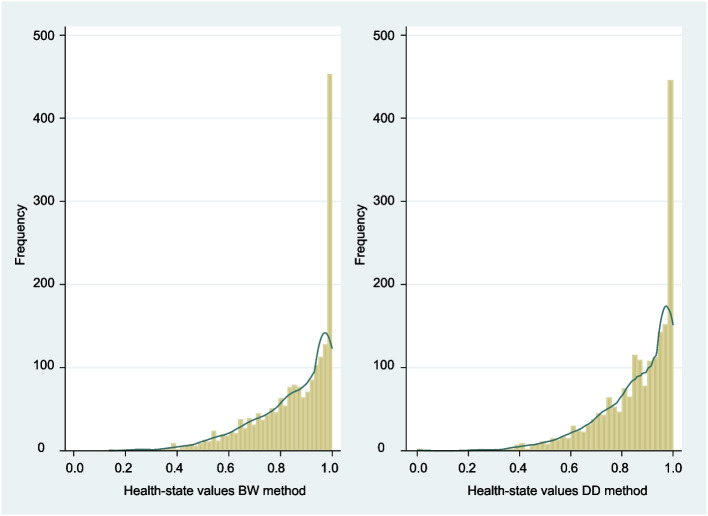
Background: We recently developed a novel, preference-based method (Better-Worse, BW) for measuring health status, expressed as a single metric value. We have since expanded it by developing the Drop-Down (DD) method. This article presents a head-to-head comparison of these two methods. We explored user feasibility, interpretability and statistics of the estimated coefficients, and distribution of the computed health-state values.
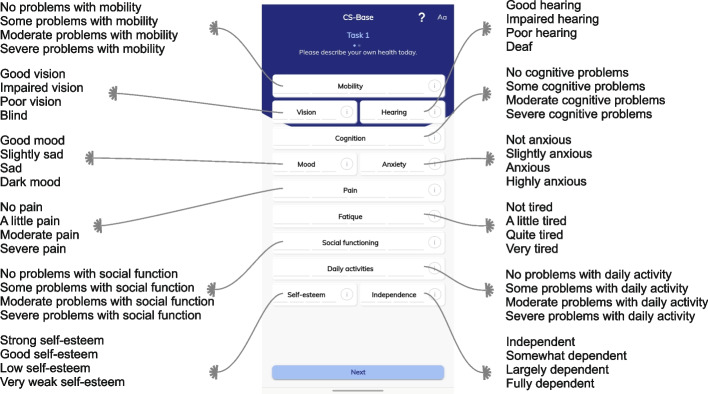
Methods: We conducted a cross-sectional online survey among patients with various diseases in the USA. The BW and DD methods were applied in the two arms of the study, albeit in reverse order. In both arms, patients first performed a descriptive task (Task 1) to rate their own health status according to the 12 items (each with 4 levels) in the CS-Base health-outcome instrument. They then performed Task 2, in which they expressed preferences for health states by the two methods. We then estimated coefficients for all levels of each item using logistic regression and used these to compute values for health states.
Results: Our total sample comprised 1,972 patients. Completion time was < 2 min for both methods. Both methods were scored as easy to perform. All DD coefficients were highly significant from the reference level (P < 0.001). For BW, however, only the second-level coefficient of "Cognition" was significantly different (P = 0.026). All DD coefficients were more precise with narrower confidence intervals than those of the BW method.
Conclusions: Both the BW and DD are novel methods that are easy to apply. The DD method outperformed the BW method in terms of the precision of produced coefficients. Due to its task, it is free from a specific distorting factor that was observed for the BW method.
Keywords: Health status; Health-related quality of life (HRQoL); Measurement model; Patient-reported outcome measures (PROMs); Preference-based; Values.
© 2023. The Author(s).
Conflict of interest statement
The authors declare no competing interests.
Figures


Similar articles
-
Experience-Based Swedish TTO and VAS Value Sets for EQ-5D-5L Health States.Pharmacoeconomics. 2020 Aug;38(8):839-856. doi: 10.1007/s40273-020-00905-7. Pharmacoeconomics. 2020. PMID: 32307663
-
EuroQol (EQ-5D-5L) Validity in Assessing the Quality of Life in Adults With Asthma: Cross-Sectional Study.J Med Internet Res. 2019 Jan 23;21(1):e10178. doi: 10.2196/10178. J Med Internet Res. 2019. PMID: 30672744 Free PMC article.
-
Health-related quality of life and its association with socioeconomic status and diet diversity in Chinese older adults.Front Public Health. 2023 Jan 20;10:999178. doi: 10.3389/fpubh.2022.999178. eCollection 2022. Front Public Health. 2023. PMID: 36743155 Free PMC article.
-
A review of preference-based measures for the assessment of quality of life in children and adolescents with cerebral palsy.Qual Life Res. 2018 Jul;27(7):1781-1799. doi: 10.1007/s11136-018-1837-0. Epub 2018 Mar 22. Qual Life Res. 2018. PMID: 29569017
-
Are We Agreed? Self- Versus Proxy-Reporting of Paediatric Health-Related Quality of Life (HRQoL) Using Generic Preference-Based Measures: A Systematic Review and Meta-Analysis.Pharmacoeconomics. 2022 Nov;40(11):1043-1067. doi: 10.1007/s40273-022-01177-z. Epub 2022 Aug 23. Pharmacoeconomics. 2022. PMID: 35997957 Free PMC article.
Cited by
-
Measuring health-related quality of life in cardiovascular disease using a novel patient-centred and disease-specific patient-reported outcome measure.Int J Cardiol Cardiovasc Risk Prev. 2024 Dec 11;24:200357. doi: 10.1016/j.ijcrp.2024.200357. eCollection 2025 Mar. Int J Cardiol Cardiovasc Risk Prev. 2024. PMID: 39802169 Free PMC article.
-
Different Frameworks, Similar Results? Head-to-Head Comparison of the Generic Preference-Based Health-Outcome Measures CS-Base and EQ-5D-5L.Appl Health Econ Health Policy. 2024 Mar;22(2):227-242. doi: 10.1007/s40258-023-00837-1. Epub 2023 Oct 12. Appl Health Econ Health Policy. 2024. PMID: 37824057 Free PMC article.
References
-
- Krabbe PFM. The Measurement of Health and Health Status: Concepts, Methods, and Applications from a Multidisciplinary Perspective. London (UK): Academic Press; 2017.
-
- Lam CLK. Subjective quality of life measures − general principles and concepts. In: Preedy VR, Watson R, editors. Handbook of Disease Burdens and Quality of Life Measures. New York (USA): Springer; 2010. pp. 381–399.
-
- Food and Drug Administration Guidance for industry. Patient-reported outcome measures: Use in medical product development to support labeling claims. Federal Registe. 2009;74(35):65132–65133.
-
- National Institute for Health and Care Excellence (NICE). Guide to the methods of technology appraisal. 2013. https://www.nice.org.uk/process/pmg9. Accessed 30 Nov 2023. - PubMed
-
- Cella D, Hahn EA, Jensen SE, Butt Z, Nowinski CJ, Rothrock N, Lohr KN. Patient-Reported Outcomes in Performance Measurement. Research Triangle Park (USA): RTI Press; 2015. - PubMed
Publication types
MeSH terms
LinkOut - more resources
Full Text Sources
Other Literature Sources
