. 2023 Dec 16;14(1):8379.
doi: 10.1038/s41467-023-43801-2.

Local energetic frustration conservation in protein families and superfamilies

Affiliations

Local energetic frustration conservation in protein families and superfamilies

Maria I Freiberger et al. Nat Commun. .

Abstract

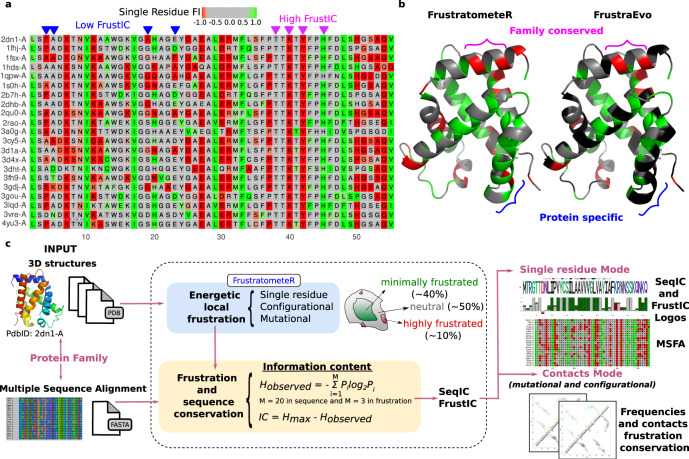
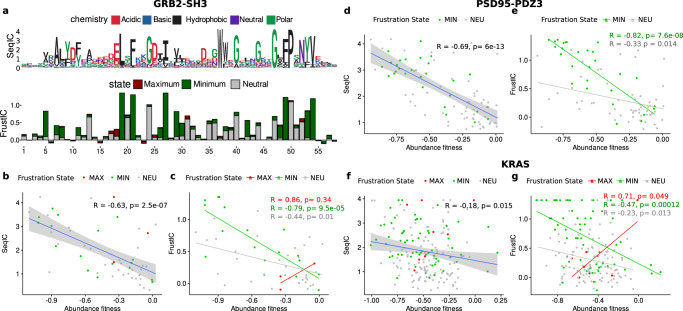
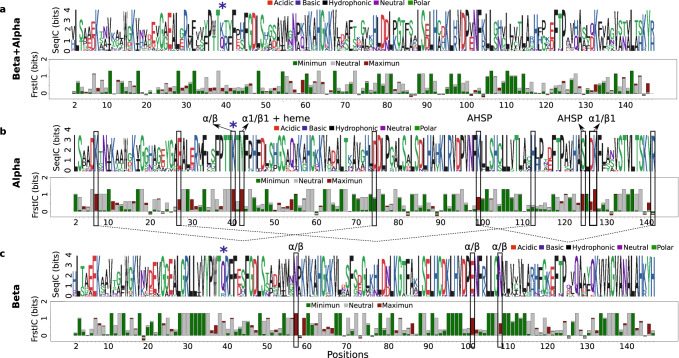
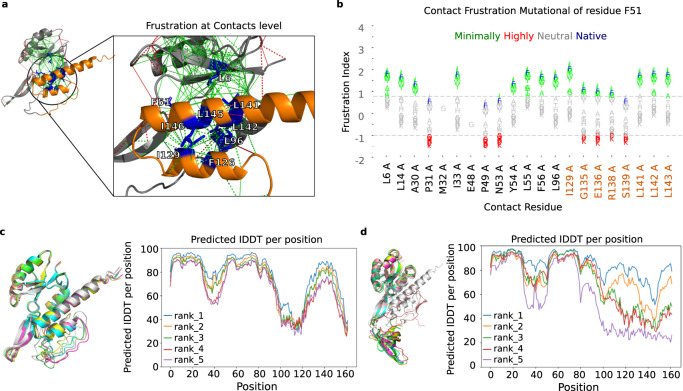
Energetic local frustration offers a biophysical perspective to interpret the effects of sequence variability on protein families. Here we present a methodology to analyze local frustration patterns within protein families and superfamilies that allows us to uncover constraints related to stability and function, and identify differential frustration patterns in families with a common ancestry. We analyze these signals in very well studied protein families such as PDZ, SH3, ɑ and β globins and RAS families. Recent advances in protein structure prediction make it possible to analyze a vast majority of the protein space. An automatic and unsupervised proteome-wide analysis on the SARS-CoV-2 virus demonstrates the potential of our approach to enhance our understanding of the natural phenotypic diversity of protein families beyond single protein instances. We apply our method to modify biophysical properties of natural proteins based on their family properties, as well as perform unsupervised analysis of large datasets to shed light on the physicochemical signatures of poorly characterized proteins such as the ones belonging to emergent pathogens.


Conflict of interest statement

The authors declare no competing interests.

Figures

Fig. 1
Fig. 1. Analysis of frustration in protein families.
a Multiple Sequence Frustration Alignment (MSFA) that consists of the SRFI computed from individual protein structures mapped into the MSA (see Methods). Residues in the MSA are colored according to their SRFI in the corresponding structures. Magenta inverted triangles mark frustrationally conserved residues (high FrustIC), and blue ones mark non-frustrationally conserved residues (low FrustIC). Minimally frustrated residues are colored in shades of green, neutral in gray and highly frustrated in red. b Comparison between SRFI values as calculated by FrustratometeR (left) and the conservation of frustration states based on their FrustIC values as calculated by FrustraEvo (right) visualized in the same structure (human ɑ globin, PDB 2DN1, chain A). Residues are colored according to their frustration states in the FrustratometeR representation. Residues with FrstIC > 0.5 are colored according to their most informative frustration state in the FrustraEvo representation, while residues with FrstIC ≤ 0.5 are colored in black. c Overview of the FrustraEvo workflow to analyze a single protein family.
Fig. 2
Fig. 2. FrustIC correlates with experimentally measured protein stability changes.
a Sequence and Frustration logo plots showing SeqIC and FrustIC values per MSA column, respectively for GRB2-SH3. The numbering of the plot corresponds to the sequence of reference (chain A from PDB 2VWF in the case of GRB2-SH3). Positions containing a gap in the sequence of reference are not considered in the plot. bf Pearson correlation between ddPCA abundance scores vs SeqIC and FrustIC for GRB2-SH3 (b, c), PSD95-PDZ3 (d, e) and KRAS (f, g). P value corresponds to a two-sided test. Error bands in the correlation plots correspond to a 95% confidence interval. Source data are provided as a Source Data file.
Fig. 3
Fig. 3. Differential frustration conservation patterns unmask functional constraints in the hemoglobin subunits.
FrustraEvo results based on the SRFI for a ɑ/β-globins, b only ɑ, and c only β. Rectangles denote functionally relevant positions explained in more detail in Supplementary Table 2. In blue asterisks, we marked position 39 in the ɑ/β MSA, which corresponds to a highly frustrated Lys40ɑ but to a neutral Gln39β. The reference structure for this analysis corresponds to the Human Hemoglobin PDB 2DN1. Source data are provided as a Source Data file.
Fig. 4
Fig. 4. Large-scale application of frustration conservation analysis in coronaviruses.
a Pearson correlation plot showing mean FrustIC vs mean SeqIC per S3Det cluster computed for Coronavirus proteins (see Methods). P value corresponds to a two-sided test. Error bands in the correlation plots correspond to a 95% confidence interval. b Distribution of frustrationally conserved residues (FrustIC > 0.5) for each S3Det cluster containing the corresponding SARS-CoV-2 protein. We considered frustration conservation when FrustIC > 0.5. The proportion of each protein is normalized by its length (Supplemental Table 3). c MSFA showing FrustraEvo results for selected functional domains in PLPro. Cells that are colored correspond to FrustIC > 0.5, while white cells mean that FrustIC ≤ 0.5. Color of the cells represents the median SRFI value computed with FrustratometeR (see methods for frustration states definitions). The amino acid identities correspond to the consensus sequence, and the size of the letter is proportional to SeqIC. Source data are provided as a Source Data file.
Fig. 5
Fig. 5. Frustration analysis of a metamorphic protein conformational change.
a FrustraEvo Mutational index results. Red lines correspond to highly frustrated interactions, and green lines to minimally frustrated interactions (see Methods). Orange backbone corresponds to the interdomain region (CTD), and residues in blue and sticks are the nine interface residues. b Frustration changes upon mutation for Phe 51 using FrustratometeR. The x axis shows the residues with which the residue, either wild-type (Phe) or mutated, establishes contacts in the structure. In the y axis, we show the mutational frustration index for the contacts. The wild-type amino-acid identity is shown in blue, and the variants are colored according to their frustration state. c AlphaFold2 top five predicted models superimposed for RfaH containing different sets of mutations for SFMs and d HFMs. Source data are provided as a Source Data file.

References

    1. Chothia C, Gough J, Vogel C, Teichmann SA. Evolution of the protein repertoire. Science. 2003;300:1701–1703. doi: 10.1126/science.1085371. - DOI - PubMed
    1. Tokuriki N, Tawfik DS. Stability effects of mutations and protein evolvability. Curr. Opin. Struct. Biol. 2009;19:596–604. doi: 10.1016/j.sbi.2009.08.003. - DOI - PubMed
    1. Bastolla U, Roman HE, Vendruscolo M. Neutral evolution of model proteins: diffusion in sequence space and overdispersion. J. Theor. Biol. 1999;200:49–64. doi: 10.1006/jtbi.1999.0975. - DOI - PubMed
    1. Casari G, Sander C, Valencia A. A method to predict functional residues in proteins. Nat. Struct. Biol. 1995;2:171–178. doi: 10.1038/nsb0295-171. - DOI - PubMed
    1. Rausell A, Juan D, Pazos F, Valencia A. Protein interactions and ligand binding: from protein subfamilies to functional specificity. Proc. Natl. Acad. Sci. USA. 2010;107:1995–2000. doi: 10.1073/pnas.0908044107. - DOI - PMC - PubMed

Publication types

MeSH terms