. 2023 Dec 16;13(1):22406.
doi: 10.1038/s41598-023-49440-3.

Mass spectrometry in cerebrospinal fluid uncovers association of glycolysis biomarkers with Alzheimer's disease in a large clinical sample

Affiliations

Mass spectrometry in cerebrospinal fluid uncovers association of glycolysis biomarkers with Alzheimer's disease in a large clinical sample

Matthijs B de Geus et al. Sci Rep. .

Abstract

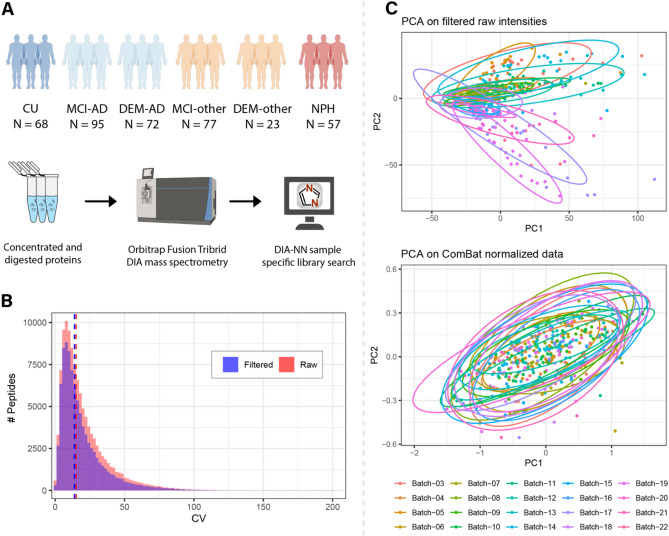
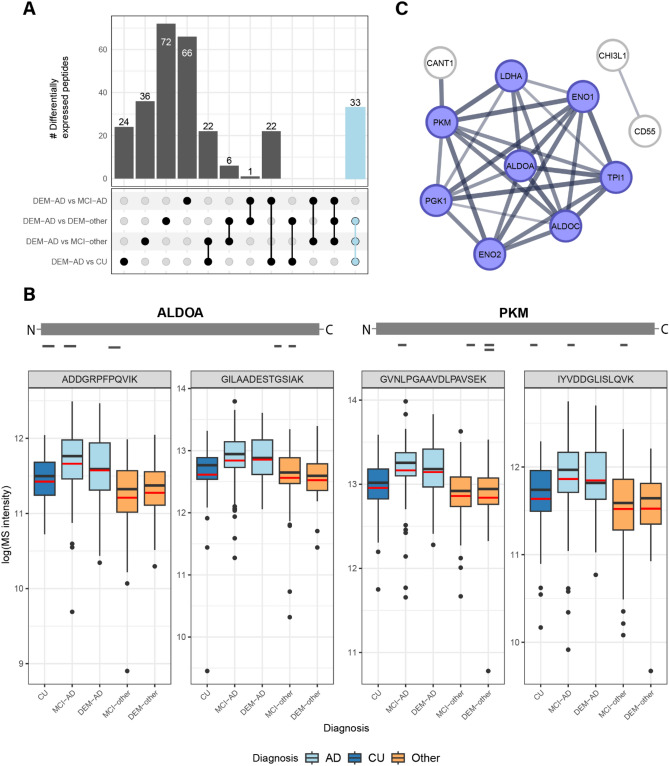
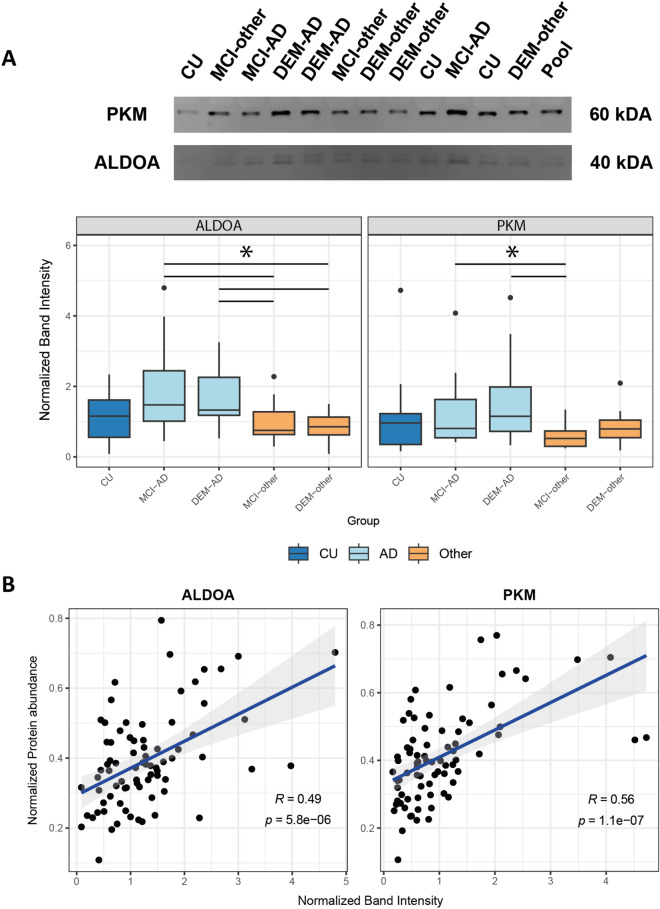
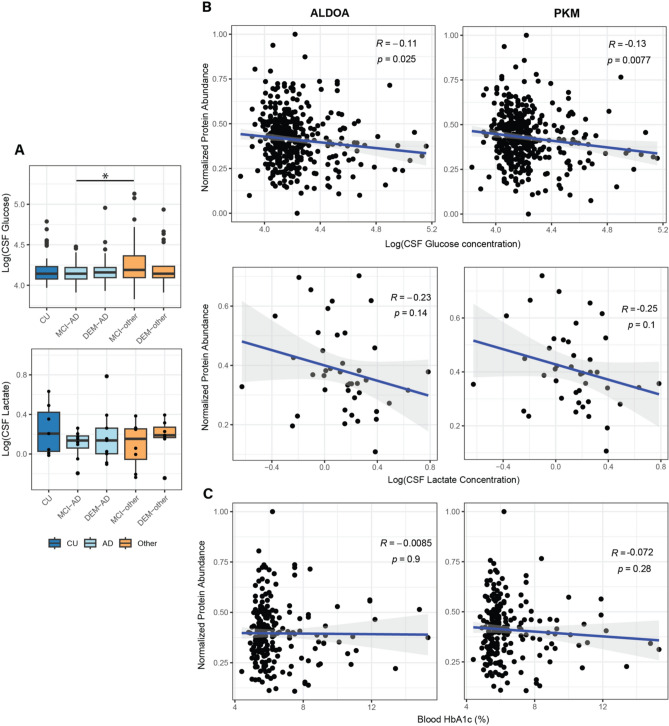
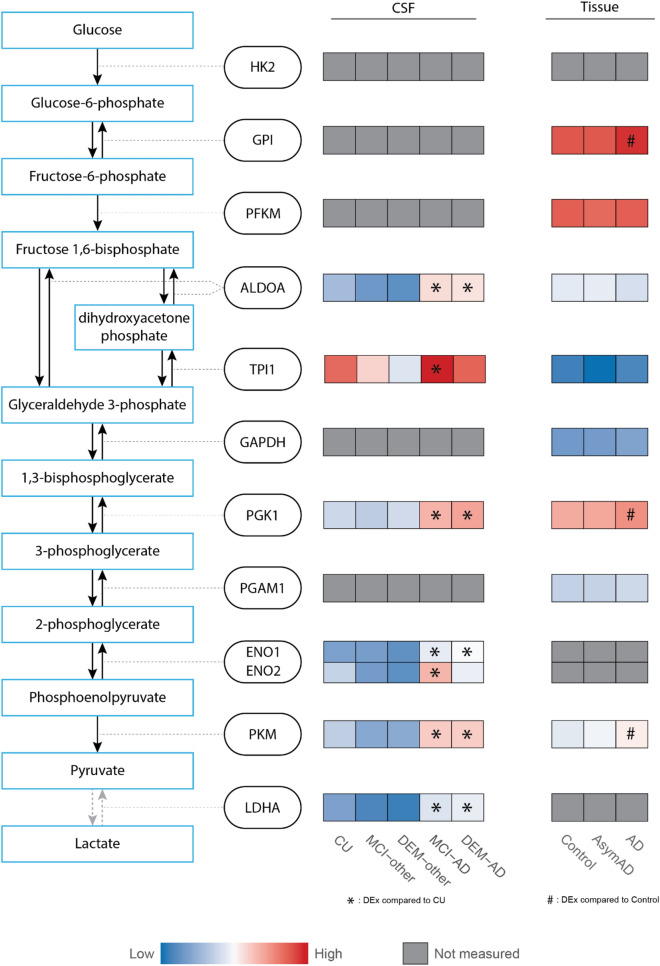
Alzheimer's disease (AD) is a complex and heterogeneous neurodegenerative disorder with contributions from multiple pathophysiological pathways. One of the long-recognized and important features of AD is disrupted cerebral glucose metabolism, but the underlying molecular basis remains unclear. In this study, unbiased mass spectrometry was used to survey CSF from a large clinical cohort, comparing patients who are either cognitively unimpaired (CU; n = 68), suffering from mild-cognitive impairment or dementia from AD (MCI-AD, n = 95; DEM-AD, n = 72), or other causes (MCI-other, n = 77; DEM-other, n = 23), or Normal Pressure Hydrocephalus (NPH, n = 57). The results revealed changes related to altered glucose metabolism. In particular, two glycolytic enzymes, pyruvate kinase (PKM) and aldolase A (ALDOA), were found to be upregulated in CSF from patients with AD compared to those with other neurological conditions. Increases in full-length PKM and ALDOA levels in CSF were confirmed with immunoblotting. Levels of these enzymes furthermore correlated negatively with CSF glucose in matching CSF samples. PKM levels were also found to be increased in AD in publicly available brain-tissue data. These results indicate that ALDOA and PKM may act as technically-robust potential biomarkers of glucose metabolism dysregulation in AD.


Conflict of interest statement

S. Arnold has received honoraria and/or travel expenses for lectures from Abbvie, Eisai, and Biogen and has served on scientific advisory boards of Corte, has received consulting fees from Athira, Cassava, Cognito Therapeutics, EIP Pharma and Orthogonal Neuroscience, and has received research grant support from NIH, Alzheimer’s Association, Alzheimer’s Drug Discovery Foundation, Abbvie, Amylyx, EIP Pharma, Merck, Janssen/Johnson & Johnson, Novartis, and vTv. S.N. Leslie is a current employee of Janssen Pharmaceuticals. B. Carlyle has received grant funding from Ono Pharmaceutical. Other authors report no conflicts of interest.

Figures

Figure 1
Figure 1
Experimental workflow and MS processing. (A) Overview of cohort numbers and a schematic overview of the sample processing. (B) Distribution of duplicate CV before (red) and after (blue) filtering of peptides that were measured in over 80% of all samples. After filtering the median duplicate CV dropped from 15.1 to 14.0%. (C) Principal component analyses before and after ComBat batch correction of the data. Dots represent individual samples and are colored by their corresponding batch. Before ComBat batch correction, a clear separation by batch can be observed in the first two principal components. This batch effect was mitigated after batch correction indicated by an overlap of the samples between batches.
Figure 2
Figure 2
General upregulation of glycolytic enzymes is observed in AD CSF. (A) UpSet plot showing an overview of the differentially expressed peptides between DEM-AD and any non-AD group. The 33 peptides that were differentially abundant between DEM-AD and all non-AD group is highlighted in light blue. (B) Schematic representation of the peptide coverage of ALDOA and PKM in the MS data. Boxplots indicate the MS-intensity levels of 2 selected peptides from ALDOA and PKM each that were differentially expressed in an AD enriched pattern. Red lines indicate the mean. (C) Selected cluster from the STRING-DB analysis highlighting the enrichment of proteins involved in energy metabolism in AD CSF. Blue indicates proteins from the GO-term “canonical glycolysis”.
Figure 3
Figure 3
Immunoblotting of ALDOA and PKM indicate the presence of full-length proteins in CSF. (A) Western blot bands at the expected sizes of 60 kDa for PKM and at 40 kDa for ALDOA indicate the presence full length protein. Normalized band intensities of ALDOA and PKM follow similar AD enrichment pattern across groups as the protein level quantifications for ALDOA and PKM (*: Post-hoc Dunn test p < 0.05). Original blots are presented in Supplementary Fig. 4A. (B) Protein level MS-intensity of both ALDOA and PKM are significantly correlated with the normalized western blot band intensity. This positive correlation indicates the presence of full-length ALDOA and PKM proteins in CSF.
Figure 4
Figure 4
Levels of glucose, lactate and HbA1c in CSF in relation to glycolytic enzymes. (A) Levels of glucose and lactate in CSF across groups. CSF glucose levels were only found to be downregulated in MCI-AD compared to MCI-other. CSF lactate levels were not found to be significantly differentially abundant between any diagnostic group (*: Pearson’s correlation p < 0.05). (B) Protein level MS intensities for ALDOA and PKM showed a significant negative correlation with the CSF glucose levels. A negative trend was observed between CSF lactate and ALDOA and PKM protein abundance, but this trend did not reach significance. (C) No correlation was observed between peripheral glucose metabolism marker HbA1c and MS intensities for ALDOA and PKM proteins.
Figure 5
Figure 5
General elevation of glycolytic enzymes in AD is observed in both CSF and brain tissue. Heatmap representation of protein abundance of glycolytic enzymes measured in our CSF dataset and from a publicly available tissue dataset. Levels of ALDOA, PGK1, ENO1, PKM and LDHA were significantly upregulated in DEM-AD compared to CU in CSF. In tissue, GPI, PGK1 and PKM were significantly upregulated in AD compared to Controls (*: post hoc Tukey test p < 0.05). Protein abundances were scaled within each dataset and colors represent relative protein abundance. Gray boxes indicate proteins that were not robustly quantified in CSF or tissue.

Update of

References

    1. Aaa A. 2022 Alzheimer’s disease facts and figures. Alzheimer’s Dement. 2022;18(4):700–789. doi: 10.1002/ALZ.12638. - DOI - PubMed
    1. Chiti F, Christopher MD. Protein misfolding, amyloid formation, and human disease: A summary of progress over the last decade. Ann. Rev. Biochem. 2017;86:27–68. doi: 10.1146/ANNUREV-BIOCHEM-061516-045115. - DOI - PubMed
    1. Heppner FL, Ransohoff RM, Becher B. Immune attack: The role of inflammation in Alzheimer disease. Nat. Rev. Neurosci. 2015;16(6):358–372. doi: 10.1038/NRN3880. - DOI - PubMed
    1. Santos CY, Snyder PJ, Wu WC, Zhang M, Echeverria A, Alber J. Pathophysiologic relationship between Alzheimer’s disease, cerebrovascular disease, and cardiovascular risk: A review and synthesis. Alzheimer’s Dement. Diagn. Assess. Dis. Monit. 2017;7(1):69–87. doi: 10.1016/J.DADM.2017.01.005. - DOI - PMC - PubMed
    1. Ribe EM, Lovestone S. Insulin signalling in Alzheimer′s disease and diabetes: From epidemiology to molecular links. J. Intern. Med. 2016;280(5):430–442. doi: 10.1111/JOIM.12534. - DOI - PubMed

MeSH terms