Adaptive thresholding increases sensitivity to detect changes in the rate of skin conductance responses to psychologically arousing stimuli in both laboratory and ambulatory settings
- PMID: 38104772
- PMCID: PMC10872538
- DOI: 10.1016/j.ijpsycho.2023.112280
Adaptive thresholding increases sensitivity to detect changes in the rate of skin conductance responses to psychologically arousing stimuli in both laboratory and ambulatory settings
Abstract
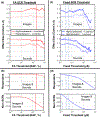
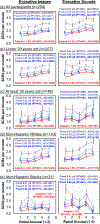
Psychophysiologists recording electrodermal activity (EDA) often derive measures of slow, tonic activity-skin conductance level (SCL)-and faster, more punctate changes-skin conductance responses (SCRs). A SCR is conventionally considered to have occurred when the local amplitude of the EDA signal exceeds a researcher-determined threshold (e.g., 0.05 μS), typically fixed across study participants and conditions. However, fixed SCR thresholds can preferentially exclude data from individuals with low SCL because their SCRs are smaller on average, thereby reducing statistical power for group-level analyses. Thus, we developed a fixed plus adaptive (FA) thresholding method that adjusts identification of SCRs based on an individual's SC at the onset of the SCR to increase statistical power and include data from more participants. We assess the utility of applying FA thresholding across two independent samples and explore age and race-related associations with EDA outcomes. Study 1 uses wired EDA measurements from 254 healthy adults responding to evocative images and sounds in a laboratory setting. Study 2 uses wireless EDA measurements from 20 children with autism in a clinical environment while they completed behavioral tasks. Compared to a 0.01, 0.03, and 0.05 μS fixed threshold, FA thresholding at 1.9% modestly increases statistical power to detect a difference in SCR rate between tasks with higher vs. lower subjective arousal and reduces exclusion of participants by up to 5% across both samples. This novel method expands the EDA analytical toolbox and may be useful in populations with highly variable basal SCL or when comparing groups with different basal SCL. Future research should test for reproducibility and generalizability in other tasks, samples, and contexts. IMPACT STATEMENTS: This article is important because it introduces a novel method to enhance sensitivity and statistical power in analyses of skin conductance responses from electrodermal data.
Keywords: Electrodermal activity (EDA); Research equity; Sensitivity; Skin conductance response (SCR); Statistical power.
Copyright © 2023. Published by Elsevier B.V.
Conflict of interest statement
Declaration of competing interest Catherine Lord receives royalties for the diagnostic instruments, the ADOS and the ADI-R, all proceeds that were related to this study are donated to charity. The other authors declare no potential conflicts of interest.
Figures


Similar articles
-
The correlations among the skin conductance features responding to physiological stress stimuli.Skin Res Technol. 2021 Jul;27(4):582-588. doi: 10.1111/srt.12989. Epub 2020 Dec 30. Skin Res Technol. 2021. PMID: 33381876
-
Breathe Easy EDA: A MATLAB toolbox for psychophysiology data management, cleaning, and analysis.F1000Res. 2018 Feb 22;7:216. doi: 10.12688/f1000research.13849.2. eCollection 2018. F1000Res. 2018. PMID: 30647904 Free PMC article.
-
Power Spectral Density Analysis of Electrodermal Activity for Sympathetic Function Assessment.Ann Biomed Eng. 2016 Oct;44(10):3124-3135. doi: 10.1007/s10439-016-1606-6. Epub 2016 Apr 8. Ann Biomed Eng. 2016. PMID: 27059225
-
[The measurement of electrodermal activity].Encephale. 2012 Apr;38(2):149-55. doi: 10.1016/j.encep.2011.05.004. Epub 2011 Oct 11. Encephale. 2012. PMID: 22516273 Review. French.
-
Electrodermal responses: what happens in the brain.Neuroscientist. 2002 Apr;8(2):132-42. doi: 10.1177/107385840200800209. Neuroscientist. 2002. PMID: 11954558 Review.
Cited by
-
Exploring emotions beyond the laboratory: A review of emotional and physiological ecological momentary assessment methods in children and youth.Psychophysiology. 2024 Dec;61(12):e14699. doi: 10.1111/psyp.14699. Epub 2024 Oct 4. Psychophysiology. 2024. PMID: 39367539 Free PMC article. Review.
-
Fear-related psychophysiological patterns are situation and individual dependent: A Bayesian model comparison approach.Emotion. 2024 Mar;24(2):506-521. doi: 10.1037/emo0001265. Epub 2023 Aug 21. Emotion. 2024. PMID: 37603002 Free PMC article.
-
A Review on Assisted Living Using Wearable Devices.Sensors (Basel). 2024 Nov 21;24(23):7439. doi: 10.3390/s24237439. Sensors (Basel). 2024. PMID: 39685975 Free PMC article. Review.
-
Examining Stress and Residual Symptoms in Remitted and Partially Remitted Depression Using a Wearable Electrodermal Activity Device: A Pilot Study.IEEE J Transl Eng Health Med. 2022 Dec 12;11:96-106. doi: 10.1109/JTEHM.2022.3228483. eCollection 2023. IEEE J Transl Eng Health Med. 2022. PMID: 36644642 Free PMC article.
-
The psychophysiological mechanisms of real-world time experience.Sci Rep. 2022 Jul 28;12(1):12890. doi: 10.1038/s41598-022-16198-z. Sci Rep. 2022. PMID: 35902608 Free PMC article.
References
-
- Bach DR, Melinščak F, Fleming SM, & Voelkle MC (2020). Calibrating the experimental measurement of psychological attributes. Nat Hum Behav, 4(12), 1229–1235. - PubMed
MeSH terms
Grants and funding
LinkOut - more resources
Full Text Sources
Research Materials
Miscellaneous

