. 2023 Dec 17;13(1):22451.
doi: 10.1038/s41598-023-50059-7.

Depletion of muscularis macrophages ameliorates inflammation-driven dysmotility in murine colitis model

Affiliations

Depletion of muscularis macrophages ameliorates inflammation-driven dysmotility in murine colitis model

Szilamér Ferenczi et al. Sci Rep. .

Abstract

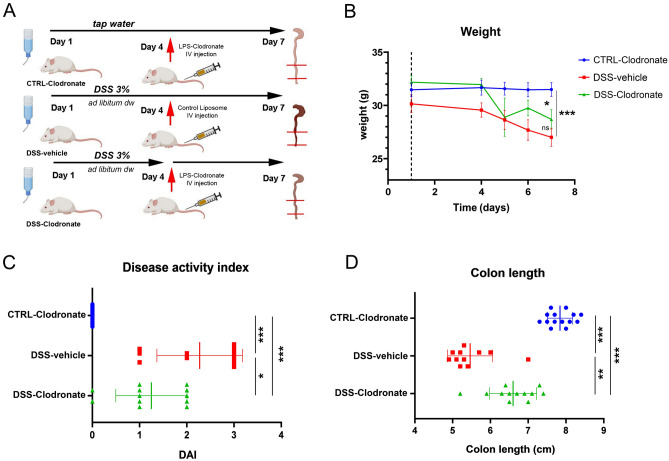
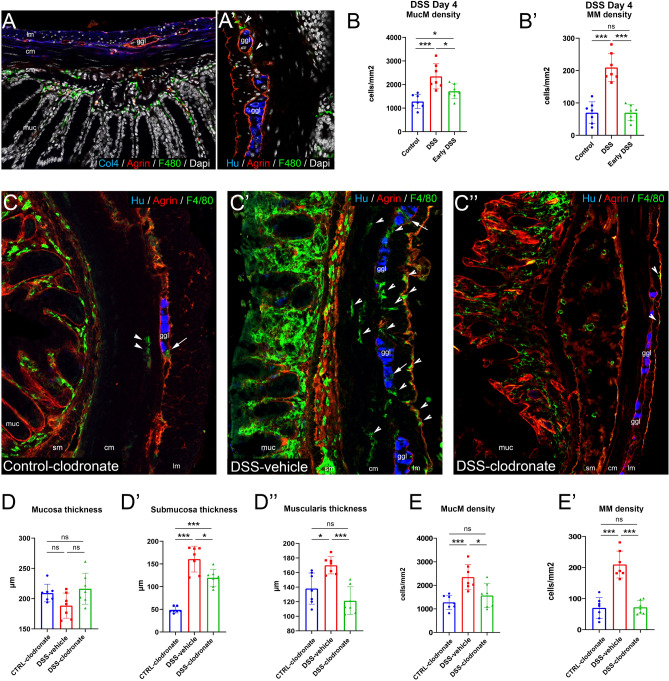
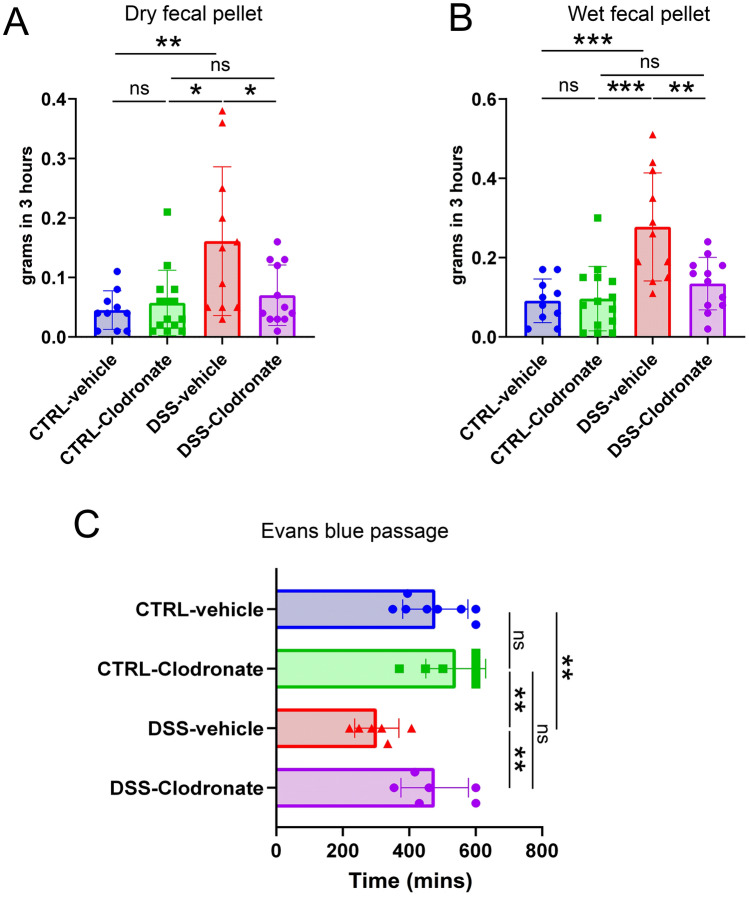
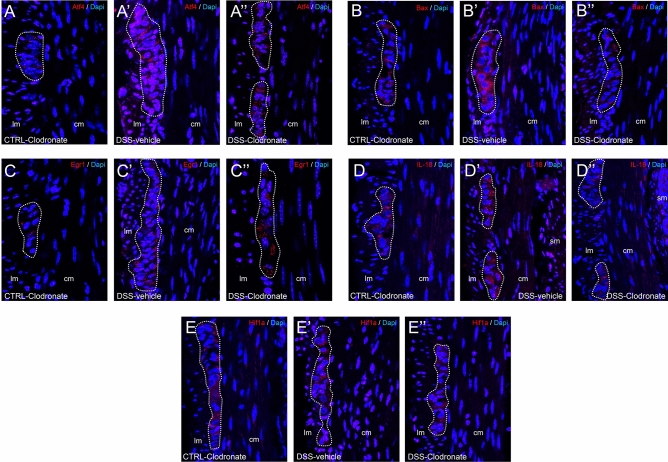
Previously, the presence of a blood-myenteric plexus barrier and its disruption was reported in experimentally induced colitis via a macrophage-dependent process. The aim of this study is to reveal how myenteric barrier disruption and subsequent neuronal injury affects gut motility in vivo in a murine colitis model. We induced colitis with dextran sulfate sodium (DSS), with the co-administration of liposome-encapsulated clodronate (L-clodronate) to simultaneously deplete blood monocytes contributing to macrophage infiltration in the inflamed muscularis of experimental mice. DSS-treated animals receiving concurrent L-clodronate injection showed significantly decreased blood monocyte numbers and colon muscularis macrophage (MM) density compared to DSS-treated control (DSS-vehicle). DSS-clodronate-treated mice exhibited significantly slower whole gut transit time than DSS-vehicle-treated animals and comparable to that of controls. Experiments with oral gavage-fed Evans-blue dye showed similar whole gut transit times in DSS-clodronate-treated mice as in control animals. Furthermore, qPCR-analysis and immunofluorescence on colon muscularis samples revealed that factors associated with neuroinflammation and neurodegeneration, including Bax1, Hdac4, IL-18, Casp8 and Hif1a are overexpressed after DSS-treatment, but not in the case of concurrent L-clodronate administration. Our findings highlight that MM-infiltration in the muscularis layer is responsible for colitis-associated dysmotility and enteric neuronal dysfunction along with the release of mediators associated with neurodegeneration in a murine experimental model.


Conflict of interest statement

The authors declare no competing interests.

Figures

Figure 1
Figure 1
Experimental design and colitis phenotype. Illustrated flowchart demonstrated study design (A), where experimental groups of CTRL-clodronate, DSS-vehicle and DSS-clodronate-treated mice are shown. Weight (grams) of animals monitored during the experiment is shown in (B). Weight of DSS-vehicle-treated mice decreased significantly, by 22.9% (p < 0.001) as expected, but was not significantly different from those who received l-clodronate during DSS-treatment (p = 0.076). A moderate, but significant weight-loss (17.5%) occurred in DSS-clodronate-treated mice compared to control littermates (p = 0.012). Disease activity index (DAI) was significantly higher in the DSS-vehicle group compared to the control (p < 0.001) and DSS-clodronate (p = 0.014) treated experimental groups. The latter showed a significant difference compared to the control group (p < 0.001) as well (C). Colon of DSS-vehicle-treated animals were significantly shortened compared to control (p < 0.001) and DSS-clodronate treated animals (p = 0.001), but colon length of the latter was also significantly shorter compared to that of control mice (p < 0.001) (D). Metric data are shown as mean and corresponding standard deviation (SD). Statistical significance *p < 0.05; **p < 0.01, ***p < 0.001.
Figure 2
Figure 2
Flow cytometry analysis of experimental mouse blood samples. Scatter plots show all events displaying cells according to SSC (axis y) and FSC (axis x). PBMCs are colored as lymphocytes (red) and monocytes (blue). Supposed granulocyte population is labeled with oval dashed curve, showing no alteration due to treatment (AB′). Depletion of monocytes after l-clodronate treatment is shown with rectangles (A,A′). SSC-Ly6C plots display cells according to their expression of the monocyte marker (x axis) showing a “high” (green rectangle, > 106), a “low” (103–106) and a “negative” (< 103) population. Magenta rectangle encircles Ly6C-positive cells including all “low” and “high” cells (CD′). Interestingly, a fraction of lymphocytes and all granulocytes express a low level of Ly6C (CD′). Panels (EF′) exhibit cell distribution according to their CD45 (x axis) and Ly6C (y axis) expression. Double negative events on the bottom left are identified as cell debris and thrombocytic fragments. Bar charts on panels (G) and (H) show the comparison of Ly6Chigh monocytes compared to all leukocytes (PBMCs + granulocytes) identified among events and to PBMCs identified. A significantly lower percentage of Ly6C+ monocytes were identified in both control and DSS-treated experimental conditions when calculating for all leukocytes (p < 0.001 and p = 0.041) and for all PBMCs (p = 0.004 and p = 0.028). However, no significant change, only a trend was detected when comparing control- and DSS-vehicle mice (p = 0.197 and p = 0.111, respectively), and l-clodronate treated animals from the control and DSS-groups showed no significant differences in the percentage of Ly6Chigh cells (p = 0.523 and p = 0.614, respectively). (AB′) Cells in blue: monocyte part of PBMC population based on SSC-FSC diagram; cells in red: lymphocyte part of PBMC population based on SSC-FSC diagram. Rectangle: monocytes, oval dashed line: granulocyte population based on SSC-FSC diagram. (CF′) cells in blue: Ly6C− monocytes; cells in red: lymphocytes; cells in magenta: Ly6C+ monocytes (“high” or “low”); cells in yellow: granulocytes; cells in black: debris, thrombocytes. Metric data are shown as mean and corresponding standard deviation (SD). Statistical significance *p < 0.05; **p < 0.01, ***p < 0.001.
Figure 3
Figure 3
The effect of DSS and DSS + l-clodronate treatment on the mouse colon. IF stainings show colon sections of mice euthanized at the 4th day of DSS-treatment, where ECM molecule agrin delineate ganglia with intact myenteric plexus barriers. F4/80+ macrophages are already infiltrated the mucosa, but not the muscularis at this timepoint (A,A′). Arrows indicate scattered MMs in early DSS colon (A′). Cell counting shows that a significantly increased number of mucosal macrophages (MucM) are present in DSS- (8th day) compared to 4th day DSS- (p = 0.037) and control conditions (p < 0.001), likewise between control- and 4th day DSS conditions (p = 0.017) (B,B′). Panels (CC″) show morphology of control (C), DSS-vehicle-treated (C′) and DSS-clodronate-treated (C″) colon stained with IF using antibodies Hu (enteric neurons), agrin and F4/80. Arrowheads indicate MMs, arrows indicate intraganglionic macrophages within the agrin-labeled myenteric plexus barriers. Bar charts show the results of morphometry and cell counting in the same experimental setting (DE′). There was no significant difference in mucosa thickness in any comparison (D). Colon submucosa was significantly thicker in DSS- (p < 0.001) and DSS-clodronate treated mice (p < 0.001) compared to control littermates. For the same parameter, there was a modest, but significant difference between DSS- and DSS-clodronate treated animals (p = 0.026) (D′). The muscularis was significantly thicker in DSS-vehicle-treated animals compared to DSS-clodronate-treated (p < 0.001) and control mice (p = 0.011). There was no significant difference between the control and DSS-clodronate-treated groups. MucM density was significantly increased in DSS-vehicle-treated animals compared to DSS-clodronate-treated (p = 0.026) and control mice (p < 0.001). There was trend towards increased MucM density in the DSS-clodronate group vs the control group, but it did not reach statistical significance (E). MM density of DSS-vehicle-treated animals was significantly increased compared to both control (p < 0.001) and DSS-clodronate-treated animals (p < 0.001), but showed no significant difference between the control and the DSS-clodronate-treated groups (E′). Metric data are shown as mean and corresponding standard deviation (SD). Statistical significance *p < 0.05; **p < 0.01, ***p < 0.001. ggl enteric ganglion, lm longitudinal layer of muscularis externa, cm circular layer of muscularis externa, muc mucosa, sm submucosa.
Figure 4
Figure 4
Results of motility measurements. Bar charts show outcome of motility studies, including the measurement of dry- (A) and wet (B) fecal pellet weight in Control-vehicle-treated, Control-clodronate-treated, DSS-vehicle-treated and DSS-clodronate-treated mice. The weight of dry fecal pellets collected in 3 h was significantly higher in the DSS-vehicle group (n = 11) compared to the Control-clodronate (n = 14, p = 0.016) and DSS-clodronate groups (n = 12, p = 0.032). There was no significant difference between the Control-clodronate and DSS-clodronate groups (p = 0.363) and between the Control-vehicle and the Control-clodronate groups (p = 0.74) (A). Regarding wet fecal pellet weight, the same tendencies occurred, with significant differences between the DSS-vehicle and the Control-clodronate groups (p < 0.001) and the DSS-vehicle and DSS-clodronate groups (p = 0.007). Wet fecal pellet output of DSS-clodronate-treated mice was similar to Control-clodronate mice, with no significant difference (p = 0.114), just like in the case of Control-vehicle and Control-clodronate groups (p = 0.829) (B). When applying Evans blue through oral gavage, DSS-vehicle-treated animals (n = 6) showed significantly decreased transit times compared to both Control-clodronate (n = 8, p = 0.001) and DSS-clodronate-treated littermates (n = 6, p = 0.004). There were no significant differences detected between neither the Control-clodronate and DSS-clodronate groups (p = 0.249), nor the Control-vehicle and Control clodronate groups (p = 0.212). Metric data are shown as mean and corresponding standard deviation (SD). Statistical significance *p < 0.05; **p < 0.01, ***p < 0.001.
Figure 5
Figure 5
Expression of factors implicated in neuronal injury. Volcano plot shows DEGs selected from pathways of the GO biological processes database Response to hypoxia, Response to ROS, Neuron apoptotic process, Neuroinflammatory response and Neuron death (n = 107) after affinity propagation to remove overlapping of genes (A). Each dot represents a gene expressed in whole colon tissues of control (healthy) and DSS-treated experimental animals (n = 8); axis Y displays the log2-transformed adjusted p-values (Bonferroni correction). Axis X shows log2-transformed fold change (FC); positive FC value (red) reflects increased expression in DSS-treated, and negative FC value (blue) reflects increased expression in control mice. Genes with Log2 FC value > [2] are colored light red/blue, with > 5 are colored dark red/blue. Among DEGs annotated, bold displays genes specifically associated with neuroinflammation/degeneration (Atf4, Bax, Egr1, Nqo2, Hdac4, IL-18, Casp8) and Hif1 (A). For the latter genes, qPCR analyses were performed in isolated muscularis specimens of control- DSS-vehicle-treated and DSS-clodronate-treated animals (BI). Expression of Atf4 (p < 0.001), Bax (p < 0.001), Egr1 (p < 0.001), Hdac4 (p < 0.001), IL-18 (p < 0.001), Casp8 (p < 0.001) and Hif1 (p = 0.002), but not of Nqo2 (p = 0.231) were significantly increased in DSS-vehicle-treated mice compared to controls. Concurrent l-clodronate treatment in DSS-treated animals decreased the expression of Bax (p = 0.003), Hdac4 (p = 0.002), IL-18 (p < 0.001), Casp8 (p = 0.014) and of Hif1 (p = 0.024) significantly, but not of Atf4 (p = 0.42), Egr1 (p = 0.208) and of Nqo2 (p = 0.99). Metric data are shown as mean and corresponding standard deviation (SD). Statistical significance *p < 0.05; **p < 0.01, ***p < 0.001.
Figure 6
Figure 6
Tissue expression of Atf4, Bax1, Egr1, IL-18 and Hif1a proteins. Fluorescent immunostainings with Atf4 (AA″), Bax1 (BB″), Egr1 (CC″), IL-18 (DD″) and Hif1a (EE″) antibodies show enteric ganglia indicated with dotted lines embedded between the longitudinal- and circular layer of the colon muscularis externa in different experimental setups. All proteins are present at a baseline level in enteric ganglia of control tissues (AE) and show seemingly more intense staining in DSS-treated mice (AE′). Enteric neural cells can be recognized by their large euchromatic nuclei visualized by 4′,6-diamidino-2-phenylindole (Dapi) staining. Lm longitudinal layer of muscularis externa, cm circular layer of muscularis externa.

References

    1. Nagy N, Goldstein AM. Enteric nervous system development: A crest cell's journey from neural tube to colon. Semin. Cell Dev. Biol. 2017;66:94–106. doi: 10.1016/j.semcdb.2017.01.006. - DOI - PMC - PubMed
    1. Mogor F, Kovács T, Lohinai Z, Dora D. The enteric nervous system and the microenvironment of the gut: The translational aspects of the microbiome-gut-brain axis. Appl. Sci. 2021;11(24):12000. doi: 10.3390/app1124120. - DOI
    1. Muller PA, Koscsó B, Rajani GM, Stevanovic K, Berres ML, Hashimoto D, Mortha A, Leboeuf M, Li XM, Mucida D, Stanley ER, Dahan S, Margolis KG, Gershon MD, Merad M, Bogunovic M. Crosstalk between muscularis macrophages and enteric neurons regulates gastrointestinal motility. Cell. 2014;158(2):300–313. doi: 10.1016/j.cell.2014.04.050. - DOI - PMC - PubMed
    1. Gabanyi I, Muller PA, Feighery L, Oliveira TY, Costa-Pinto FA, Mucida D. Neuro-immune interactions drive tissue programming in intestinal macrophages. Cell. 2016;164(3):378–391. doi: 10.1016/j.cell.2015.12.023. - DOI - PMC - PubMed
    1. De Schepper S, Verheijden S, Aguilera-Lizarraga J, Viola MF, Boesmans W, Stakenborg N, Voytyuk I, Schmidt I, Boeckx B, Dierckx de Casterlé I, Baekelandt V, Gonzalez Dominguez E, Mack M, Depoortere I, De Strooper B, Sprangers B, Himmelreich U, Soenen S, Guilliams M, Vanden Berghe P, Jones E, Lambrechts D, Boeckxstaens G. Self-Maintaining gut macrophages are essential for intestinal homeostasis. Cell. 2018;175(2):400–41513. doi: 10.1016/j.cell.2018.07.048. - DOI - PubMed