

Machine learning models to predict the warfarin discharge dosage using clinical information of inpatients from South Korea
- PMID: 38105280
- PMCID: PMC10725866
- DOI: 10.1038/s41598-023-49831-6
Machine learning models to predict the warfarin discharge dosage using clinical information of inpatients from South Korea
Abstract
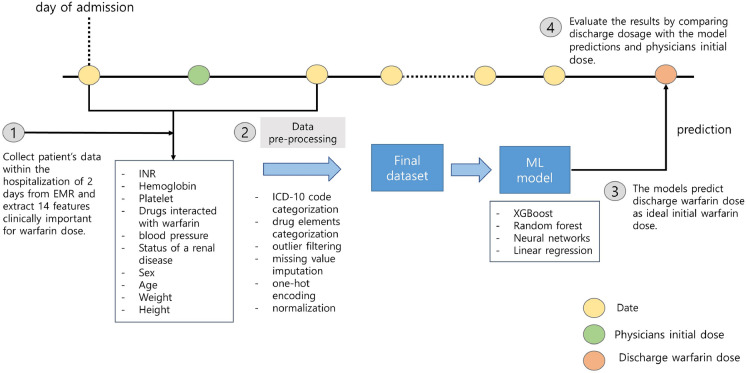
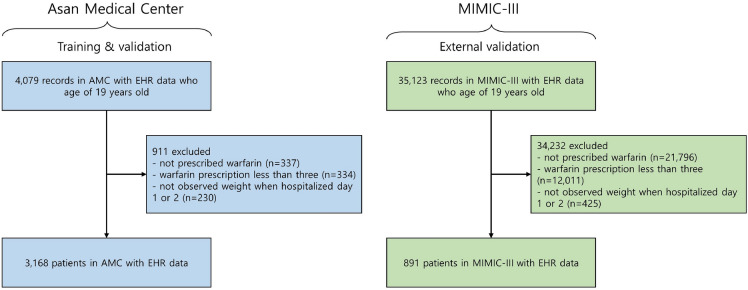
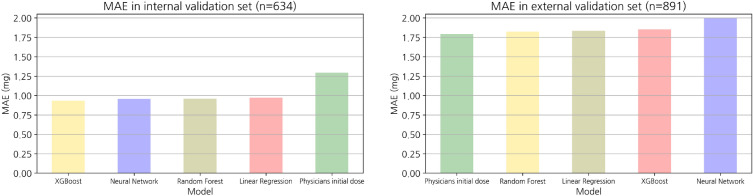
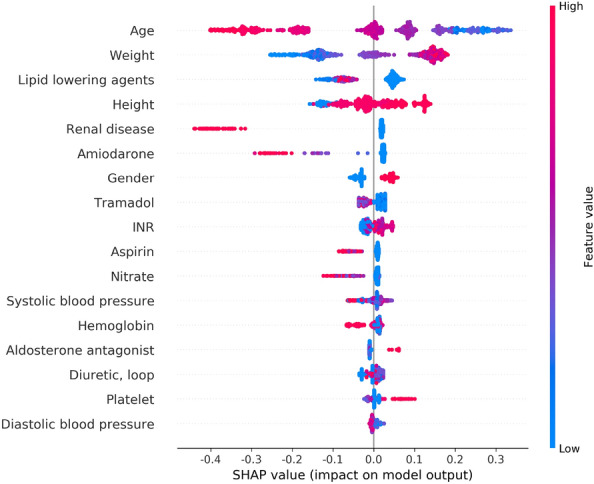
As warfarin has a narrow therapeutic window and obvious response variability among individuals, it is difficult to rapidly determine personalized warfarin dosage. Adverse drug events(ADE) resulting from warfarin overdose can be critical, so that typically physicians adjust the warfarin dosage through the INR monitoring twice a week when starting warfarin. Our study aimed to develop machine learning (ML) models that predicts the discharge dosage of warfarin as the initial warfarin dosage using clinical data derived from electronic medical records within 2 days of hospitalization. During this retrospective study, adult patients who were prescribed warfarin at Asan Medical Center (AMC) between January 1, 2018, and October 31, 2020, were recruited as a model development cohort (n = 3168). Additionally, we created an external validation dataset (n = 891) from a Medical Information Mart for Intensive Care III (MIMIC-III). Variables for a model prediction were selected based on the clinical rationale that turned out to be associated with warfarin dosage, such as bleeding. The discharge dosage of warfarin was used the study outcome, because we assumed that patients achieved target INR at discharge. In this study, four ML models that predicted the warfarin discharge dosage were developed. We evaluated the model performance using the mean absolute error (MAE) and prediction accuracy. Finally, we compared the accuracy of the predictions of our models and the predictions of physicians for 40 data point to verify a clinical relevance of the models. The MAEs obtained using the internal validation set were as follows: XGBoost, 0.9; artificial neural network, 0.9; random forest, 1.0; linear regression, 1.0; and physicians, 1.3. As a result, our models had better prediction accuracy than the physicians, who have difficulty determining the warfarin discharge dosage using clinical information obtained within 2 days of hospitalization. We not only conducted the internal validation but also external validation. In conclusion, our ML model could help physicians predict the warfarin discharge dosage as the initial warfarin dosage from Korean population. However, conducting a successfully external validation in a further work is required for the application of the models.
© 2023. The Author(s).
Conflict of interest statement
The authors declare no competing interests.
Figures
Similar articles
-
Evaluation of Machine Learning Approaches for Predicting Warfarin Discharge Dose in Cardiac Surgery Patients: Retrospective Algorithm Development and Validation Study.JMIR Cardio. 2023 Dec 6;7:e47262. doi: 10.2196/47262. JMIR Cardio. 2023. PMID: 38055310 Free PMC article.
-
An Adapted Neural-Fuzzy Inference System Model Using Preprocessed Balance Data to Improve the Predictive Accuracy of Warfarin Maintenance Dosing in Patients After Heart Valve Replacement.Cardiovasc Drugs Ther. 2022 Oct;36(5):879-889. doi: 10.1007/s10557-021-07191-1. Epub 2021 Apr 20. Cardiovasc Drugs Ther. 2022. PMID: 33877502
-
Stable warfarin dose prediction in sub-Saharan African patients: A machine-learning approach and external validation of a clinical dose-initiation algorithm.CPT Pharmacometrics Syst Pharmacol. 2022 Jan;11(1):20-29. doi: 10.1002/psp4.12740. Epub 2021 Dec 9. CPT Pharmacometrics Syst Pharmacol. 2022. PMID: 34889080 Free PMC article.
-
Warfarin-A natural anticoagulant: A review of research trends for precision medication.Phytomedicine. 2024 Jun;128:155479. doi: 10.1016/j.phymed.2024.155479. Epub 2024 Feb 23. Phytomedicine. 2024. PMID: 38493714 Review.
-
Rifampicin-warfarin interaction leading to macroscopic hematuria: a case report and review of the literature.BMC Pharmacol Toxicol. 2013 May 4;14:27. doi: 10.1186/2050-6511-14-27. BMC Pharmacol Toxicol. 2013. PMID: 23641931 Free PMC article. Review.
Cited by
-
Application of machine learning techniques for warfarin dosage prediction: a case study on the MIMIC-III dataset.PeerJ Comput Sci. 2025 Jan 2;11:e2612. doi: 10.7717/peerj-cs.2612. eCollection 2025. PeerJ Comput Sci. 2025. PMID: 39896040 Free PMC article.
-
A Prediction Model of Stable Warfarin Doses in Patients After Mechanical Heart Valve Replacement Based on a Machine Learning Algorithm.Rev Cardiovasc Med. 2025 Jun 26;26(6):33425. doi: 10.31083/RCM33425. eCollection 2025 Jun. Rev Cardiovasc Med. 2025. PMID: 40630458 Free PMC article.
References
MeSH terms
Substances
LinkOut - more resources
Full Text Sources
Medical
Research Materials
