. 2024 Jan;21(1):33-46.
doi: 10.1038/s41423-023-01108-8. Epub 2023 Dec 18.

Metabolic reprogramming by Syntenin-1 directs RA FLS and endothelial cell-mediated inflammation and angiogenesis

Affiliations

Metabolic reprogramming by Syntenin-1 directs RA FLS and endothelial cell-mediated inflammation and angiogenesis

Anja Meyer et al. Cell Mol Immunol. 2024 Jan.

Abstract

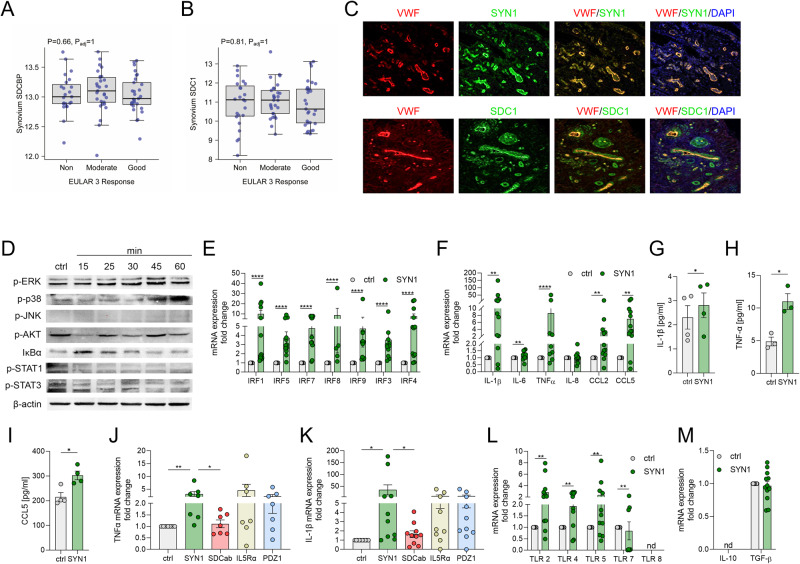
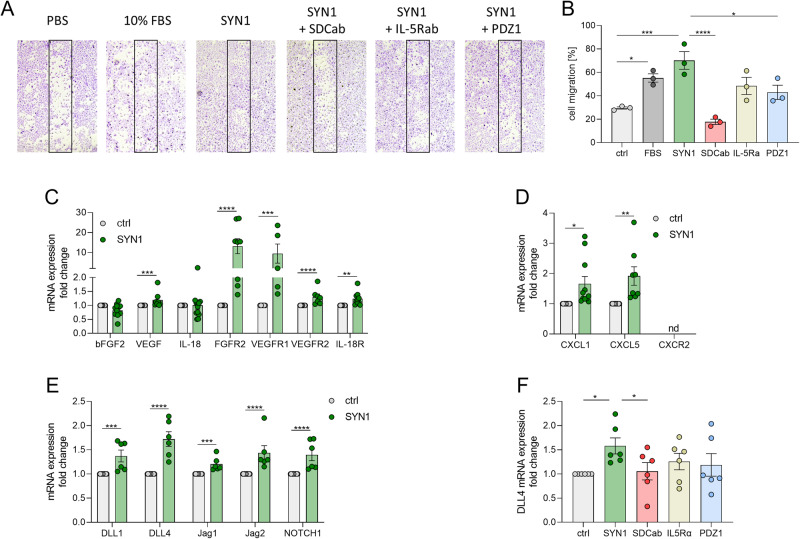
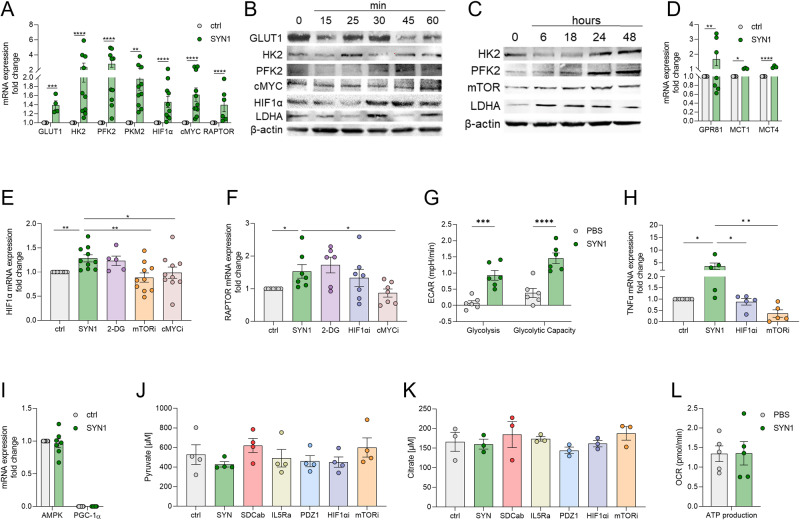
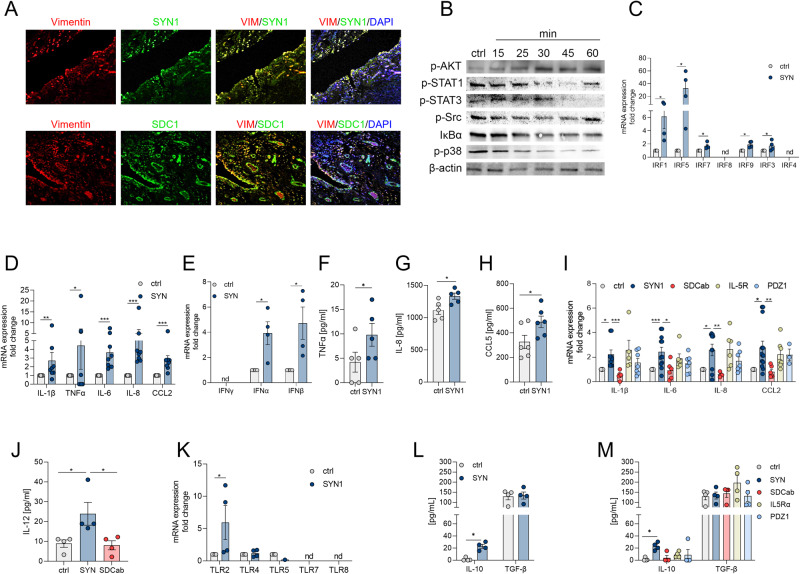
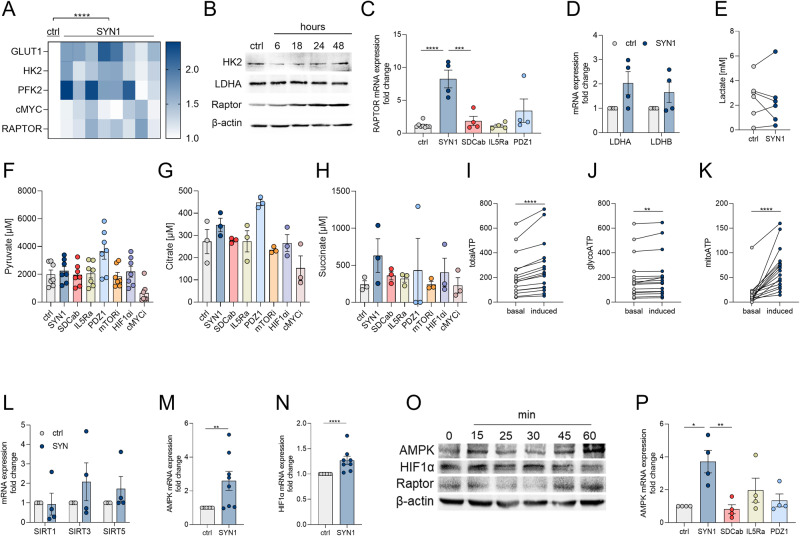
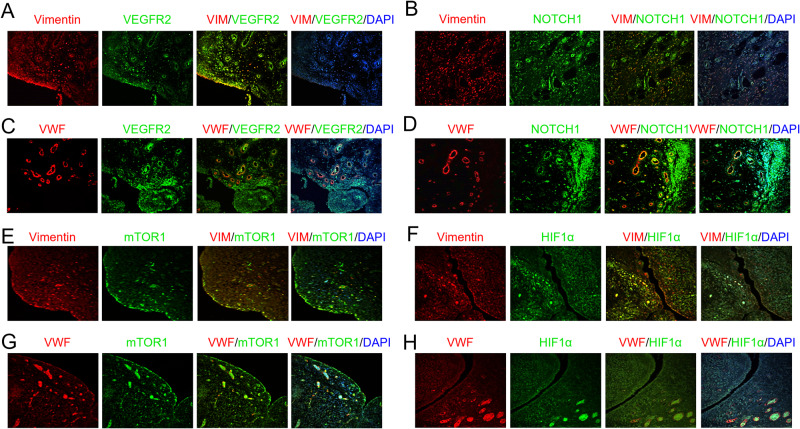
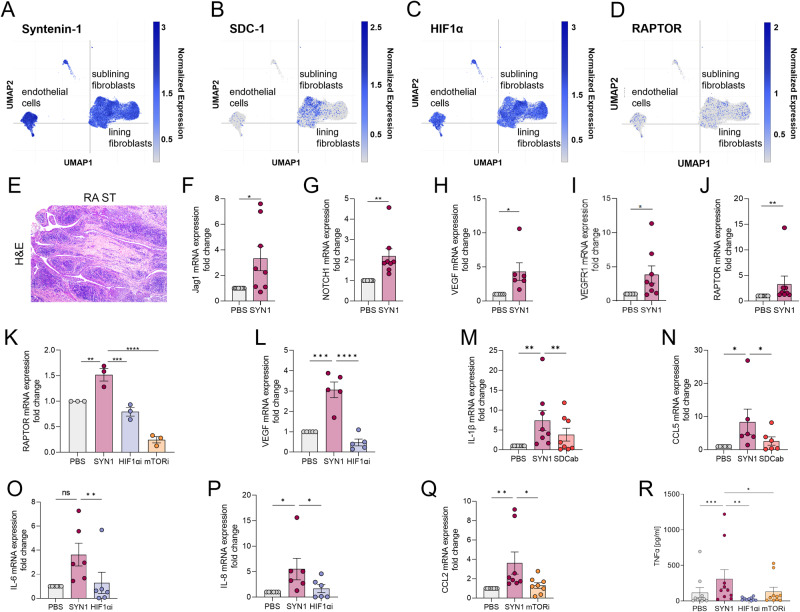
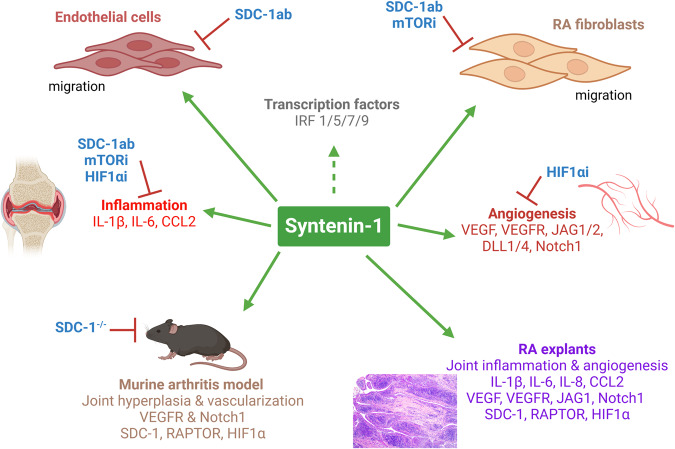
A novel rheumatoid arthritis (RA) synovial fluid protein, Syntenin-1, and its receptor, Syndecan-1 (SDC-1), are colocalized on RA synovial tissue endothelial cells and fibroblast-like synoviocytes (FLS). Syntenin-1 exacerbates the inflammatory landscape of endothelial cells and RA FLS by upregulating transcription of IRF1/5/7/9, IL-1β, IL-6, and CCL2 through SDC-1 ligation and HIF1α, or mTOR activation. Mechanistically, Syntenin-1 orchestrates RA FLS and endothelial cell invasion via SDC-1 and/or mTOR signaling. In Syntenin-1 reprogrammed endothelial cells, the dynamic expression of metabolic intermediates coincides with escalated glycolysis along with unchanged oxidative factors, AMPK, PGC-1α, citrate, and inactive oxidative phosphorylation. Conversely, RA FLS rewired by Syntenin-1 displayed a modest glycolytic-ATP accompanied by a robust mitochondrial-ATP capacity. The enriched mitochondrial-ATP detected in Syntenin-1 reprogrammed RA FLS was coupled with mitochondrial fusion and fission recapitulated by escalated Mitofusin-2 and DRP1 expression. We found that VEGFR1/2 and Notch1 networks are responsible for the crosstalk between Syntenin-1 rewired endothelial cells and RA FLS, which are also represented in RA explants. Similar to RA explants, morphological and transcriptome studies authenticated the importance of VEGFR1/2, Notch1, RAPTOR, and HIF1α pathways in Syntenin-1 arthritic mice and their obstruction in SDC-1 deficient animals. Consistently, dysregulation of SDC-1, mTOR, and HIF1α negated Syntenin-1 inflammatory phenotype in RA explants, while inhibition of HIF1α impaired synovial angiogenic imprint amplified by Syntenin-1. In conclusion, since the current therapies are ineffective on Syntenin-1 and SDC-1 expression in RA synovial tissue and blood, targeting this pathway and its interconnected metabolic intermediates may provide a novel therapeutic strategy.

Keywords: RA FLS; RA explants; Syndecan-1; Syntenin-1; immunometabolism.


Conflict of interest statement

The authors declare no competing interests.

Figures

Fig. 1
Fig. 1
Syntenin-1 reprogrammed endothelial cells display a robust inflammatory phenotype. A, B. Relative expression of Syntenin-1 (A) or SDC-1 (B) was determined by RNAseq [16] in synovial tissue biopsies from RA non-responsive (ΔDAS28 ≤0.6, n = 23), moderate (ΔDAS28 ≤1.2 & >0.6, n = 29), and good responsive (ΔDAS28 >1.2, n = 29) patients. C. RA STs were fluorescently stained to authenticate the colocalization of SDC-1 and Syntenin-1 on VWF+endothelial cells in the presence or absence of DAPI, (n = 3, original magnification x 20). D. HUVECs were treated with Syntenin-1 (1000 ng/ml) for 0-60 mins and phosphorylation of ERK, p38, JNK, AKT, STAT1, STAT3, and degradation of IκBα was determined by western blot analysis and β-actin served as a loading control, n = 3. E–M. HUVECs were treated with PBS (ctrl) or Syntenin-1 (1000 ng/ml) in the presence or absence of SDC-1 Ab (SDCab; 1:100), IL-5R Ab (IL5Ra; 2 µg/ml), or PDZ1i (PDZ1; 10 µM) for 6h or 24h and transcription or translation levels of IRFs (E), inflammatory mediators (F), IL-1β (G, K), TNFα (H, J), CCL5 (I) TLRs (L), and pro-repair factors (M) was assessed by qRT-PCR and/or ELISA (n = 5-12). Data are presented as mean ± SEM; significant differences were determined by the Mann-Whitney test, 2way ANOVA, or one-way ANOVA. *p < 0.05, **p < 0.01, ***p < 0.001, ****p < 0.0001
Fig. 2
Fig. 2
Syntenin-1 ligation to SDC-1 promotes endothelial cell migration and induction of proangiogenic factors from these cells. A. A scratch was created in the middle of the wells that contained confluent HUVECs. Thereafter, cells were either untreated (PBS) or stimulated with Syntenin-1 (1000 ng/ml), or 10% FBS as a positive control for 24h. In parallel, cells were treated with SDC1-Ab (1:100), IL-5R Ab (2 μg/ml), or PDZ1i (10 μM) for 24h, (n = 3). B. The number of cells in the scratch area was counted and compared to the untreated control, (n = 3). CF. HUVECs were treated with PBS (ctrl) or Syntenin-1 (1000 ng/ml) in the presence or absence of SDC-1 Ab (SDCab; 1:100), IL-5R Ab (IL5Ra; 2 µg/ml), or PDZ1i (PDZ1; 10 µM) for 6h before quantifying transcription levels of bFGF, VEGF, IL-18, FGFR2, VEGFR1, VEGFR2, IL-18R (C), CXCL1, CXCL5, CXCR2 (D), DLL1, DLL4, JAG1, JAG2, Notch1 (E), and DLL4 (F) by qRT-PCR, (n = 6-10, nd=not detectable). Data are presented as mean ± SEM; significant differences were determined by the Mann-Whitney test, 2way ANOVA, or one-way ANOVA. *p < 0.05, **p < 0.01, ***p < 0.001, ****p < 0.0001
Fig. 3
Fig. 3
Syntenin-1 reprogrammed endothelial cells display accelerated glycolytic activity with no effect on oxidative phosphorylation. A. HUVECs were treated with PBS (ctrl) or Syntenin-1 (1000 ng/ml) for 6h and transcription of the glycolytic factors GLUT1, HK2, PFK2, PKM2, HIF1α, cMYC, RAPTOR (A) was determined by qRT-PCR. B, C. HUVECs were treated with Syntenin-1 (1000 ng/ml) for 0-60 minutes to detect expression of GLUT1, HK2, PFK2, cMYC, HIF1α, and LDHA (B) or 0-48h to detect HK2, PFK2, mTOR/RAPTOR and LDHA (C), β-actin served as a loading control, (n = 3). D-F HUVECs were treated with PBS or Syntenin-1 (1000 ng/ml) in the presence or absence of 2-DG (5 mM), mTORi (1 µM), HIF1αi (2 μM) or cMYCi (50 μM) to quantify transcription of Lactate receptor (GPR81) and transporters (MCT1/4) (D), HIF1α (E), and RAPTOR (F). G. Using a Seahorse XF Glycolysis Stress Test Kit from Agilent (cat# 103020-100), ECAR was evaluated in HUVECs treated with PBS and Syntenin-1 (1000 ng/ml) for 0-112 min and data are shown as Glycolysis and Glycolytic Capacity, (n = 6). H, I. Transcription of TNFα (H) and AMPK and PGC-1α (I) in HUVECs was established by qRT-PCR after 6h of treatment with Syntenin-1 (1000 ng/ml) in the presence or absence of HIF1αi (2 μM) and mTORi (1 µM) (n = 5-7). J, K. HUVECs were treated with PBS or Syntenin-1 (1000 ng/ml) in the presence or absence of SDC-1 Ab (SDCab; 1:100), IL-5R Ab (IL5Ra; 2 µg/ml), PDZ1i (PDZ1; 10 µM), HIF1αi (2 μM) or mTORi (1 µM) for 24h before measuring Pyruvate (J) or Citrate (K) levels by a colorimetric assay, (n = 3-4). L. Employing a Seahorse XF Glycolysis Stress Test Kit from Agilent (cat# 103020-100), OCR was evaluated in HUVECs treated with PBS and Syntenin-1 (1000 ng/ml) for 0-112 min and data were shown as ATP production, (n = 5). Data are presented as mean ± SEM; significant differences were determined by the Mann-Whitney test, 2way ANOVA, or one-way ANOVA. *p < 0.05, **p < 0.01, ***p < 0.001, ****p < 0.0001
Fig. 4
Fig. 4
The inflammatory profile surpasses the pro-repair phenotype in Syntenin-1 reprogrammed RA FLS. A. RA STs were fluorescently stained to authenticate the colocalization of SDC-1 and Syntenin-1 expression on Vimentin+FLS in the presence or absence of DAPI, (n = 3, original magnification x 20). B. RA FLS were treated with Syntenin-1 (1000 ng/ml) for 0-60 mins and phosphorylation of AKT, STAT1, STAT3, Src, p38, or degradation of IκBα was determined by western blot analysis and β-actin served as a loading control, (n = 3). C–M. RA FLS were treated with PBS (ctrl) or Syntenin-1 (1000 ng/ml) in the presence or absence of SDC-1 Ab (SDCab; 1:100), IL-5R Ab (IL5Ra; 2 µg/ml), or PDZ1i (PDZ1; 10 µM) for 6h or 24h before quantifying transcriptional or translational levels of IRFs (C, n = 4), inflammatory mediators (D–I, n = 4-9), IL-12 (J, n = 4), TLRs (K, n = 4) and pro-repair factors (L, M, n = 4) by qRT-PCR or ELISA. Data are presented as mean ± SEM; significant differences were determined by the Mann-Whitney test, 2way ANOVA, or one-way ANOVA. *p < 0.05, **p < 0.01, ***p < 0.001, ****p < 0.0001
Fig. 5
Fig. 5
RA FLS reprogrammed by Syntenin-1 display dysregulated mitochondrial oxidative stress. RA FLS were treated with PBS (ctrl) or Syntenin-1 (1000 ng/ml) for 6h and transcription of glycolytic mediators GLUT1, HK2, PFK2, cMYC, and RAPTOR was determined by qRT-PCR (A, n = 8). RA FLS were treated with Syntenin-1 (1000 ng/ml) for 0-48h to detect HK2, LDHA, and RAPTOR (B, n = 3). C–H. RA FLS were treated with PBS (ctrl) or Syntenin-1 (1000 ng/ml) in the presence or absence of SDC-1 Ab (SDCab; 1:100), IL-5R Ab (IL5Ra; 2 µg/ml), PDZ1i (PDZ1; 10 µM), mTORi (1 µM), HIF1αi (2 μM) or cMYCi (50 μM) for 6h (mRNA) or 24h (protein) and transcription of glycolytic mediators, RAPTOR (C, n = 4), LDHA, LDHB (D, n = 4) and protein expression of Lactate (E), Pyruvate (F), Citrate (G), and Succinate (H) (n = 3-7) were determined by qRT-PCR, or colorimetric assay. I–K. RA FLS were treated with PBS (basal) or Syntenin-1 (1000 ng/ml, induced), and total ATP (I), glycoATP (J), and mitoATP (K) were determined by Seahorse XF Real-Time ATP Rate Assay Kit (n = 13). L–N. RA FLS were treated with PBS or Syntenin-1 (1000 ng/ml) for 6h before quantifying transcription of metabolic intermediates; SIRT1, SIRT3, SIRT5 (L, n = 4) or AMPK (M, n = 8) and HIF1α (N, n = 8) by qRT-PCR. RA FLS were treated with Syntenin-1 (1000 ng/ml) for 0-60 minutes to detect AMPK, HIF1α, or RAPTOR protein levels (O, n = 3). P. RA FLS were treated with PBS or Syntenin-1 (1000 ng/ml) in the presence or absence of SDC-1 Ab (SDCab; 1:100), IL-5R Ab (IL5Ra; 2 µg/ml), or PDZ1i (PDZ1; 10 µM) for 6h before quantifying transcription levels of AMPK (n = 4). In western blot analysis, β-actin served as a loading control. Data are presented as mean ± SEM; significant differences were determined by the Mann-Whitney test, 2way ANOVA, or one-way ANOVA. *p < 0.05, **p < 0.01, ***p < 0.001, ****p < 0.0001
Fig. 6
Fig. 6
Syntenin-1 rewired RA FLS exhibit mitochondrial fusion and fission, in addition, the inflammatory phenotype was differentially regulated compared to RA FLS migration in response to Syntenin-1. A–D. RA STs were fluorescently stained to authenticate the colocalization of Mitofusin-2 (MFN2) (A, B) and DRP1 (C, D) expression on Vimentin+ FLS in the presence or absence of DAPI, (n = 3, original magnification x 60 or x500). E. RA FLS were treated with Syntenin-1 (1000 ng/ml) for 0-60 min to detect Mitofusin-2 and DRP1 expression by western blot, β-actin served as a loading control, (n = 3). F–I. RA FLS were treated with Syntenin-1 (1000 ng/ml) in the presence or absence of HIF1αi (2 μM) for 6h to determine transcription of IL-1β (F, n = 6), IL-6 (G, n = 5), IL-8 (H, n = 5) and CCL2 (I, n = 6) by qRT-PCR. J, K. A scratch was created in the middle of the wells that contained confluent RA FLS. Thereafter, cells were either untreated (PBS) or stimulated with Syntenin-1 (1000 ng/ml), or bFGF (100 ng/ml) as a positive control for 24h. In parallel, cells were treated with SDC-1 Ab (SDCab, 1:100), IL-5R Ab (IL5Ra, 2 μg/ml), PDZ1i (PDZ1, 10 μM), HIF1αi (2 μM) or mTOR1i (1μM) for 24h, (J, n = 4). The number of cells in the scratch area was counted and compared to the untreated control, (K, n = 4). L, M. RA FLS were treated with PBS or Syntenin-1 (1000 ng/ml) in the presence or absence of SDC-1 Ab (SDCab; 1:100), IL-5R Ab (IL5Ra; 2 µg/ml), or PDZ1i (PDZ1; 10 µM) for 6h before quantifying transcription levels of VEGF (L, n = 5) or Notch1, FGF2, CXCL1, and CXCL5 (M, n = 6-8). Data are presented as mean ± SEM; significant differences were determined by the Mann-Whitney test, 2way ANOVA, or one-way ANOVA. *p < 0.05, **p < 0.01, ***p < 0.001, ****p < 0.0001
Fig. 7
Fig. 7
Syntenin-1 arthritic mice recapitulate RA pathology by exhibiting Vimentin+ fibroblast and VWF+ endothelial cell recruitment in WT mice which was mitigated in SDC-1-/- animals. A. WT and SDC-1-/- mice were injected intra-articularly with ad-ctrl (ctrl) or adSYN1 (3 × 1010 viral particles/ankle) on days 0, 7, and 14 and joint circumference was monitored over 15 days (n = 10 mice/group). Ankles from non-arthritic WT ctrl and WT or SDC-1−/− mice injected with ad-SYN1 were stained for H&E, Vimentin, and VWF (B) or VEGFR2 and Notch1 (F), and their staining was scored on a 0-5 scale (C, D, E, G, H; n = 4-9). The ankles from non-arthritic WT ctrl and WT or SDC-/- mice injected with ad-SYN1 were homogenized and transcriptional regulation of VEGFR1 and Notch1 (I) or RAPTOR, and HIF1α (J) was determined by qRT-PCR (n = 4-6). Data are presented as mean ± SEM; significant differences were determined by the Mann-Whitney test, 2way ANOVA, or one-way ANOVA. *p < 0.05, **p < 0.01, ***p < 0.001, ****p < 0.0001
Fig. 8
Fig. 8
VEGFR2, Notch1, RAPTOR, and HIF1α are represented in RA ST FLS and endothelial cells. RA STs were fluorescently stained to authenticate the colocalization of VEGFR2 (A, C), Notch1 (B, D), mTOR1 (E, G), and HIF1α (F, H) on Vimentin+ FLS and VWF+ endothelial cells in the presence or absence of DAPI, (n = 3, original magnification x 20)
Fig. 9
Fig. 9
Syntenin1-induced metabolic activity fine-tunes transcription of angiogenic and inflammatory factors in RA ST explants. Normalized expression levels of Syntenin-1 (A), SDC-1 (B), HIF1α (C), and RAPTOR (D) are displayed on the lining and sublining RA FLS as well as endothelial cells based on single-cell RNA sequencing data from Wei et al. [26]. E. A representative RA ST utilized in Fig. F-R is shown. F–R. RA STs (30 mg) were cut into small pieces to allow proper access to stimuli and were starved o/n in 0% FBS RPMI with or without SDC-1-Ab (1:100), mTOR1i (1 μM), and HIF1αi (2 μM). RA STs were stimulated with 1000 ng/ml Syntenin-1 for 6-8h. Synovial tissues were harvested for transcriptome analysis by qRT-PCR and supernatants were used for protein quantification by ELISA. The transcription levels of JAG1 (F), Notch1 (G), VEGF (H, L), VEGFR1 (I), and RAPTOR (J, K) as well as IL-1β (M), CCL5 (N), IL-6 (O), IL-8 (P), and CCL2 (Q) were quantified by qRT-PCR, n = 3-8. R. Production of TNFα was evaluated by ELISA, (n = 10). Data are presented as mean ± SEM; significant differences were determined by the Mann-Whitney test, 2way ANOVA, or one-way ANOVA. *p < 0.05, **p < 0.01, ***p < 0.001, ****p < 0.0001
Fig. 10
Fig. 10
The Syntenin-1/SDC-1 pathway influences RA FLS and endothelial cell pathology in RA explants and experimental models. The schematic figure demonstrates the mechanism by which Syntenin-1 reprograms endothelial cells and RA FLS and how inflammatory and angiogenic markers are impacted by SDC-1 and metabolic intermediates

References

    1. Boukerche H, Su ZZ, Prevot C, Sarkar D, Fisher PB. mda-9/Syntenin promotes metastasis in human melanoma cells by activating c-Src. Proc Natl Acad Sci USA. 2008;105:15914–9. doi: 10.1073/pnas.0808171105. - DOI - PMC - PubMed
    1. Boukerche H, Aissaoui H, Prevost C, Hirbec H, Das SK, Su ZZ, et al. Src kinase activation is mandatory for MDA-9/syntenin-mediated activation of nuclear factor-kappaB. Oncogene. 2010;29:3054–66. doi: 10.1038/onc.2010.65. - DOI - PMC - PubMed
    1. Kang BS, Cooper DR, Jelen F, Devedjiev Y, Derewenda U, Dauter Z, et al. PDZ tandem of human syntenin: crystal structure and functional properties. Structure. 2003;11:459–68. doi: 10.1016/S0969-2126(03)00052-2. - DOI - PubMed
    1. Latysheva N, Muratov G, Rajesh S, Padgett M, Hotchin NA, Overduin M, et al. Syntenin-1 is a new component of tetraspanin-enriched microdomains: mechanisms and consequences of the interaction of syntenin-1 with CD63. Mol Cell Biol. 2006;26:7707–18. doi: 10.1128/MCB.00849-06. - DOI - PMC - PubMed
    1. Grembecka J, Cierpicki T, Devedjiev Y, Derewenda U, Kang BS, Bushweller JH, et al. The binding of the PDZ tandem of syntenin to target proteins. Biochemistry. 2006;45:3674–83. doi: 10.1021/bi052225y. - DOI - PubMed

Publication types

LinkOut - more resources