. 2024 Jun;30(6):e14555.
doi: 10.1111/cns.14555. Epub 2023 Dec 17.

Conditional knockout of AIM2 in microglia ameliorates synaptic plasticity and spatial memory deficits in a mouse model of Alzheimer's disease

Affiliations

Conditional knockout of AIM2 in microglia ameliorates synaptic plasticity and spatial memory deficits in a mouse model of Alzheimer's disease

Lei Ye et al. CNS Neurosci Ther. 2024 Jun.

Abstract

Aims: Synaptic dysfunction is a hallmark pathology of Alzheimer's disease (AD) and is strongly associated with cognitive impairment. Abnormal phagocytosis by the microglia is one of the main causes of synapse loss in AD. Previous studies have shown that the absence of melanoma 2 (AIM2) inflammasome activity is increased in the hippocampus of APP/PS1 mice, but the role of AIM2 in AD remains unclear.

Methods: Injection of Aβ1-42 into the bilateral hippocampal CA1 was used to mimic an AD mouse model (AD mice). C57BL/6 mice injected with AIM2 overexpression lentivirus and conditional knockout of microglial AIM2 mice were used to confirm the function of AIM2 in AD. Cognitive functions were assessed with novel object recognition and Morris water maze tests. The protein and mRNA expression levels were evaluated by western blotting, immunofluorescence staining, and qRT-PCR. Synaptic structure and function were detected by Golgi staining and electrophysiology.

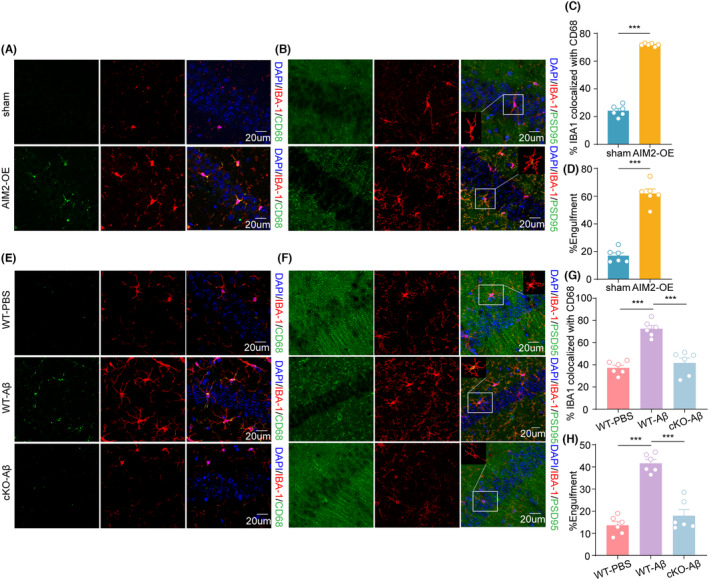
Results: The expression level of AIM2 was increased in AD mice, and overexpression of AIM2 induced synaptic and cognitive impairments in C57BL/6 mice, similar to AD mice. Elevated expression levels of AIM2 occurred in microglia in AD mice. Conditional knockout of microglial AIM2 rescued cognitive and synaptic dysfunction in AD mice. Excessive microglial phagocytosis activity of synapses was decreased after knockout of microglial AIM2, which was associated with inhibiting complement activation.

Conclusion: Our results demonstrated that microglial AIM2 plays a critical role in regulating synaptic plasticity and memory deficits associated with AD, providing a new direction for developing novel preventative and therapeutic interventions for this disease.

Keywords: AIM2; Alzheimer's disease; complement; microglia; synaptic loss.


Conflict of interest statement

Xu, Yun is an Editorial Board member of CNS Neuroscience and Therapeutics and a coauthor of this article. To minimize bias, they were excluded from all editorial decision‐making related to the acceptance of this article for publication.

Figures

FIGURE 1
FIGURE 1
Synaptic damage and increased AIM2 expression in the microglia of Aβ1‐42‐induced AD mice. (A–C) The protein levels of PSD95 and MAP2 were assessed by western blotting and normalized to β‐actin as a loading control. n = 4 for each group. t (6) = 4.006, p = 0.0071 for PSD‐95; p = 0.0286 for MAP‐2. (D) Immunostaining for PSD‐95 and MAP‐2 in the hippocampal region of sham and AD mice. (E) Overview of hippocampal CA1 neurons at low magnification. (F) Representative reconstructions of the morphology of hippocampal CA1 neurons. (G) The number of intersections quantified by Sholl analysis of neurons in sham (n = 9 neurons, 3 mice) and AD mice (n = 9 neurons, 3 mice). F(1, 16) = 19.02, p = 0.0005. (H) Typical Golgi‐stained apical and basal dendrites from hippocampal CA1 neurons. Bar = 10 μm. (I) Quantitative analysis of dendritic spine density in sham (n = 8–9 spines, 3 mice) and AD mice (n = 8–9 spines, 3 mice). t(15) = 13.44, p < 0.0001 for apical spines; t(15) = 11.03, p < 0.0001 for basal spines. (J) The level of AIM2 was measured by qPCR and normalized to GAPDH mRNA. n = 6–7 for each group. t (11) = 3.507, p = 0.0049. (K,L) The expression level of AIM2 was verified by western blotting, and the corresponding quantified results were obtained with β‐actin as a loading control. n = 4 for each group. t (6) = 2.692, p = 0.0359. (M) Representative confocal images showing the colocalization of IBA1 (red) and AIM2 (green) immunofluorescence in the hippocampus of Aβ1‐42‐induced AD mice and sham mice. The data are shown as the mean ± SEM. Shapiro–Wilk test for (B), (C), (G), (I), (J) and (L), w = 0.9504, p = 0.7188 for sham in (B); w = 0.9799, p = 0.9015 for Aβ in (B); w = 0.7062, p = 0.0137 for sham in (C); w = 0.8752, p = 0.3185 for Aβ in (C); w = 0.8439, p = 0.0825 for apical spines of sham group in (I); w = 0.9222, p = 0.4109 for apical spines of Aβ group in (I); w = 0.9466, p = 0.6526 for basal spines of sham group in (I); w = 0.8854, p = 0.2121 for basal spines of Aβ group in (I); w = 0.8644, p = 0.2048 for sham in (J); w = 0.8684, p = 0.1797 for Aβ in (J); w = 0.8723, p = 0.3067 for sham in (L); w = 0.9762, p = 0.8795 for Aβ in (L). Unpaired two‐tailed t test for (B), (I), (J) and (L). Mann–Whitney test for (C). Two‐way ANOVA followed by Bonferroni post hoc correction for G. *p < 0.05, **p < 0.01, ***p < 0.001.
FIGURE 2
FIGURE 2
Overexpression of AIM2 contributed to disrupted synaptic structure and function. (A, B) The ratio of time spent exploring the same object (A) and the novel object (B) was measured in NOR tests. n = 10–12 for each group. t(20) = 2.366, p = 0.0282. (C) The escape latency in the training session of the MWM test was analyzed. n = 10–12 for each group. F(1, 20) = 4.483, p = 0.0470. (D–H) In the probe session, the swimming speed (D), the escape latency to reach the platform (E), the number of platform crossings (F), time in the target quadrant (G), and the latency to find the target quadrant (H) were recorded. n = 10–12 for each group. t(20) = 0.4869, p = 0.6316 for swimming speed; t(20) = 3.515, p = 0.0022 for latency to platform; t(20) = 4.315, p = 0.0003 for the number of platform crossings; t(20) = 2.758, p = 0.0121 for time in target quadrant; p = 0.0286 for latency to target quadrant. (I) Representative movement tracks of each group during the probe phase. (J–L) The protein levels of PSD95 and MAP2 were assessed by western blotting and normalized to β‐actin as a loading control. n = 4 for each group. t (6) = 3.389, p = 0.0147 for PSD‐95; t(6) = 4.516, p = 0.0040 for MAP‐2. (M) Overview of hippocampal CA1 neurons at low magnification. (N) Representative reconstructions of the morphology of hippocampal CA1 neurons. (O) The number of intersections quantified by Sholl analysis of neurons in sham (n = 12 neurons, 4 mice) and AIM2‐OE mice (n = 8 neurons, 3 mice). F(1, 18) = 21.51, p = 0.0002. (P) Typical Golgi‐stained apical and basal dendrites from hippocampal CA1 neurons. Bar = 10 μm. (Q) Quantitative analysis of dendritic spine density in sham (n = 8–9 spines, 4 mice) and AIM2‐OE mice (n = 9 spines, 3 mice). t(15) = 13.36, p < 0.0001 for apical spines; t(16) = 12.65, p < 0.0001 for basal spines. (R) The input–output relationship (I‐O curve) in the hippocampal CA1 region of sham (n = 7 slices, 4 mice) and AIM2‐OE (n = 7 slices, 4 mice) mice. F(1, 12) = 33.62, p < 0.0001. (S) Representative traces of fEPSCs recorded during baseline and 60 min post‐HFS in the hippocampal CA1 of sham and AIM2‐OE mice. (T) The average normalized fEPSP slope in the last 5 min of LTP recordings in sham (n = 10 slices, 4 mice) and AIM2‐OE mice (n = 10 slices, 4 mice). p < 0.0001. Data are shown as the mean ± SEM. Shapiro–Wilk test for (B), (D–H), (K), (L), (Q) and (T), w = 0.8670, p = 0.0598 for sham in B; w = 0.9003, p = 0.2207 for AIM2‐OE in (B); w = 0.9327, p = 0.4095 for sham in (D); w = 0.8685, p = 0.0960 for AIM2‐OE in (D); w = 0.9519, p = 0.6652 for sham in (E); w = 0.8950, p = 0.1931 for AIM2‐OE in (E); w = 0.9614, p = 0.8038 for sham in (F); w = 0.9639, p = 0.8298 for AIM2‐OE in (F); w = 0.9057, p = 0.1880 for sham in (G); w = 0.9209, p = 0.3646 for AIM2‐OE in G; w = 0.9224, p = 0.3064 for sham in (H); w = 0.8274, p = 0.0311 for AIM2‐OE in (H); w = 0.8257, p = 0.1569 for sham in (K); w = 0.9357, p = 0.6282 for AIM2‐OE in (K); w = 0.9695, p = 0.8382 for sham in (L); w = 0.8713, p = 0.3027 for AIM2‐OE in (L); w = 0.8814, p = 0.1940 for apical spines of sham group in (Q); w = 0.9086, p = 0.3064 for apical spines of AIM2‐OE group in (Q); w = 0.9251, p = 0.4364 for basal spines of sham group in (Q); w = 0.9658, p = 0.8566 for basal spines of AIM2‐OE group in (Q); w = 0.7259, p = 0.0018 for sham in (T); w = 0.9135, p = 0.3057 for AIM2‐OE in (T). Unpaired two‐tailed t test for (B), (D–G), (K), (L) and (Q). Mann–Whitney test for (H) and (T). Two‐way ANOVA followed by Bonferroni post hoc correction for N and R. *p < 0.05, **p < 0.01, ***p < 0.001; ns, no significance.
FIGURE 3
FIGURE 3
AIM2 deficiency in microglia rescued cognitive impairment in the Aβ1‐42‐induced AD model. (A) Immunostaining for IBA‐1 (red) and AIM2 (green) in the hippocampal region in Aβ1‐42‐induced AD mice and sham mice. (B) Schematic diagram for generating the microglial AIM2 conditional knockout mice. (C, D) The percentage of time spent exploring the same object (C) and a novel object (D) was measured in the NOR tests. n = 10–15 for each group. F(2,33) = 0.1612, AD versus sham group: p = 0.0022, AIM2‐cKO‐AD versus AD group: p = 0.0053. (E) The escape latency during the training period in MWM tests was detected. n = 10–15 for each group. F(2, 33) = 4.032, AD versus sham group: p = 0.0268, AIM2‐cKO‐AD versus AD group: p = 0.0459. (F–J) The swimming speed (F), latency to reach the platform (G), number of platform crossings (H), time spent in the target quadrant (I), and latency to reach the target quadrant (J) were evaluated during the probe trial in MWM tests. n = 10–15 for each group. AD versus Sham group: p > 0.9999, AIM2‐cKO‐AD versus AD group: p = 0.1257 for swimming speed; F(2,33) = 2.329, AD versus Sham group: p = 0.0004, AIM2‐cKO‐AD versus AD group: p = 0.0040 for latency to platform; F(2,33) = 2.172, AD versus Sham group: p = 0.0023, AIM2‐cKO‐AD versus AD group: p = 0.0142 for the number of platform crossings; F(2,33) = 0.2824, AD versus Sham group: p = 0.1053, AIM2‐cKO‐AD versus AD group: p = 0.3232 for time in target quadrant; AD versus Sham group: p = 0.0011, AIM2‐cKO‐AD versus AD group: p = 0.0100 for latency to target quadrant. (K) Representative locomotor traces in the MWM tests. The data are shown as the mean ± SEM. Shapiro–Wilk test for (D) and (F–J). w = 0.9858, p = 0.9887 for sham in (D), w = 0.8957, p = 0.1636 for AD in (D), w = 0.9536, p = 0.5821 for AIM2‐cKO‐AD in (D); w = 0.8568, p = 0.0524 for sham in (F), w = 0.7361, p = 0.0024 for AD in (F), w = 0.9383, p = 0.3612 for AIM2‐cKO‐AD in (F); w = 0.9102, p = 0.2449 for sham in (G), w = 0.7866, p = 0.0100 for AD in (G), w = 0.7901, p = 0.0028 for AIM2‐cKO‐AD in (G); w = 0.8828, p = 0.1129 for sham in (H), w = 0.9310, p = 0.4578 for AD in (H), w = 0.9649, p = 0.7769 for AIM2‐cKO‐AD in (H); w = 0.9638, p = 0.8178 for sham in (I), w = 0.9292, p = 0.4405 for AD in (I), w = 0.9680, p = 0.8276 for AIM2‐cKO‐AD in (I); w = 0.9197, p = 0.3165 for sham in (J), w = 0.9678, p = 0.8697 for AD in (J), w = 0.8441, p = 0.0144 for AIM2‐cKO‐AD in (J); One‐way ANOVA followed by Dunnett's post hoc test for (C), (E), (G), (H), and (I). One‐way ANOVA followed by Dunn's Test for (F), (G) and (J). Two‐way ANOVA followed by Bonferroni post hoc correction for D. *p < 0.05, **p < 0.01, ***p < 0.001; ns no significance.
FIGURE 4
FIGURE 4
Knockout of microglial AIM2 ameliorated synaptic dysfunction. (A) The protein expression of PSD95 and MAP2 was determined by western blotting. (B, C) Quantitative analysis of PSD95 (B) and MAP2 (C) protein levels normalized to β‐actin. n = 6 for each group. F(2, 6) = 0.6151, AD versus sham group: p = 0.0169, AIM2‐cKO‐AD versus AD group: p = 0.0374 for PSD95; F(2, 6) = 0.9634, AD versus sham group: p = 0.0380, AIM2‐cKO‐AD versus AD group: p = 0.0313 for MAP2. (D) Representative Golgi staining showing an overview of hippocampal CA1 neurons. (E) Representative traces of CA1 pyramidal neurons in sham, AD and AIM2‐cKO‐AD mice. (F) The number of Golgi‐stained dendritic intersections was counted in sham (n = 8 neurons, 3 mice), AD (n = 6 neurons, 3 mice), and AIM2‐cKO‐AD (n = 8 neurons, 3 mice) mice. F(2, 19) = 10.04, AD versus sham group: p < 0.0001, AIM2‐cKO‐AD versus AD group: p < 0.0001. (G) Representative images of Golgi‐stained apical and basal dendritic spines of CA1 pyramidal neurons in sham, AD, and AIM2‐cKO‐AD mice. Bar = 10 μm. (H) Quantification of dendritic spine density in CA1 pyramidal neurons from sham (n = 8 spines, 3 mice), AD (n = 9 spines, 3 mice), and AIM2‐cKO‐AD mice (n = 9 spines, 3 mice). F(2, 23) = 8.590, AD versus sham group: p < 0.0001, AIM2‐cKO‐AD versus AD group: p < 0.0001 for apical spines; F(2, 23) = 7.726, AD versus sham group: p < 0.0001, AIM2‐cKO‐AD versus AD group: p < 0.0001 for basal spines. (I) The fEPSP amplitude of hippocampal slices in sham (n = 9 slices, 4 mice), AD (n = 9 slices, 3 mice), and AIM2‐cKO‐AD mice (n = 9 slices, 4 mice). F(2, 24) = 10.30, AD versus sham group: p < 0.0001, AIM2‐cKO‐AD versus AD group: p < 0.0001. (J, K) LTP induced by high‐frequency stimulation in sham (n = 10 slices, 4 mice), AD (n = 8 slices, 3 mice), and AIM2‐cKO‐AD mice (n = 11 slices, 4 mice) was evaluated in hippocampal CA1. F(2, 26) = 1.427, AD versus sham group: p = 0.0010, AIM2‐cKO‐AD versus AD group: p = 0.0095. Data are shown as the mean ± SEM. Shapiro–Wilk test for (B), (C), (H) and (K). w = 0.9282, p = 0.4819 for sham in (B), w = 0.9976, p = 0.9056 for AD in (B), w = 0.9690, p = 0.6619 for AIM2‐cKO‐AD in (B); w = 0.8776, p = 0.3173 for sham in (C), w = 0.9986, p = 0.9277 for AD in (C), w = 0.9299, p = 0.4883 for AIM2‐cKO‐AD in (C); w = 0.8566, p = 0.1111 for apical spines of sham group in (H), w = 0.9626, p = 0.8250 for apical spines of AD group in H, w = 0.9299, p = 0.4883 for apical spines of AIM2‐cKO‐AD group in (H);w = 0.9163, p = 0.4006 for basal spines of sham group in H, w = 0.9721, p = 0.9118 for basal spines of AD group in (H), w = 0.8936, p = 0.2172 for basal spines of AIM2‐cKO‐AD group in (H); w = 0.7692, p = 0.0061 for sham in (K), w = 0.9348, p = 0.5607 for AD in (K), w = 0.8364, p = 0.0283 for AIM2‐cKO‐AD in (K). One‐way ANOVA followed by Dunnett's post hoc test for (B), (C), and (H). One‐way ANOVA followed by Dunn's Test for (K). Two‐way ANOVA followed by Bonferroni post hoc correction for (F) and (I). *p < 0.05, **p < 0.01, ***p < 0.001; #p < 0.05, ##p < 0.01, ns no significance.
FIGURE 5
FIGURE 5
Microglia‐specific AIM2 deletion modulated microglial phagocytosis and synaptic elimination by microglia. (A) Immunostaining for IBA‐1 (red) and CD68 (green) in the hippocampal region in sham and AIM2‐OE mice. (B) Confocal images showing the presence of PSD‐95+ (green) puncta around IBA‐1+ (red) microglia and the corresponding 3D reconstructions. (C) Quantitative analysis of colocalization of IBA‐1 and CD68 in sham and AIM2‐OE mice. n = 6 for each group. t (10) = 28.45, p < 0.0001. (D) Quantitative analysis of phagocytic synapse in sham and AIM2‐OE mice. n = 6 for each group. t (10) = 11.52, p < 0.0001. (E) Immunostaining for IBA‐1 (red) and CD68 (green) in the hippocampal region in sham, AD, and AIM2‐cKO‐AD mice. (F) Confocal images showing the presence of PSD‐95+ (green) puncta around IBA‐1+ (red) microglia and the corresponding 3D reconstructions. (G) Quantitative analysis of the colocalization of IBA‐1 and CD68 in sham, AD and AIM2‐cKO‐AD mice. n = 6 for each group. F(2, 15) = 0.4746, AD versus sham group: p < 0.0001, AIM2‐cKO‐AD versus AD group: p < 0.0001. (H) Quantitative analysis of phagocytic synapses in sham, AD and AIM2‐cKO‐AD mice. n = 6 for each group. F(2, 15) = 0.2278, AD versus sham group: p < 0.0001, AIM2‐cKO‐AD versus AD group: p < 0.0001. Data are shown as the mean ± SEM. Shapiro–Wilk test for (C), (D), (G) and (H). w = 0.9882, p = 0.9844 for sham in (C), w = 0.9261, p = 0.5505 for AIM2‐OE in (C); w = 0.8664, p = 0.2123 for sham in D, w = 0.9246, p = 0.5390 for AIM2‐OE in D; w = 0.9395, p = 0.6549 for sham in (G), w = 0.9934, p = 0.9958 for AD in (G), w = 0.8092, p = 0.0710 for AIM2‐cKO‐AD in (G); w = 0.9763, p = 0.9319 for sham in (H), w = 0.9139, p = 0.4626 for AD in (H), w = 0.7945, p = 0.0524 for AIM2‐cKO‐AD in (H). Unpaired two‐tailed t test for C and (D). One‐way ANOVA followed by Dunnett's post hoc test for (G) and (H). ***p < 0.001.
FIGURE 6
FIGURE 6
AIM2 modulated microglial phagocytosis of synapse elimination via complement activation. (A) The mRNA level of C1q in the hippocampal region in sham and AIM2‐OE mice was determined by quantitative RT–PCR. n = 5 for each group. t(8) = 3.499, p = 0.0081. (B) The mRNA level of C3 in the hippocampal region in sham and AIM2‐OE mice was determined by quantitative RT–PCR. n = 5 for each group. t(8) = 3.771, p = 0.0055. (C) The colocalization of C1q (green) with IBA‐1 (red) in the hippocampal CA1 region in sham and AIM2‐OE mice. (D) The colocalization of C3 (green) with PSD‐95 (red) in the hippocampal CA1 region in sham and AIM2‐OE mice. (E) Quantitative analysis of the colocalization of IBA‐1 and C1q in sham and AIM2‐OE mice. n = 6 for each group. t (10) = t = 7.575, p < 0.0001. (F) Quantitative analysis of the colocalization of PSD‐95 and C3 in sham and AIM2‐OE mice. n = 6 for each group. t(10) = t = 12.84, p < 0.0001. (G) The mRNA level of C1q in the hippocampal region in sham, AD and AIM2‐cKO‐AD mice was determined by quantitative RT–PCR. n = 8–9 for each group. F(2, 22) = 2.134, AD versus sham group: p < 0.0001, AIM2‐cKO‐AD versus AD group: p = 0.0004. (H) The mRNA level of C3 in the hippocampal region in sham, AD and AIM2‐cKO‐AD mice was determined by quantitative RT–PCR. n = 8–9 for each group. F(2, 22) = 30.36, AD versus sham group: p < 0.0001, AIM2‐cKO‐AD versus AD group: p = 0.0003. (I) The colocalization of C1q (green) with IBA‐1 (red) in the hippocampal CA1 region in sham, AD, and AIM2‐cKO‐AD mice. (J) The colocalization of C3 (green) with PSD‐95 (red) in the hippocampal CA1 region in sham, AD, and AIM2‐cKO‐AD mice. (K) Quantitative analysis of the colocalization of IBA‐1 and C1q in sham, AD and AIM2‐cKO‐AD mice. n = 6 for each group. F(2, 15) = 6.837, AD versus sham group: p < 0.0001, AIM2‐cKO‐AD versus AD group: p < 0.0001. (L) Quantitative analysis of the colocalization of PSD‐95 and C3 in sham, AD , and AIM2‐cKO‐AD mice. n = 6 for each group. F(2, 15) = 8.637, AD versus sham group: p < 0.0001, AIM2‐cKO‐AD versus AD group: p < 0.0001. (M–O) The protein levels of PSD95 and MAP2 were assessed by western blotting and normalized to β‐actin as a loading control. n = 5 for each group. t(8) = 3.382, p = 0.0096 for MAP‐2; t(8) = 2.901, p = 0.0199 for PSD‐95. (P) Confocal images showing the presence of PSD‐95+ (green) puncta around IBA‐1+ (red) microglia and the corresponding 3D reconstructions. (Q) Quantitative analysis of phagocytic synapses in DMSO and C3aR‐A mice. n = 5 for each group. t(8) = 12.25, p < 0.0001. The data are shown as the mean ± SEM. Shapiro‐Wilk test for A, B, E–H, K, L, N, O, and Q. w = 0.9680, p = 0.8625 for sham in A, w = 0.9221, p = 0.5436 for AIM2‐OE in A; w = 0.9378, p = 0.6503 for sham in B, w = 0.9749, p = 0.9059 for AIM2‐OE in B; w = 0.9490, p = 0.7321 for sham in E, w = 0.9760, p = 0.9302 for AIM2‐OE in E; w = 0.9629, p = 0.8421 for sham in F, w = 0.8610, p = 0.2702 for AIM2‐OE in F; w = 0.9437, p = 0.6217 for sham in G, w = 0.9583, p = 0.7937 for AD in G, w = 0.8702, p = 0.1514 for AIM2‐cKO‐AD in G; w = 0.9234, p = 0.4210 for sham in H, w = 0.8778, p = 0.1796 for AD in H, w = 0.8895, p = 0.2317 for AIM2‐cKO‐AD in H; w = 0.9832, p = 0.9661 for sham in K, w = 0.9675, p = 0.8749 for AD in K, w = 0.9714, p = 0.9016 for AIM2‐cKO‐AD in K; w = 0.8561, p = 0.1763 for sham in L, w = 0.9188, p = 0.4967 for AD in L, w = 0.9432, p = 0.6849 for AIM2‐cKO‐AD in L; w = 0.9466, p = 0.7132 for DMSO in N, w = 0.9210, p = 0.5363 for C3aR‐A in N; w = 0.9010, p = 0.4155 for DMSO in O, w = 0.9291, p = 0.5902 for C3aR‐A in O; w = 0.8943, p = 0.3675 for DMSO in Q, w = 0.8439, p = 0.2242 for C3aR‐A in Q; Unpaired two‐tailed t test for A, B, E, F, N, O, and Q. One‐way ANOVA followed by Dunnett's post hoc test for G, H, K, and L. **p < 0.01, ***p < 0.001.

Similar articles

Cited by

References

    1. Scheltens P, de Strooper B, Kivipelto M, et al. Alzheimer's disease. Lancet. 2021;397(10284):1577‐1590. - PMC - PubMed
    1. Peng L, Bestard‐Lorigados I, Song W. The synapse as a treatment avenue for Alzheimer's disease. Mol Psychiatry. 2022;27(7):2940‐2949. - PubMed
    1. Toyonaga T, Smith LM, Finnema SJ, et al. In vivo synaptic density imaging with (11)C‐UCB‐J detects treatment effects of Saracatinib in a mouse model of Alzheimer disease. J Nucl Med. 2019;60(12):1780‐1786. - PMC - PubMed
    1. Chen MK, Mecca AP, Naganawa M, et al. Assessing synaptic density in Alzheimer disease with synaptic vesicle glycoprotein 2A positron emission tomographic imaging. JAMA Neurol. 2018;75(10):1215‐1224. - PMC - PubMed
    1. Mecca AP, Chen MK, O'Dell RS, et al. In vivo measurement of widespread synaptic loss in Alzheimer's disease with SV2A PET. Alzheimers Dement. 2020;16(7):974‐982. - PMC - PubMed

Publication types

MeSH terms