. 2024 Jun 1;109(6):1918-1932.
doi: 10.3324/haematol.2023.284028.

Epeleuton, a novel synthetic ω-3 fatty acid, reduces hypoxia/ reperfusion stress in a mouse model of sickle cell disease

Affiliations

Epeleuton, a novel synthetic ω-3 fatty acid, reduces hypoxia/ reperfusion stress in a mouse model of sickle cell disease

Alessandro Mattè et al. Haematologica. .

Abstract

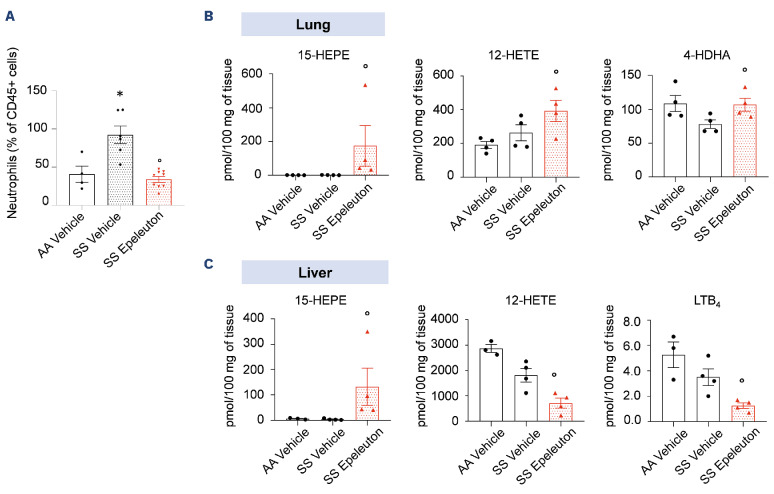
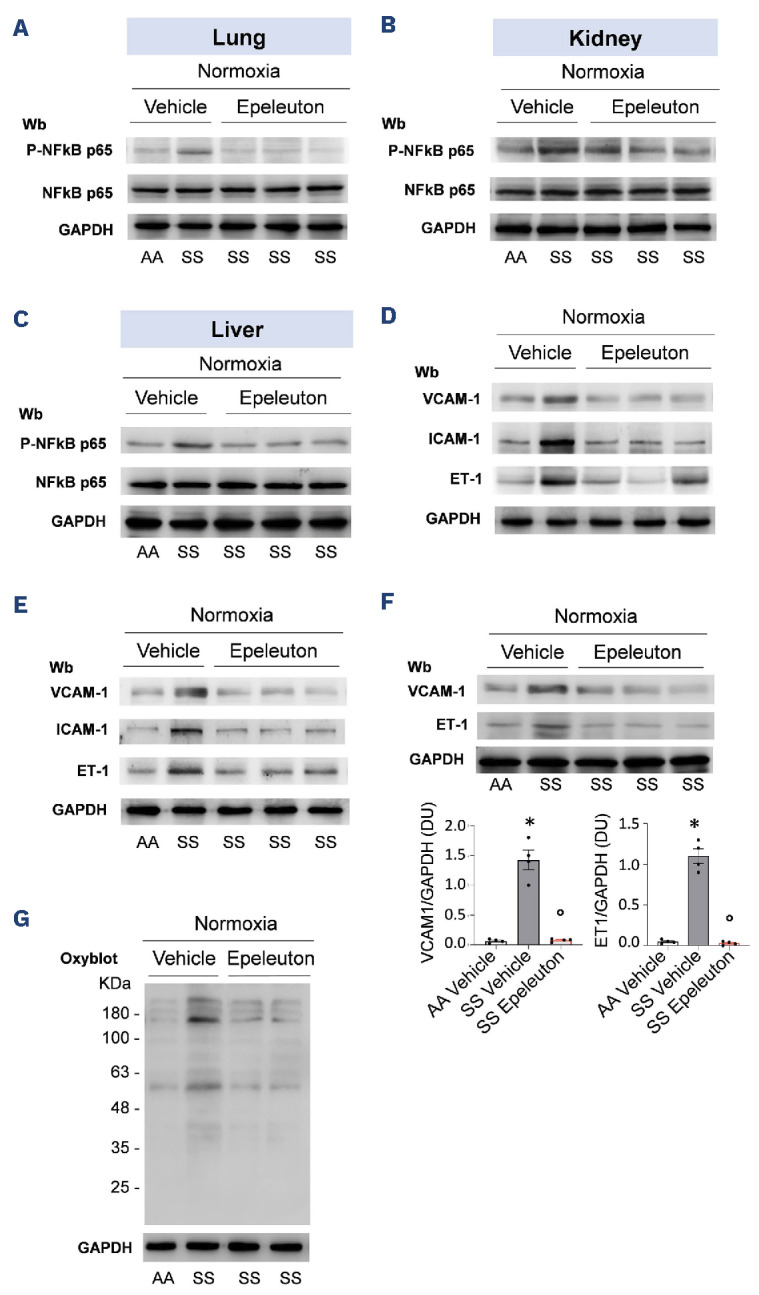
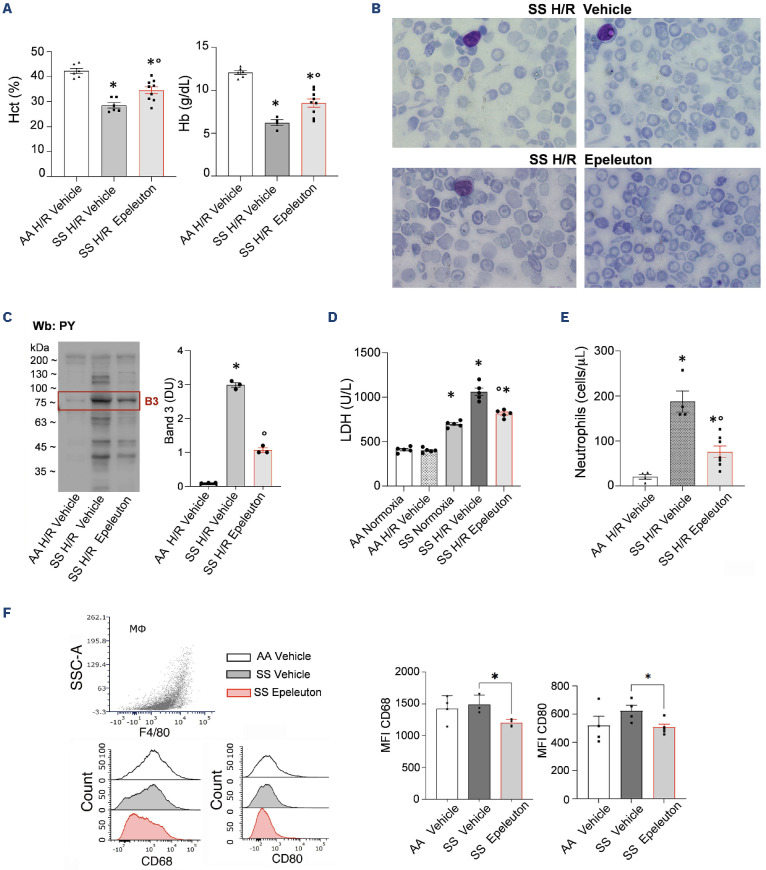
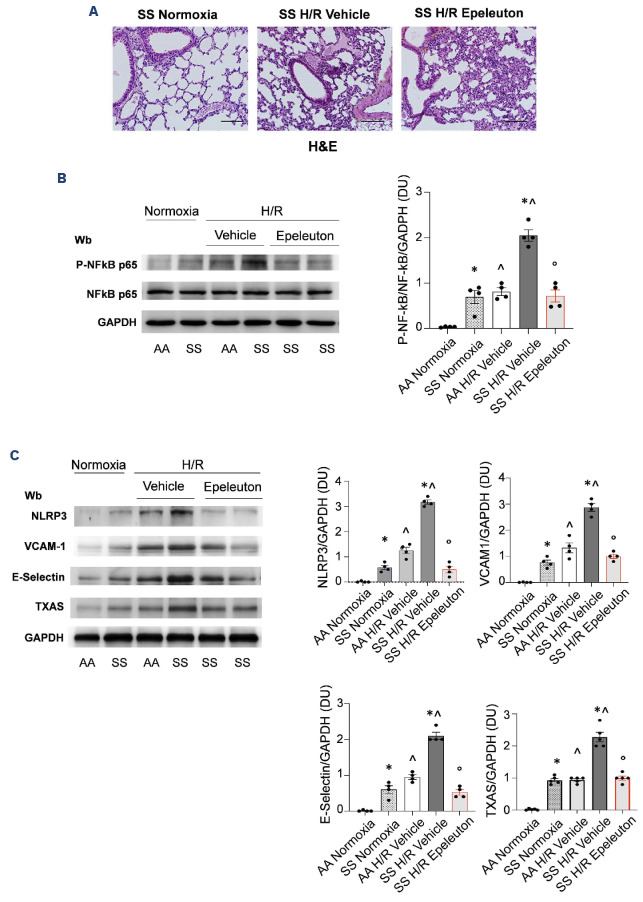
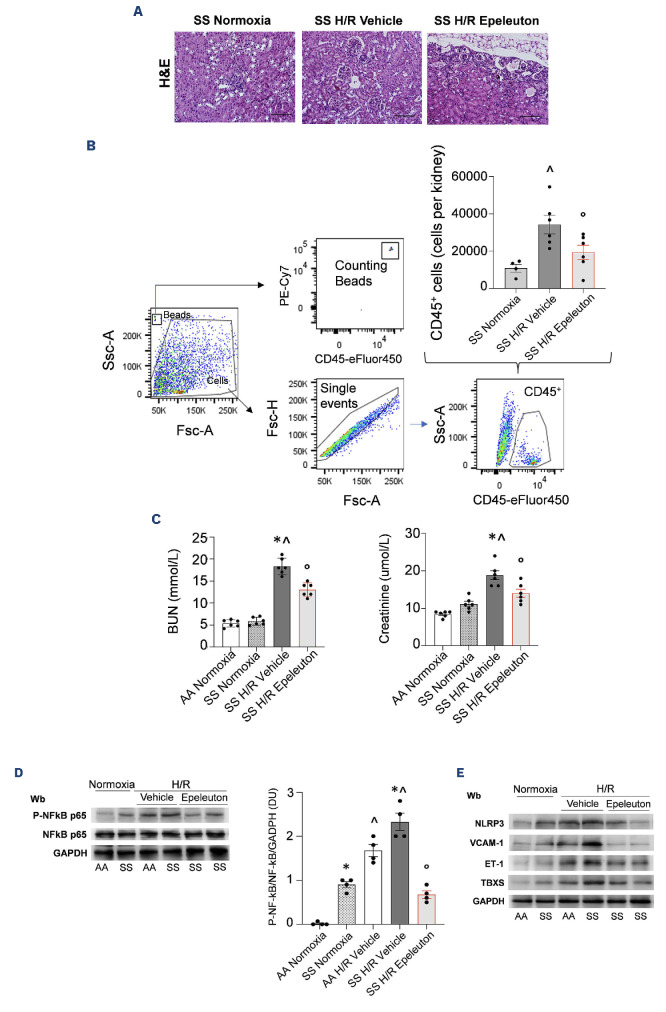
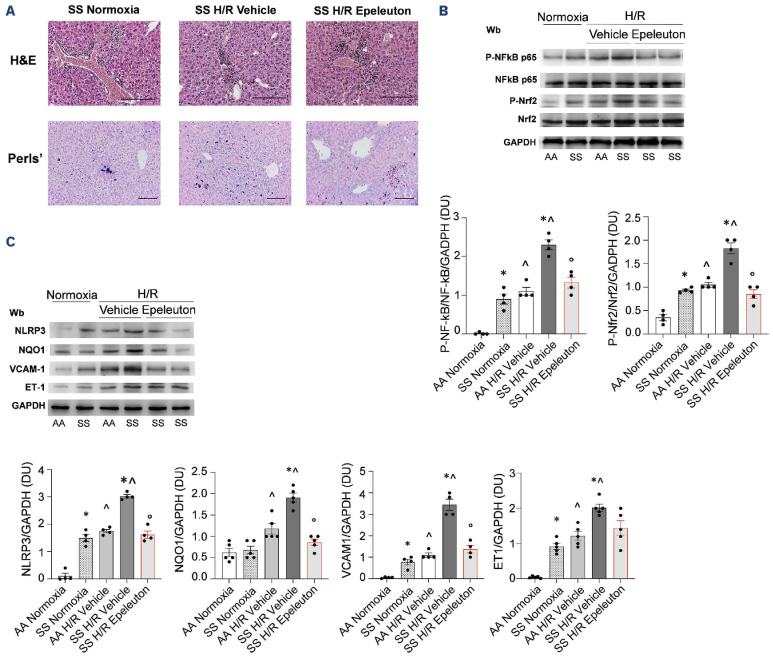
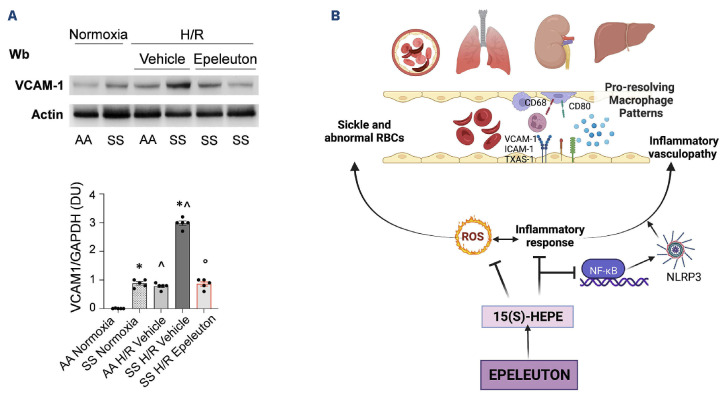
Inflammatory vasculopathy is critical in sickle cell disease (SCD)-associated organ damage. An imbalance between pro-inflammatory and pro-resolving mechanisms in response to different triggers such as hypoxia/reoxygenation or infections has been proposed to contribute to the progression of SCD. Administration of specialized pro-resolving lipid mediators may provide an effective therapeutic strategy to target inflammatory vasculopathy and to modulate inflammatory response. Epeleuton (15 hydroxy eicosapentaenoic acid ethyl ester) is a novel, orally administered, second-generation ω-3 fatty acid with a favorable clinical safety profile. In this study we show that epeleuton re-programs the lipidomic pattern of target organs for SCD towards a pro-resolving pattern. This protects against systemic and local inflammatory responses and improves red cell features, resulting in reduced hemolysis and sickling compared with that in vehicle-treated SCD mice. In addition, epeleuton prevents hypoxia/reoxygenation-induced activation of nuclear factor-κB with downregulation of the NLRP3 inflammasome in lung, kidney, and liver. This was associated with downregulation of markers of vascular activation in epeleuton-treated SCD mice when compared to vehicle-treated animals. Collectively our data support the potential therapeutic utility of epeleuton and provide the rationale for the design of clinical trials to evaluate the efficacy of epeleuton in patients with SCD.


Figures

Figure 1.
Figure 1.
Epeleuton reduces circulating neutrophils and promotes a pro-resolving lipidomic profile in lung and liver of mice with sickle cell disease. (A) Circulating neutrophils identified by flow cytometric analysis as CD45+Ly6G+ cells in healthy mice (AA) and sickle cell disease (SCD) mice (SS) treated with either vehicle or epeleuton (1,000 mg/kg/day for 6 weeks). Data are presented as mean ± standard error of mean (SEM) (N=4-9). *P<0.05 compared to healthy mice; °P<0.05 compared to vehicle-treated SS animals by one-way analysis of variance. (B, C) Liquid chromatography tandem mass spectrometry-based lipidomics of oxylipins in lung (B) and liver (C) from AA, vehicle-treated SCD, or epeleuton-treated SCD mice. Results are mean ± SEM (N=3-4). °P<0.05 compared to vehicle-treated SS animals by the Kruskal Wallis test. 15-HEPE: 15-hydroxyeicosanopentaenoic acid; 12-HETE: 12-hydroxyeicosatetetraenoic acid; 4-HDHA: 4-hydroxydocosahexaenoic acid; LTB4: leukotriene B4.
Figure 2.
Figure 2.
Epeleuton modulates inflammatory response with downregulation of markers of inflammatory vasculopathy. (A-C) Immunoblot analyses using specific antibodies against phosphorylated (p-) NF-kB p65 and NF-kB p65 in lung (A), kidney (B) and liver (C) from healthy mice (AA) and sickle cell disease (SCD) mice (SS) under normoxic conditions treated with either vehicle or epeleuton (1,000 mg/ kg/day for 6 weeks). Lane 1: vehicle-treated AA mouse; lane 2: vehicle-treated SS mouse; lanes 3-5: epeleuton-treated SCD mice (results for 3 separate animals are shown). Protein (75 µg) was loaded on an 8% T, 2.5% C polyacrylamide gel. One representative gel from four with similar results is shown. Densitometric analysis of the immunoblots is shown in Online Supplementary Figure S4A. (D, E) Immunoblot analysis using specific antibodies against VCAM-1, ICAM-1, and ET-1 in lung (D) and kidney (E) from AA and SCD mice treated as in (A). Lane 1: vehicle-treated AA mouse; lane 2: vehicle-treated SS mouse; lanes 3-5: epeleuton-treated SCD mice (results for 3 separate animals are shown). Protein (75 µg) was loaded on an 11% T, 2.5% C polyacrylamide gel. One representative gel from four with similar results is shown. Densitometric analysis of immunoblots is shown in Online Supplementary Figures S4B and S5A. (F) Upper panel. Immunoblot analysis using specific antibodies against VCAM-1 and ET-1 in liver from AA and SCD mice treated as in (A). Lane 1: vehicle-treated AA mouse; lane 2: vehicle-treated SS mouse; lanes 3-5: epeleuton-treated SCD mice (results for 3 separate animals are shown). Protein (50 µg/µL) was loaded on an 8% T, 2.5% C polyacrylamide gel. One representative gel from four with similar results is shown. Lower panel. Densitometric analysis of the immunoblots. Data are presented as means ± standard error of mean (N=4); *P<0.05 compared to AA mice; °P<0.05 compared to vehicle by one-way analysis of variance. (G) OxyBlot analysis of the soluble fractions of liver from AA and SCD mice treated as in (B). Lane 1: vehicle-treated AA mouse; lane 2: vehicle-treated SS mouse; lanes 3-5: epeleuton-treated SCD mice (results from 2 separate animals are shown). The carbonylated proteins (1 mg) were detected by treatment with 2,4-dinitrophenylhydrazine (DNP) and blotted with anti-DNP antibody. Quantification of band area is shown in Online Supplementary Figure S5B. GAPDH served as the protein loading control (A-G). Wb: western blot; NFkB: nuclear factor kB; GAPDH: glyceraldehyde-3-phosphate dehydrogenase; VCAM-1: vascular cell adhesion molecule 1; ICAM-1: intercellular adhesion molecule 1; ET-1: endothelin-1; DU: densitometric units.
Figure 3.
Figure 3.
In sickle cell disease mice exposed to hypoxia/reoxygenation stress, epeleuton reduces the stress-induced hemolysis, modulates the inflammatory response, and reprograms spleen macrophages towards a pro-resolving pattern. (A) Hematocrit (left panel) and hemoglobin (right panel) in healthy mice (AA) and sickle cell disease (SCD) mice (SS) exposed to hypoxia/reoxygenation (H/R): stress, hypoxia (8% oxygen; 10 hours) followed by reoxygenation (21% oxygen; 3 hours), treated with either vehicle or epeleuton (1,000 mg/kg/day for 6 weeks). Data are presented as means ± standard error of mean (SEM) (N=4-9). *P<0.05 compared to AA mice; °P<0.05 compared to vehicle-treated mice by an unpaired t test with Bonferroni correction. (B) Erythrocyte morphology in a blood smear of SCD mice treated as in (A). One representative image is shown. Original magnification 100×. Quantification is shown in Online Supplementary Figure S6A. (C) Immunoblot analysis using specific anti-phospho-tyrosine antibody of red cell membrane proteins from mice treated as in (A). Lane 1: vehicle-treated AA mouse exposed to H/R; lane 2: vehicle-treated SCD mouse exposed to H/R; lane 3: epeleuton-treated SS mouse exposed to H/R. Proteins (75 µg) were loaded on an 8% T, 2.5% C polyacrylamide gel (see Online Supplementary Figure S6B for Coomassie staining, used as the loading control). Densitometric analysis of the phosphorylation of band-3 is shown on the right. Data are presented as means ± standard error of mean (SEM) (N=3). *P<0.05 compared to AA mice; °P<0.05 compared to vehicle-treated mice by an unpaired t test with the Bonferroni correction. (D) Plasma concentrations of lactate dehydrogenase in AA and SCD mice under conditions of normoxia or exposed to H/R and treated as in (A). Data are mean ± SEM (N=5). *P<0.05 compared to AA mice; °P<0.05 compared to vehicle-treated mice by one-way analysis of variance (ANOVA). (E) Circulating neutrophils identified by flow cytometric analysis as CD45+Ly6G+ cells in mice treated as in (A). Data are mean ± SEM (N=4-7), *P<0.05 compared to AA mice; °P<0.05 compared to vehicle-treated mice by one-way ANOVA. (F) Flow cytometry gating strategy and representative plots of spleen macrophages from AA or SCD mice treated with vehicle or epeleuton. M1 marker expression on spleen macrophages and red blood cell clearance from AA or SS mice fed with epeleuton, as determined by flow cytometry in F4/80+ cells. Results are means ± standard deviation (N=4 mice/group); *P<0.05 (one-way ANOVA). Hct: hematocrit; Hb: hemoglobin; Wb: western blot; PY: phosphotyrosine; B3: band 3; DU: densitometric units; LDH: lactate dehydrogenase; SSC: side scatter; MFI: mean fluorescence intensity.
Figure 4.
Figure 4.
Epeleuton reduces lung injury, preventing the overactivation of nuclear factor kB and hypoxia-induced lung inflammatory vasculopathy in mice with sickle cell disease. (A) Representative micro-picture of hematoxylin and eosin-stained sections of lung at 200x magnification from sickle cell disease (SCD) mice (SS) in conditions of normoxia and exposed to hypoxia/reoxygenation (H/R),hypoxia (8% oxygen; 10 hours) followed by reoxygenation (21% oxygen; 3 hours), treated with either vehicle or epeleuton (1,000 mg/kg/day for 6 weeks) (scale bar: 50 μm) (see also Online Supplementary Table S3). (B) Left panel. Immunoblot analysis using specific antibodies against phosphorylated (p-)NF-kB p65 and NF-kB p65 in lung from AA and SS mice treated as (A). Lane 1: AA mouse under normoxia; lane 2: SS mouse under normoxia; lane 3: vehicle-treated AA mouse exposed to H/R; lane 4; vehicle-treated SS mouse exposed to H/R; lanes 5 and 6: epeleuton-treated SS mice exposed to H/R (results from 2 separate animals are shown). Protein (75 µg) was loaded on an 8% T, 2.5% C polyacrylamide gel. GAPDH served as the protein loading control. One representative gel from four with similar results is shown. Right panel. Densitometric analysis of the immunoblots. Data are presented as means ± standard error of mean (SEM) (N=4). *P<0.05 compared to AA mice; ^P<0.05 compared to normoxia; °P<0.05 compared to vehicle by one-way analysis of variance (ANOVA). (C) Left panel. Immunoblot analysis using specific antibodies against NLRP3, VCAM-1, E-selectin and TXAS in lung from AA and SS mice treated as in (A). Lane 1: AA mouse under normoxia; lane 2: SS mouse under normoxia; lane 3: vehicle-treated AA mouse exposed to H/R; lane 4: vehicle-treated SS mouse exposed to H/R; lanes 5 and 6: epeleuton-treated SS mice exposed to H/R (results for 2 separate animals are shown). Protein (75 µg) was loaded on an 8% T, 2.5% C polyacrylamide gel. GAPDH served as the protein loading control. One representative gel from four with similar results is shown. Right panels. Densitometric analyses of the immunoblot. Data are presented as means ± SEM (N=4). *P<0.05 compared to AA mice; ^P<0.05 compared to normoxia; °P<0.05 compared to vehicle by one-way ANOVA. H&E: hematoxylin and eosin; Wb: western blot; NFkB: nuclear factor kB; GAPDH: glyceraldehyde-3-phosphate dehydrogenase; DU: densitometric units; NLRP3: nucleotide-binding domain, leucine-rich-containing family, pyrin domain-containing-3; VCAM-1: vascular cell adhesion molecule 1; TXAS: thromboxane synthase.
Figure 5.
Figure 5.
Epeleuton diminishes hypoxia/reoxygenation-induced kidney damage and markers of vascular dysfunction in mice with sickle cell disease. (A) Representative micro-pictures of hematoxylin and eosin-stained sections of kidney at 200x magnification from sickle cell disease (SCD) mice (SS) exposed to hypoxia/reoxygenation (H/R): hypoxia (8% oxygen; 10 hours), followed by reoxygenation (21% oxygen; 3 hours) treated with either vehicle or epeleuton (1,000 mg/kg/day for 6 weeks) (scale bar: 50 μm) (see also Online Supplementary Table S3). (B) Kidney leukocyte infiltrates determined by flow cytometry gating analysis (the gating strategy is shown in Online Supplementary Figure S8). Data are presented as means ± standard error of mean (SEM) (N=4-6). ^P<0.05 compared to normoxia; °P<0.05 compared to vehicle by an unpaired t test with Bonferroni correction. (C) Plasma blood urea nitrogen (left panel) and creatinine (right panel) in healthy (AA) and SCD (SS) mice under conditions of normoxia or exposed to H/R as in (A). Data are means ± SEM (N=6). *P<0.05 compared to AA mice; ^P<0.05 compared to normoxia; °P<0.05 compared to vehicle by one-way analysis of variance (ANOVA). (D) Left panel. Immunoblot analysis using specific antibodies against phosphorylated (p-) NF-kB p65 and NF-kB p65 in kidney from AA and SS mice treated as in (A). Lane 1: AA mouse under normoxia; lane 2: SS mouse under normoxia; lane 3: vehicle-treated AA mouse exposed to H/R; lane 4: vehicle-treated SS mouse exposed to H/R; lanes 5 and 6: epeleuton-treated SS mice exposed to H/R (results from 2 separate animals are shown). Protein (75 μg) was loaded on an 8% T, 2.5% C polyacrylamide gel. One representative gel from four with similar results is shown. Right panel. Densitometric analysis of the immunoblots. Data are presented as means ± SEM (N=4). *P<0.05 compared to AA mice; ^P<0.05 compared to normoxia; °P<0.05 compared to vehicle by one-way ANOVA. (E) Immunoblot analysis, using specific antibodies against NLRP3, VCAM-1, ET-1 and TBXS in kidney from AA and SS mice treated as in (A). Lane 1: AA mouse under normoxia; lane 2: SS mouse under normoxia; lane 3: vehicle-treated AA mouse exposed to H/R; lane 4: vehicle-treated SS mouse exposed to H/R; lanes 5 and 6: epeleuton-treated SS mice exposed to H/R (results for 2 separate animals are shown). Protein (75 µg) was loaded on an 11% T, 2.5% C polyacrylamide gel. One representative gel from four with similar results is shown. Densitometric analysis of immunoblots is shown on the right. Data are presented as means ± SEM (N=4). *P<0.05 compared to AA mice; ^P<0.05 compared to normoxia; °P<0.05 compared to vehicle by one-way ANOVA. GAPDH served as the protein loading control (D, E). H&E: hematoxylin and eosin; BUN: blood urea nitrogen; Wb: western blot; NFkB: nuclear factor kB; GAPDH: glyceraldehyde-3-phosphate dehydrogenase; DU: densitometric units; Ssc: side scatter; Fsc: forward scatter; PE-Cy7: phycoerythrin cyanine 7; NLRP3: nucleotide-binding domain, leucine-rich-containing family, pyrin domain-containing-3; VCAM-1: vascular cell adhesion molecule 1; ET-1: endothelin 1; TBXS: thromboxane synthase.
Figure 6.
Figure 6.
In sickle cell disease mice exposed to hypoxia/reoxygenation stress, epeleuton reduces liver injury and prevents the overactivation of inflammatory and redox-related pathways. (A) Representative micro-picture of hematoxylin and eosin-stained and Perls-stained sections of liver at 200x magnification from sickle cell disease (SCD) mice (SS) exposed to hypoxia/reoxygenation (H/R), hypoxia (8% oxygen; 10 hours) followed by reoxygenation (21% oxygen; 3 hours), treated with either vehicle or epeleuton (1,000 mg/kg/day for 6 weeks) (scale bar: 50 µm) (see also Online Supplementary Table S3). (B) Immunoblot analysis using specific antibodies against phosphorylated (p-)NF-kB p65, NF-kB p65, p-Nrf2, and Nrf2 in liver from normal (AA) and SS mice as in (A). Lane 1: AA mouse under normoxia; lane 2: SS mouse under normoxia; lane 3: vehicle-treated AA mouse exposed to H/R; lane 4: vehicle-treated SS mouse exposed to H/R; lanes 5 and 6: epeleuton-treated SS mice exposed to H/R (results from 2 separate animals are shown). Protein (75 µg) was loaded on an 8% T, 2.5% C polyacrylamide gel. One representative gel from four with similar results is shown. Densitometric analyses of the immunoblots are shown in the panels below. Data are presented as means ± standard error of mean (SEM) (N=4).*P<0.05 compared to AA mice; ^P<0.05 compared to normoxia; °P<0.05 compared to vehicle by one-way analysis of variance (ANOVA). (C) Immunoblot analysis, using specific antibodies against NLRP3, NQO1, VCAM-1 and ET-1 in liver from AA and SS mice treated as in (A). Lane 1: AA mouse under normoxia; lane 2: SS mouse under normoxia; lane 3: vehicle-treated AA mouse exposed to H/R; lane 4: vehicle-treated SS mouse exposed to H/R; lanes 5 and 6: epeleuton-treated SS mice exposed to H/R (results from 2 separate animals are shown). Protein (75 µg) was loaded on an 11% T, 2.5% C polyacrylamide gel. One representative gel from four or five with similar results is shown. Densitometric analyses of the immunoblots are shown in the panels below. Data are presented as means ± SEM (N=4/5). *P<0.05 compared to AA mice; ^P<0.05 compared to normoxia; °P<0.05 compared to vehicle by one-way ANOVA. GAPDH served as the protein loading control (B, C). H&E: hematoxylin and eosin; Wb: western blot; NFkB: nuclear factor kB; Nrf2: nuclear factor erythroid 2-related factor 2; GAPDH: glyceraldehyde-3-phosphate dehydrogenase; DU: densitometric units; Ssc: side scatter; Fsc: forward scatter; PE-Cy7: phycoerythrin cyanine 7; NLRP3: nucleotide-binding domain, leucine-rich-containing family, pyrin domain-containing-3; NQO1: NAD(P)H quinone dehydrogenase 1; VCAM1: vascular cell adhesion molecule 1; ET1: endothelin 1.
Figure 7.
Figure 7.
Epeleuton protects against progression of inflammatory vasculopathy related to acute hypoxia/reoxygenation stress in mice with sickle cell disease. (A) Immunoblot analysis, using specific antibodies against VCAM-1 (40 μg of protein loaded on an 8% T, 2.5% C polyacrylamide gel) in isolated aorta from healthy mice (AA) and sickle cell disease (SCD) mice (SS) under normoxia or exposed to hypoxia/reoxygenation (H/R) treated with either vehicle or epeleuton (1,000 mg/kg/day for 6 weeks). Lane 1: AA mouse under normoxia; lane 2: SS mouse under normoxia; lane 3: vehicle-treated AA mouse exposed to H/R; lane 4: vehicle-treated SS mouse exposed to H/R; lanes 5 and 6: epeleuton-treated SS mice exposed to H/R (results from 2 separate animals are shown). Actin served as the protein loading control. One representative gel from five with similar results is shown. Densitometric analysis of immunoblots is shown in the lower panel. Data are presented as means ± standard error of mean (N=5). *P<0.05 compared to AA mice; ^P<0.05 compared to normoxia; °P<0.05 compared to vehicle by one-way analysis of variance. (B) Schematic diagram of the dual anti-inflammatory and pro-resolution effects of epeleuton in the humanized mouse model of SCD. Epeleuton and its active moiety 15(S)-HEPE favor pro-resolving mechanisms targeting inflammation, the reactive oxygen species burst, NF-kB activation and NLRP3 inflammasome expression. This results in prevention of red blood cell sickling, inflammatory vasculopathy reduction and macrophages pro-resolving reprogramming (CD68 and CD80) in target organs for SCD. Wb: western blot; VCAM-1: vascular cell adhesion molecule 1; GAPDH: glyceraldehyde-3-phosphate dehydrogenase; DU: densitometric units; RBC: red blood cells; ICAM-1: intercellular adhesion molecule 1; TXAS-1: thromboxane synthase 1; ROS: reactive oxygen species; NF-kB: nuclear factor kB; NLRP3: nucleotide-binding domain, leucine-rich-containing family, pyrin domain-containing-3; 15(S)-HEPE: 15(S) hydroxy eicosapentaenoic acid.

References

    1. Bunn HF. Pathogenesis and treatment of sickle cell disease. N Engl J Med. 1997;337(11):762-769. - PubMed
    1. Hebbel RP. The systems biology-based argument for taking a bold step in chemoprophylaxis of sickle vasculopathy. Am J Hematol. 2009;84(9):543-545. - PubMed
    1. Telen MJ, Malik P, Vercellotti GM. Therapeutic strategies for sickle cell disease: towards a multi-agent approach. Nat Rev Drug Discov. 2019;18(2):139-158. - PMC - PubMed
    1. Fredman G, Hellmann J, Proto JD, et al. . An imbalance between specialized pro-resolving lipid mediators and pro-inflammatory leukotrienes promotes instability of atherosclerotic plaques. Nat Commun. 2016;7:12859. - PMC - PubMed
    1. Serhan CN, Jain A, Marleau S, et al. . Reduced inflammation and tissue damage in transgenic rabbits overexpressing 15-lipoxygenase and endogenous anti-inflammatory lipid mediators. J Immunol. 2003;171(12):6856-6865. - PubMed

Publication types

Substances