

This is a preprint.
Single Cell Spatial Transcriptomic Profiling Identifies a LINE1 Associated Disarrayed Immune Microenvironment in Hepatocellular Carcinoma
- PMID: 38105940
- PMCID: PMC10723373
- DOI: 10.1101/2023.12.04.570014
Single Cell Spatial Transcriptomic Profiling Identifies a LINE1 Associated Disarrayed Immune Microenvironment in Hepatocellular Carcinoma
Abstract
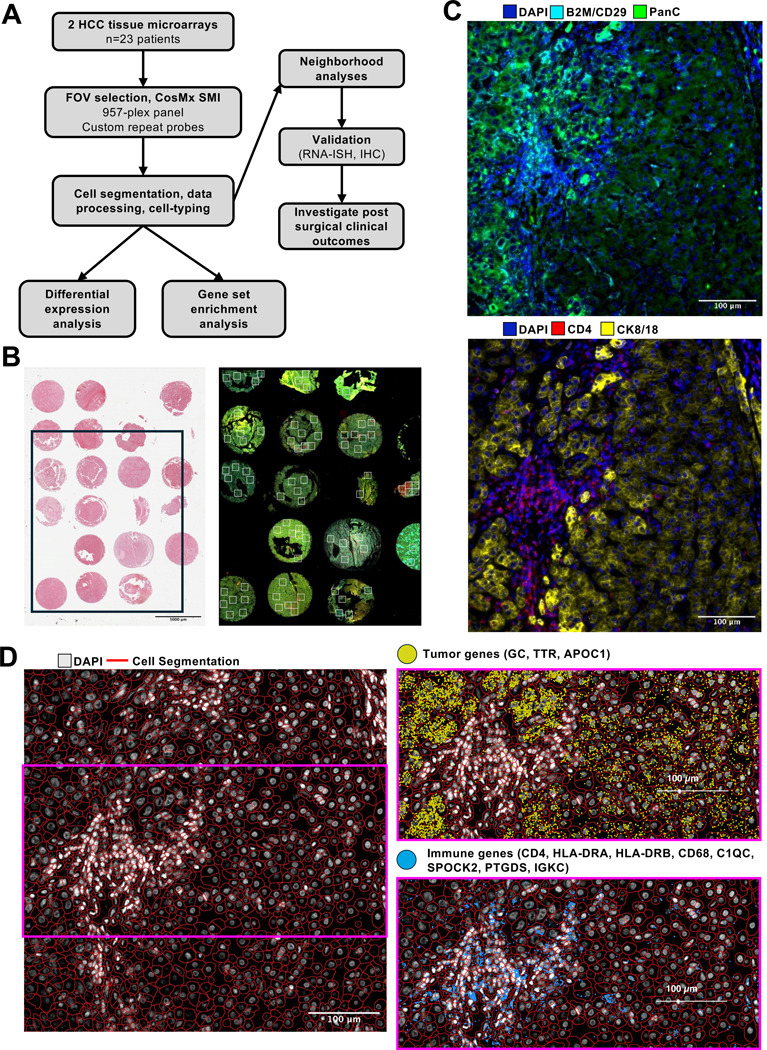
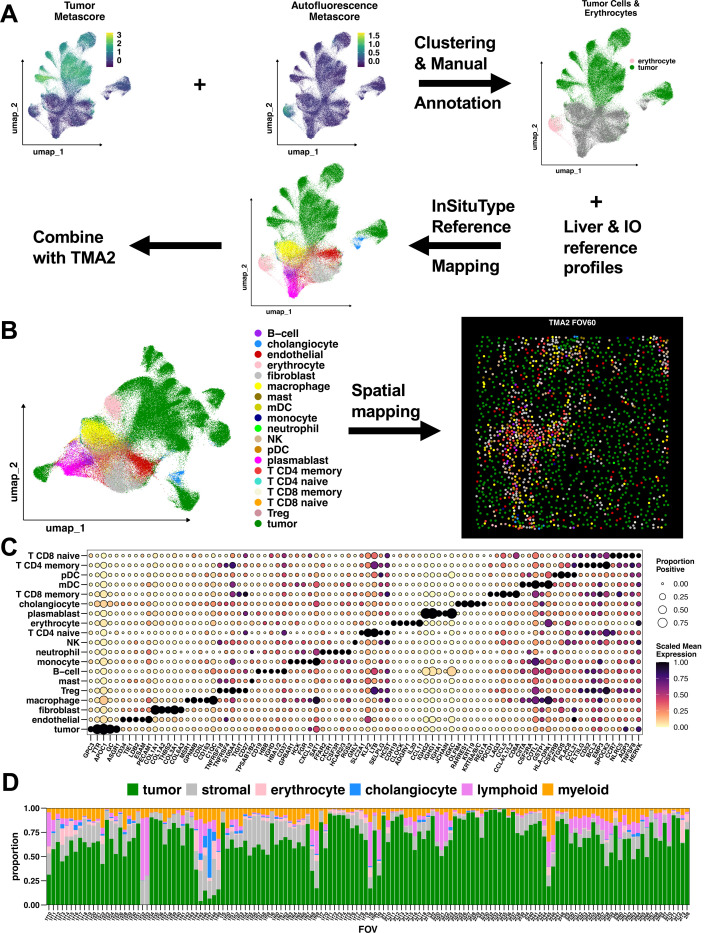
Purpose: Hepatocellular carcinoma (HCC) is a lethal malignancy driven by complex interactions between cancer cells, immune cells, and additional stromal cells in the tumor microenvironment (TME). The LINE1 retrotransposon is a ubiquitous repeat RNA whose de-repression leads to significant cancer cell-intrinsic and TME changes that promote aggressive tumor characteristics. We leveraged single cell spatial transcriptomic profiling to characterize the relationship between LINE1 and differences in the heterogeneous HCC TME.
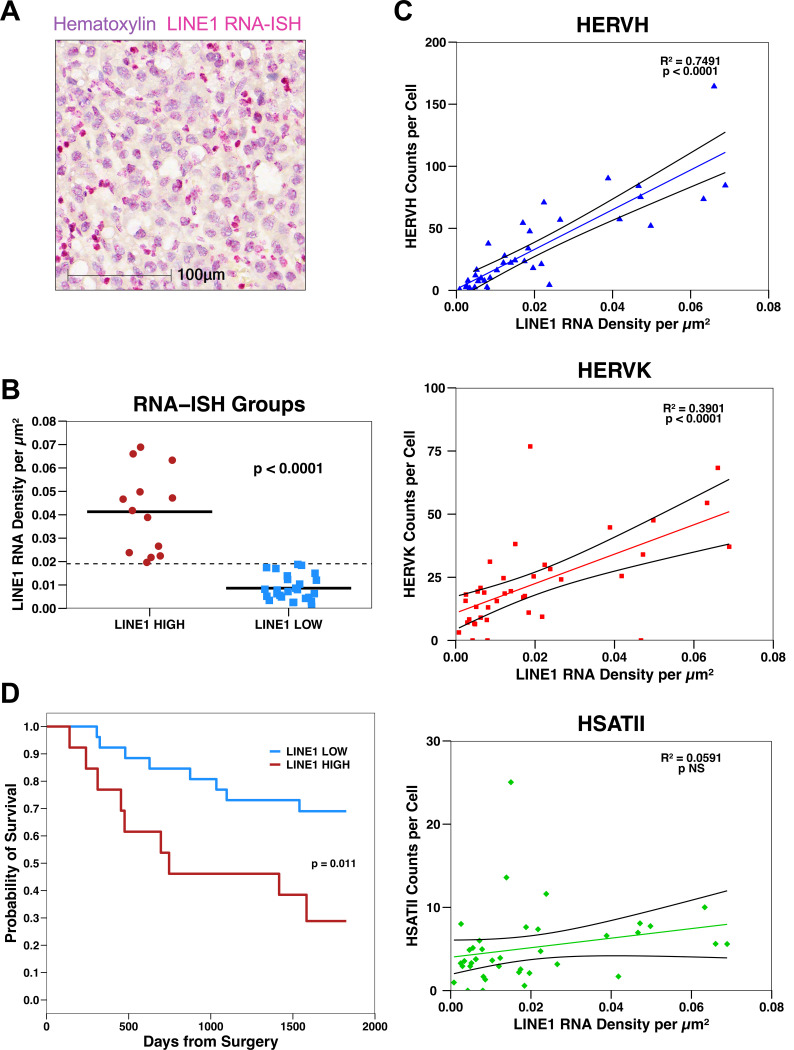
Experimental design: We applied our profiling methodology to a cohort of 23 tissue specimens collected from patients who had undergone liver resection or transplantation and validated it in a partially-overlapping similar cohort of 39 specimens using RNA in-situ hybridization (RNA-ISH).
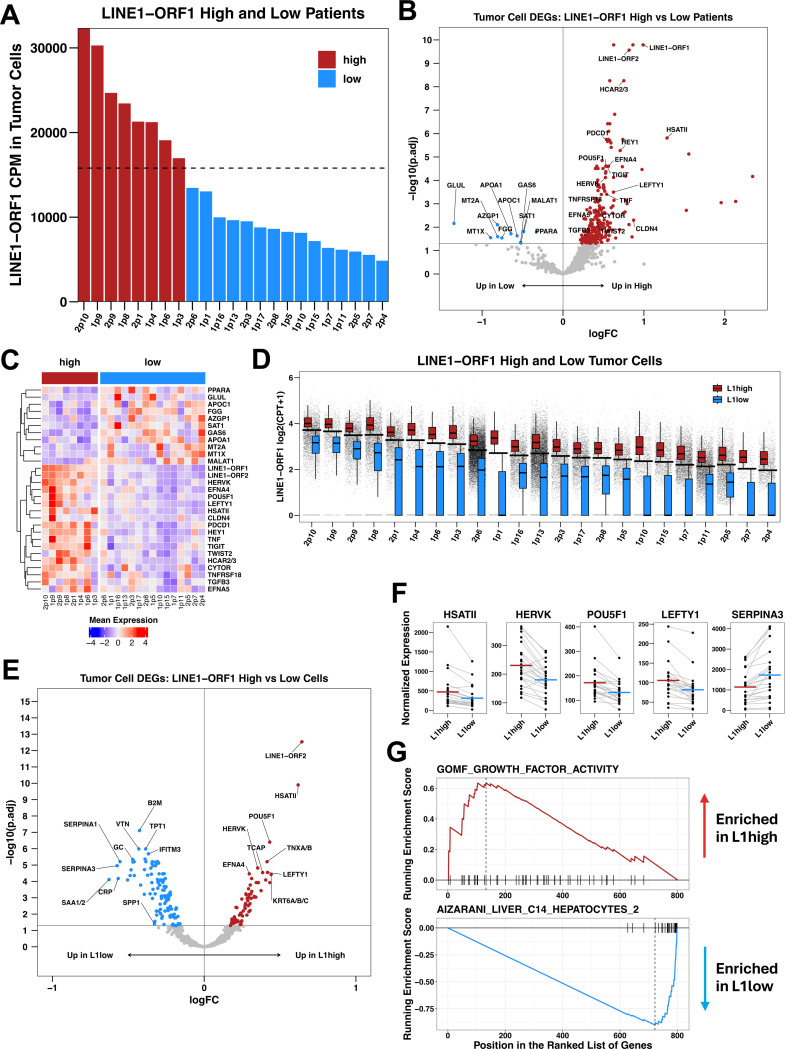
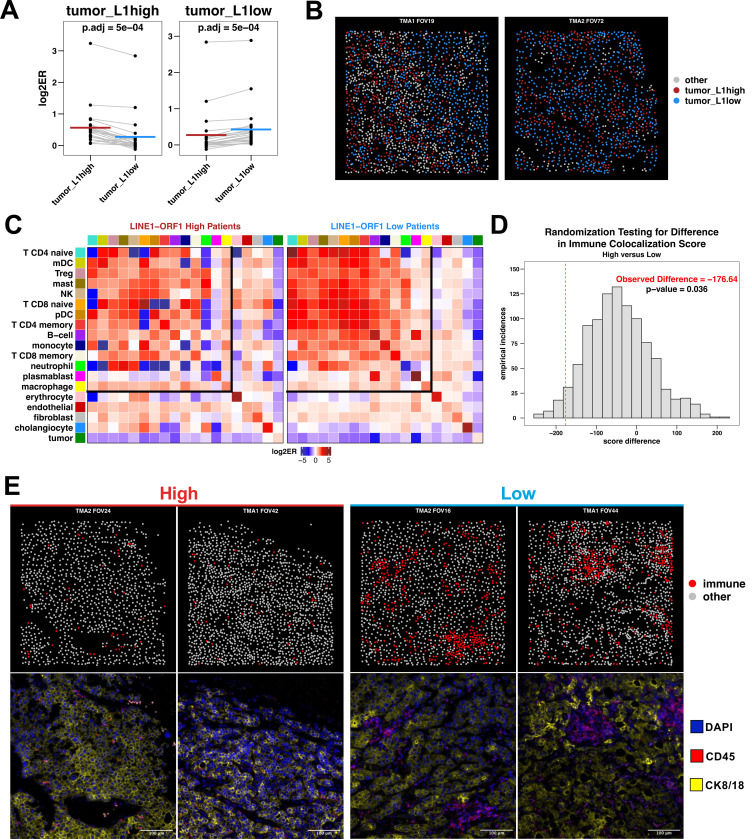
Results: We found that LINE1-high tumors and LINE1-high single HCC cells exhibited a de-differentiated, stem-like, and inflammatory phenotype. Furthermore, within individual tumors, LINE1 high cancer cells associated spatially with one another and excluded the larger, organized immune cell conglomerates seen in LINE1 low tumors. Finally, we found that LINE1 RNA expression correlated with worse overall survival in the larger expanded retrospective cohort.
Conclusions: Our study is the first to show a clearly disorganized immune TME in HCC driven by LINE1 expression, and this observation correlated with poor survival for patients whose tumors expressed large amounts of the LINE1 repeat RNA. These results provide further evidence of how effective anti-tumor immune responses contribute to cures after definitive surgery and may lead to novel biomarkers or drug targets in HCC.
Keywords: LINE1; Spatial transcriptomics; hepatocellular carcinoma; immune microenvironment; repeat RNAs; tumor microenvironment.
Figures
Similar articles
-
Systemic pharmacological treatments for chronic plaque psoriasis: a network meta-analysis.Cochrane Database Syst Rev. 2021 Apr 19;4(4):CD011535. doi: 10.1002/14651858.CD011535.pub4. Cochrane Database Syst Rev. 2021. Update in: Cochrane Database Syst Rev. 2022 May 23;5:CD011535. doi: 10.1002/14651858.CD011535.pub5. PMID: 33871055 Free PMC article. Updated.
-
Multi-pronged analysis of pediatric low-grade glioma reveals a unique tumor microenvironment associated with BRAF alterations.bioRxiv [Preprint]. 2024 Apr 10:2024.04.05.588294. doi: 10.1101/2024.04.05.588294. bioRxiv. 2024. Update in: Brain Pathol. 2025 Jun 30:e70023. doi: 10.1111/bpa.70023. PMID: 38645202 Free PMC article. Updated. Preprint.
-
Systemic pharmacological treatments for chronic plaque psoriasis: a network meta-analysis.Cochrane Database Syst Rev. 2017 Dec 22;12(12):CD011535. doi: 10.1002/14651858.CD011535.pub2. Cochrane Database Syst Rev. 2017. Update in: Cochrane Database Syst Rev. 2020 Jan 9;1:CD011535. doi: 10.1002/14651858.CD011535.pub3. PMID: 29271481 Free PMC article. Updated.
-
Ablative and non-surgical therapies for early and very early hepatocellular carcinoma: a systematic review and network meta-analysis.Health Technol Assess. 2023 Dec;27(29):1-172. doi: 10.3310/GK5221. Health Technol Assess. 2023. PMID: 38149643 Free PMC article.
-
Does Augmenting Irradiated Autografts With Free Vascularized Fibula Graft in Patients With Bone Loss From a Malignant Tumor Achieve Union, Function, and Complication Rate Comparably to Patients Without Bone Loss and Augmentation When Reconstructing Intercalary Resections in the Lower Extremity?Clin Orthop Relat Res. 2025 Jun 26. doi: 10.1097/CORR.0000000000003599. Online ahead of print. Clin Orthop Relat Res. 2025. PMID: 40569278
References
-
- Ducreux M, Zhu AX, Cheng A-L, Galle PR, Ikeda M, Nicholas A, et al. IMbrave150: Exploratory analysis to examine the association between treatment response and overall survival (OS) in patients (pts) with unresectable hepatocellular carcinoma (HCC) treated with atezolizumab (atezo) + bevacizumab (bev) versus sorafenib (sor). Journal of Clinical Oncology 2021;39(15_suppl):4071- doi 10.1200/JCO.2021.39.15_suppl.4071. - DOI
Publication types
Grants and funding
LinkOut - more resources
Full Text Sources