[Preprint]. 2023 Dec 5:rs.3.rs-3616701.
doi: 10.21203/rs.3.rs-3616701/v1.

The Greatwall-Endosulfine-PP2A/B55 pathway controls entry into quiescence by promoting translation of Elongator-tuneable transcripts

Affiliations

The Greatwall-Endosulfine-PP2A/B55 pathway controls entry into quiescence by promoting translation of Elongator-tuneable transcripts

Javier Encinar Del Dedo et al. Res Sq. .

Update in

Abstract

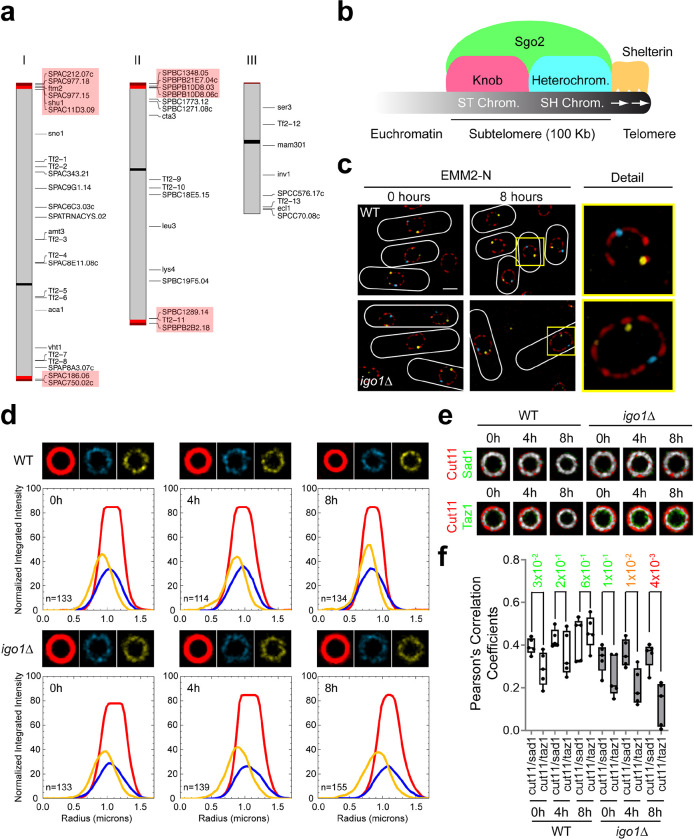
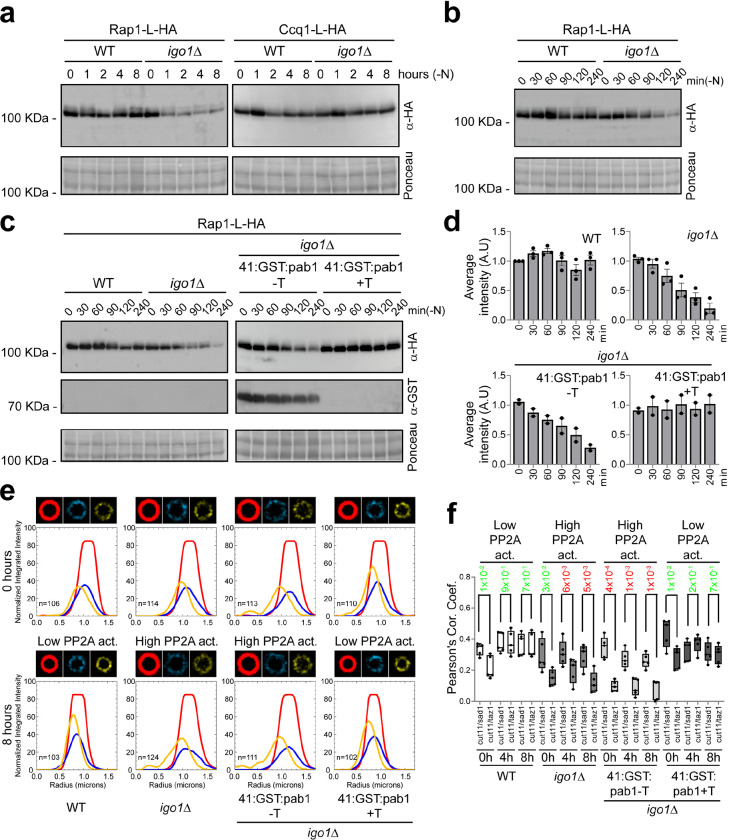
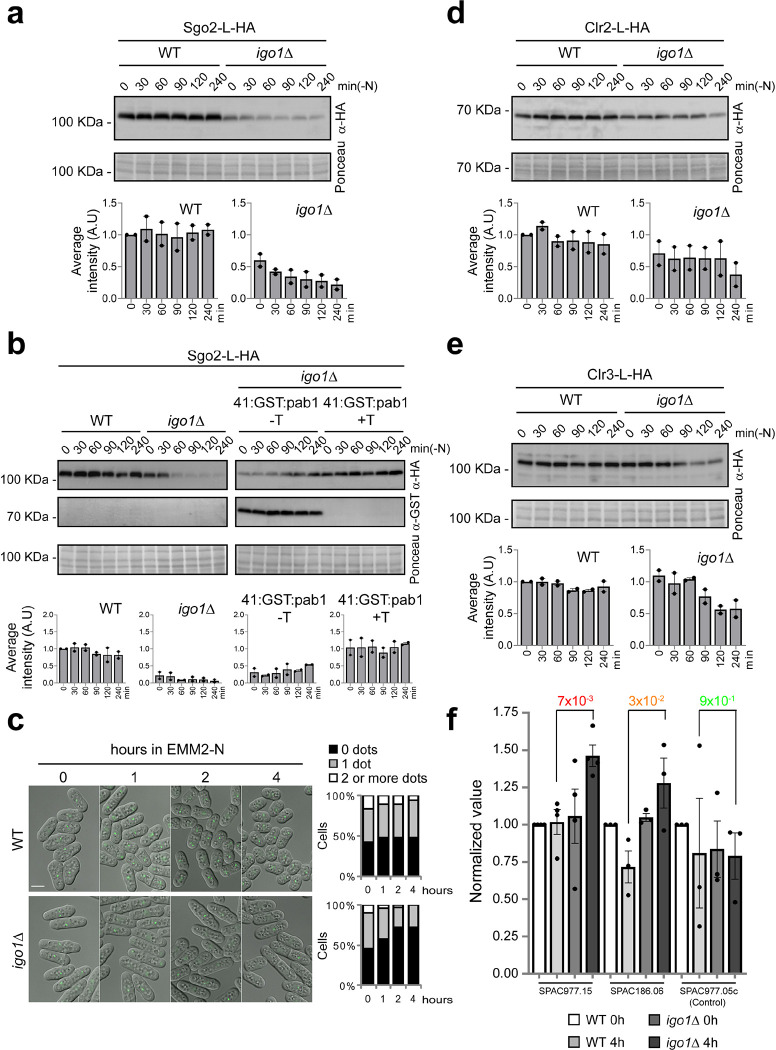
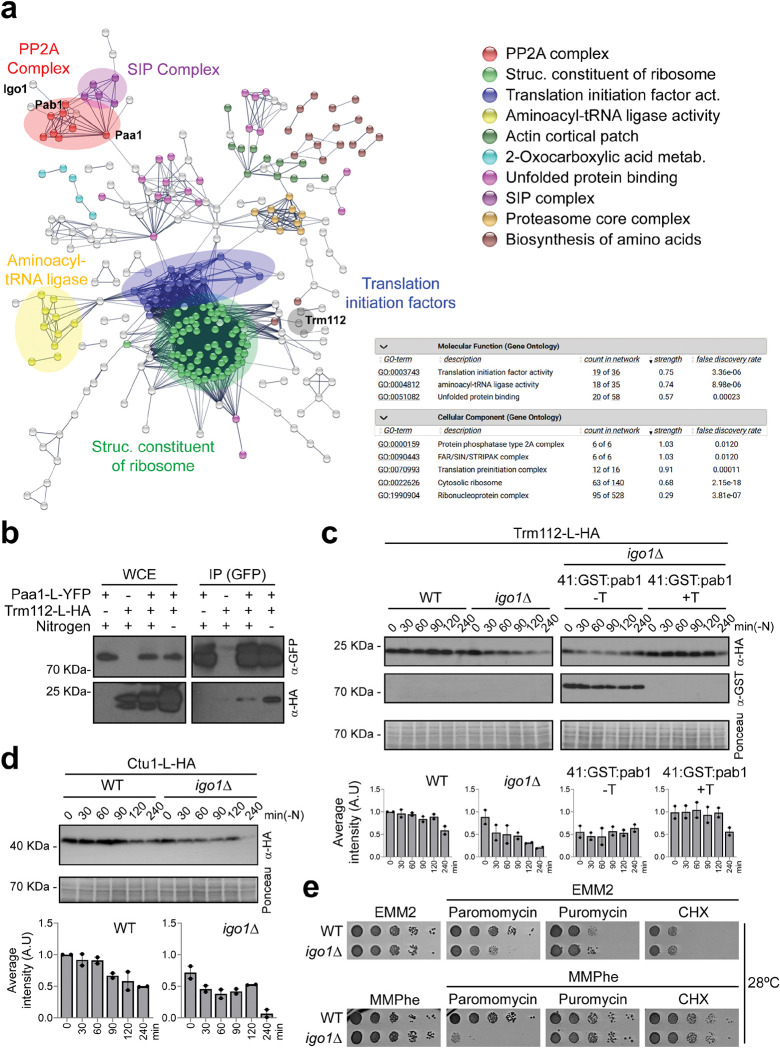
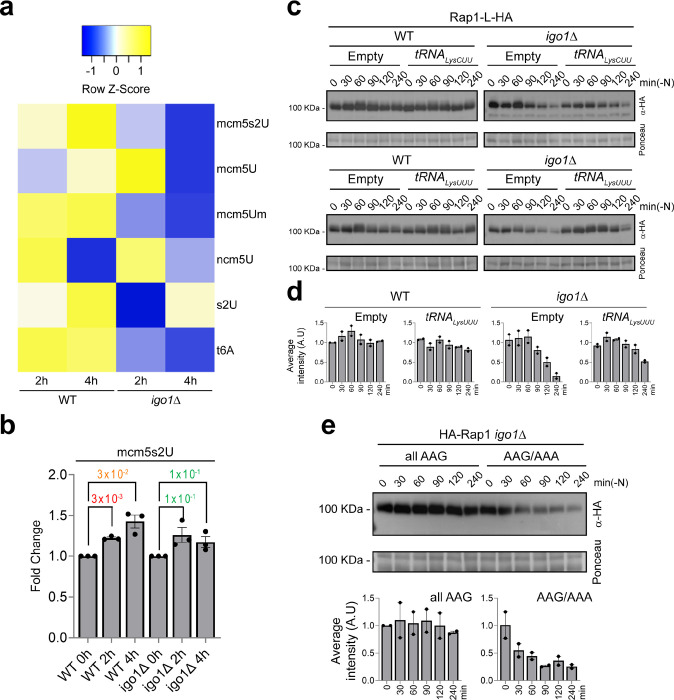
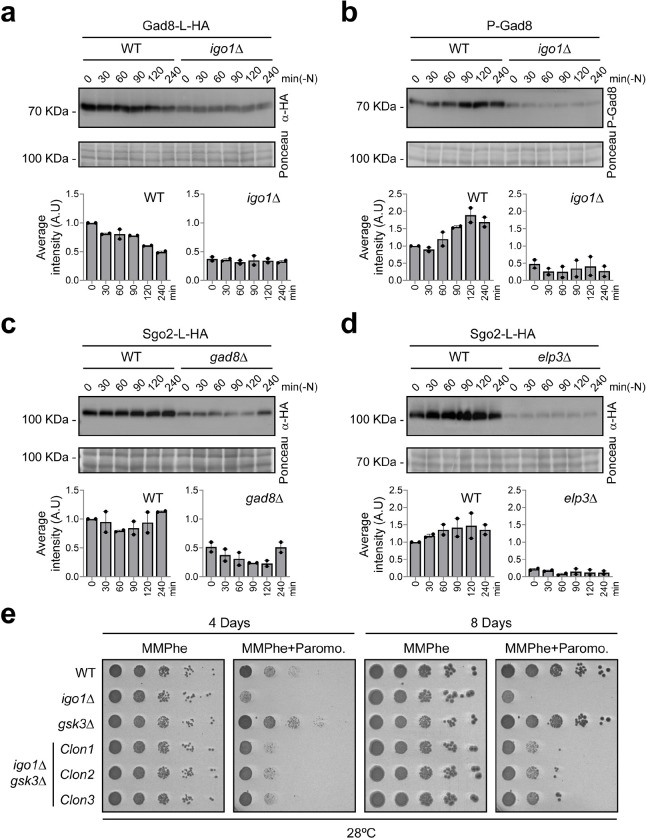
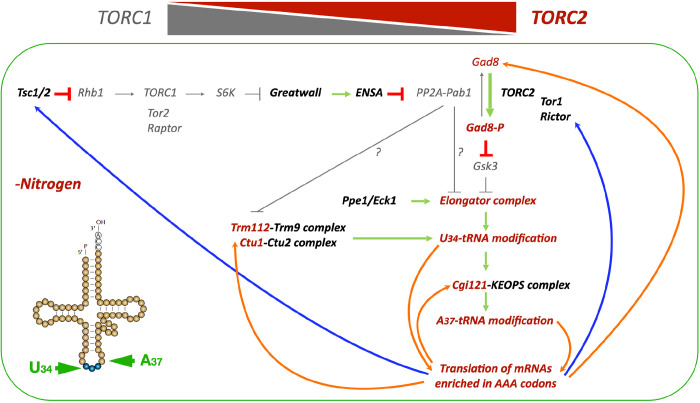
Quiescent cells require a continuous supply of proteins to maintain protein homeostasis. In fission yeast, entry into quiescence is triggered by nitrogen stress, leading to the inactivation of TORC1 and the activation of TORC2. Here, we report that the Greatwall-Endosulfine-PPA/B55 pathway connects the downregulation of TORC1 with the upregulation of TORC2, resulting in the activation of Elongator-dependent tRNA modifications essential for sustaining the translation programme during entry into quiescence. This process promotes U34 and A37 tRNA modifications at the anticodon stem loop, enhancing translation efficiency and fidelity of mRNAs enriched for AAA versus AAG lysine codons. Notably, some of these mRNAs encode inhibitors of TORC1, activators of TORC2, tRNA modifiers, and proteins necessary for telomeric and subtelomeric functions. Therefore, we propose a novel mechanism by which cells respond to nitrogen stress at the level of translation, involving a coordinated interplay between the tRNA epitranscriptome and biased codon usage.

Keywords: Elongator; Endosulfine; Greatwall; Nitrogen starvation; PP2A/B55; Quiescence; TORC1; TORC2; tRNA modifications; translation.


Conflict of interest statement

Competing interests The authors declare no competing interests.

Figures

Fig. 1.
Fig. 1.. The Greatwall-Endosulfine switch regulates subtelomeric gene silencing and telomeric anchoring to the nuclear envelope.
a Schematic representation of transcriptionally upregulated genes in the Endosulfine (igo1Δ) mutant. Genes overexpressed more than 10-fold in igo1Δ cells compared to the wild-type after 4 hours in nitrogen-free EMM2 medium. Subtelomeric genes are highlighted in red. b Schematic illustration of S. pombe subtelomeric chromatin structure (modified from ). c Representative Super-Resolution Radial Fluctuations (SRRF) micrographs of wild-type (WT) and igo1Δ cells expressing Cut11:mCherry, Sad1:CFP and Taz1:YFP in nitrogen-rich EMM2 media (0 hours) and after 8 hours of nitrogen starvation in EMM2-N. The merged image and a detail view are shown. Bar: 2 μm. d Radial Profile Analysis for WT and igo1Δ cells after 0, 4 or 8 hours of nitrogen deprivation (see details in Supplementary Fig. 1b). The average projection signals for the NE (in red), the SPB (in cyan) and the telomeres (in yellow) are shown. The graphs represent the normalized integrated intensity as a function of distance in microns. The red lines correspond to the NE signal, the cyan lines correspond to the SPB signal and the yellow lines correspond to the telomeric signal. Over 100 nuclei were analysed at each time point. e Overlay between the average projection signals for Cut11/Sad1 or Cut11/Taz1 in WT and igo1Δ cells during entry into quiescence. The images were generated by projecting at least 100 nuclei. f Co-localization between Cut11/Sad1 and Cut11/Taz1 signals was quantified as Pearson correlation coefficients using ImageJ software. Student’s t-test p-values are indicated, significant differences are in orange or red.
Fig. 2.
Fig. 2.. Telomeric detachment from the nuclear envelope in igo1Δ cells is mediated by reduced Rap1 protein levels.
a Extracts from rap1:L:HA and ccq1:L:HA cells in a WT and igo1Δ background were collected at 0, 1, 2, 4 and 8 hours of nitrogen starvation. These extracts were analysed by SDS-PAGE and western blotting using anti-HA antibodies. Ponceau staining was used as the loading control. b Extracts from rap1:L:HA cells in a WT and igo1Δ background, collected every 30 minutes during the first 2 hours and then at 4 hours of nitrogen starvation. These extracts were analysed by SDS-PAGE and western blotting using anti-HA antibodies. Ponceau staining was used as the loading control. c Extracts from rap1:L:HA and rap1:L:HA Pnmt41x:GST:pab1 cells in a WT and igo1Δ background were collected during nitrogen starvation and analysed by SDS-PAGE and western blot using anti-HA and anti-GST antibodies. Strains were grown with or without thiamine (+T or −T) to repress or induce the pab1 gene, encoding the B55 regulatory subunit of PP2A. Ponceau staining was used as the loading control. d Immunoblot quantification of c was performed with Image Studio Lite software from at least two independent experiments. e Radial Profile Analysis of WT, igo1Δ and igo1Δ Pnmt41x:GST:pab1 cells bearing Cut11 (in red), Sad1 (in cyan) or Taz1 (in yellow) in EMM2 (0 hours) and after 8 hours of nitrogen starvation. The igo1Δ Pnmt41x:GST:pab1 cells were grown with or without thiamine (+T or −T) to repress or induce the expression of pab1. Over 100 nuclei were projected to generate the images and graphics. f Co-localization between Cut11/Sad1 and Cut11/Taz1 signals of e was quantified as Pearson correlation coefficients using ImageJ software. Student’s t-test p-values are indicated, significant differences are in red.
Fig. 3.
Fig. 3.. Crucial proteins required for silencing subtelomeric gene expression are downregulated in igo1Δ cells.
a Extracts from sgo2:L:HA cells in a WT and igo1Δ backgrounds were collected every 30 minutes during the first 2 hours and then at 4 hours of nitrogen starvation. These extracts were analysed by SDS-PAGE and western blotting using anti-HA antibodies. Ponceau staining was used as the loading control. Immunoblot quantification was performed using Image Studio Lite software from at least two independent experiments. b Extracts from strains bearing sgo2:L:HA or sgo2:L:HA Pnmt41x:GST:pab1, were analysed by SDS-PAGE and western blotting with anti-HA and anti-GST antibodies. The igo1Δ Pnmt41x:GST:pab1 cells were grown with or without thiamine (+T or −T) to repress or induce the expression of pab1. Ponceau staining was used as the loading control. Immunoblot quantification was performed with Image Studio Lite software from at least two independent experiments. c Representative micrographs of WT or igo1Δ cells expressing sgo2:L:GFP during entry into quiescence. The overlay of fluorescence and DIC images is shown. Quantification was carried out using ImageJ software from two independent experiments involving more than 150 cells. Bar: 5 μm. d Similar to (a), clr2:L:HA protein was analysed in both WT and igo1Δ backgrounds. e Similar to (a), clr3:L:HA protein was analysed in both WT and igo1Δ backgrounds. f ChIP-qPCR was performed with anti-H3K14-acetyl antibodies and quantified with primer pairs at the indicated ORFs. WT and igo1Δ cells grown in nitrogen-rich media (EMM2) or after 4 hours of nitrogen starvation were analysed. The graphs represent normalized values, and error bars (SD) for all ChIP-qPCR experiments were calculated from biological triplicates.
Fig. 4.
Fig. 4.. PP2A interacts with proteins involved in tRNA modification.
a Interacting network resulting from mass-spectrometry analysis for paa1:L:YFP in EMM-N. Cellular processes or protein complexes with a significant enrichment are colour-coded. b Interaction between paa1:L:YFP and trm112:L:HA. Protein extracts from cells expressing paa1:L:YFP, trm112:L:HA or paa1:L:YFP trm112:L:HA were immunoprecipitated in nitrogen-rich or nitrogen-depleted media with anti-GFP beads and probed with anti-GFP and anti-HA antibodies. Extracts (WCE) were assayed for levels of paa1:L:YFP and trm112:L:HA by western blot. c Extracts from cells expressing trm112:L:HA or trm112:L:HA Pnmt41x:GST:pab1, were analysed by SDS-PAGE followed by immunoblotting with anti-HA and anti-GST antibodies. The igo1Δ Pnmt41x:GST:pab1 cells were grown in EMM2 with or without thiamine (+T or −T) to repress or induce the expression of pab1. Ponceau staining was used as the loading control. Immunoblot quantification was performed with Image Studio Lite software from at least two independent experiments. d Extracts from Ctu1:L:HA cells in a WT and igo1Δ backgrounds were collected every 30 minutes during the first 2 hours and then at 4 hours of nitrogen starvation. These extracts were analysed by SDS-PAGE and immunoblotting using anti-HA antibodies. Ponceau staining was used as the loading control. Immunoblot quantification was performed using Image Studio Lite software from at least two independent experiments. e Serial dilutions from WT and igo1Δ cultures were spotted onto EMM2 (Minimal Media containing NH4Cl) or MMPhe (Minimal Media containing Phenylalanine) plates without or with paromomycin (0.5 mg/ml), puromycin (0.5 mg/ml) or cycloheximide (CHX, 2.5 μg/ml).
Fig. 5.
Fig. 5.. Igo1 regulates some tRNA modifications.
a Heatmap analysis of changes in the relative levels of tRNA ribonucleoside modifications in the WT and the igo1Δ mutant. The side colour bar displays the range of z-score change values. The z-score was calculated as the value for each time point minus the average value for the modification, and the resulting value was divided by the standard deviation. b Fold-change of mcm5S2U34 modification in WT and igo1Δ mutant cells. Student’s t-test p-values were calculated from biological triplicates. c Extracts from strains bearing rap1:L:HA protein transformed with episomal plasmids ptRNACUULys, ptRNAUUULys or the empty vector pREP42x were analysed by SDS-PAGE and western blotting with anti-HA antibodies during nitrogen starvation. Ponceau stain was used as a loading control. d Immunoblot quantification performed with Image Studio Lite software from at least three independent experiments. e Extracts from igo1Δ mutant transformed with episomal plasmids Pnmt41x:HA:rap1 (AAA/AAG) or mutated version Pnmt41x:HA:rap1 (all AAG) were analysed by SDS-PAGE followed by immunoblotting with anti-HA antibodies during nitrogen starvation. Ponceau staining was used as a loading control. Immunoblot quantification were performed with Image Studio Lite software from at least two independent experiments.
Fig. 6.
Fig. 6.. Endosulfine, Gad8 and Elongator are required for efficient translation of certain mRNAs during quiescence entry.
a Extracts from WT and igo1Δ cells expressing gad8:L:HA, were analysed by SDS-PAGE and immunoblotting with anti-HA antibodies during nitrogen starvation. Ponceau stain was used as a loading control. Immunoblot quantification were performed with Image Studio Lite software from at least two independent experiments. b Same as in (a), Gad8 phosphorylation state was analysed in WT and igo1Δ cell extracts. c Same as in (a), sgo2:L:HA protein was analysed in a WT and gad8Δ cell extracts. d Same as in (a), sgo2:L:HA protein was analysed in a WT and elp3Δ cell extracts. e Serial dilutions from cultures of WT, igo1Δ, gsk3Δ and igo1Δ gsk3Δ were spotted onto MMPhe (Minimal Media with Phenylalanine) plates without or with paromomycin (0.5 mg/ml).
Fig. 7.
Fig. 7.. Activation of TORC2-Gad8 signalling in quiescent cells promotes the translation of mRNAs with a high AAALys codon usage.
This model is based on previous work in fission yeast, demonstrating that nitrogen starvation induces the inactivation of TORC1 and the activation of TORC2 signalling through the Greatwall-Endosulfine-PP2A/B55 pathway . Phosphorylation of Gad8 at S546 leads to the inhibition of Gsk3 and the activation of Elongator, which promotes U34 tRNA modification and translation of Tsc1, an inhibitor of TORC1, as well as activators of TORC2, such as Tor1 and Rictor (depicted by blue arrows) . In this study, we present additional feedback loops (indicated by orange arrows) that enhance the translation of Gad8, Trm112, Ctu1 and Cgi121, further increasing the U34 and A37 tRNA modifications necessary for the efficient translation of mRNAs enriched in AAA codons. Such mRNAs include rap1, clr2, clr3 and sgo2, which encode proteins required for the correct attachment of telomeres to the NE.

References

    1. Gonzalez A. & Hall M. N. Nutrient sensing and TOR signaling in yeast and mammals. EMBO J 36, 397–408, doi:10.15252/embj.201696010 (2017). - DOI - PMC - PubMed
    1. Gonzalez A., Hall M. N., Lin S. C. & Hardie D. G. AMPK and TOR: The Yin and Yang of Cellular Nutrient Sensing and Growth Control. Cell Metab 31, 472–492, doi:10.1016/j.cmet.2020.01.015 (2020). - DOI - PubMed
    1. Bontron S. et al. Yeast endosulfines control entry into quiescence and chronological life span by inhibiting protein phosphatase 2A. Cell Rep 3, 16–22, doi:10.1016/j.celrep.2012.11.025 (2013). - DOI - PubMed
    1. Chica N. et al. Nutritional Control of Cell Size by the Greatwall-Endosulfine-PP2A.B55 Pathway. Curr Biol 26, 319–330, doi:10.1016/j.cub.2015.12.035 (2016). - DOI - PubMed
    1. Aono S., Haruna Y., Watanabe Y. H., Mochida S. & Takeda K. The fission yeast Greatwall-Endosulfine pathway is required for proper quiescence/G(0) phase entry and maintenance. Genes Cells 24, 172–186, doi:10.1111/gtc.12665 (2019). - DOI - PubMed

Publication types