[Preprint]. 2023 Dec 6:2023.12.05.23299341.
doi: 10.1101/2023.12.05.23299341.

Multiplexed RNA-FISH-guided Laser Capture Microdissection RNA Sequencing Improves Breast Cancer Molecular Subtyping, Prognostic Classification, and Predicts Response to Antibody Drug Conjugates

Affiliations

Multiplexed RNA-FISH-guided Laser Capture Microdissection RNA Sequencing Improves Breast Cancer Molecular Subtyping, Prognostic Classification, and Predicts Response to Antibody Drug Conjugates

Evan D Paul et al. medRxiv. .

Update in

  • The spatially informed mFISHseq assay resolves biomarker discordance and predicts treatment response in breast cancer.
    Paul ED, Huraiová B, Valková N, Matyasovska N, Gábrišová D, Gubová S, Ignačáková H, Ondris T, Gala M, Barroso L, Bendíková S, Bíla J, Buranovská K, Drobná D, Krchňáková Z, Kryvokhyzha M, Lovíšek D, Mamoilyk V, Mancikova V, Vojtaššáková N, Ristová M, Comino-Méndez I, Andrašina I, Morozov P, Tuschl T, Pareja F, Kather JN, Čekan P. Paul ED, et al. Nat Commun. 2025 Jan 2;16(1):226. doi: 10.1038/s41467-024-55583-2. Nat Commun. 2025. PMID: 39747865 Free PMC article. Clinical Trial.

Abstract

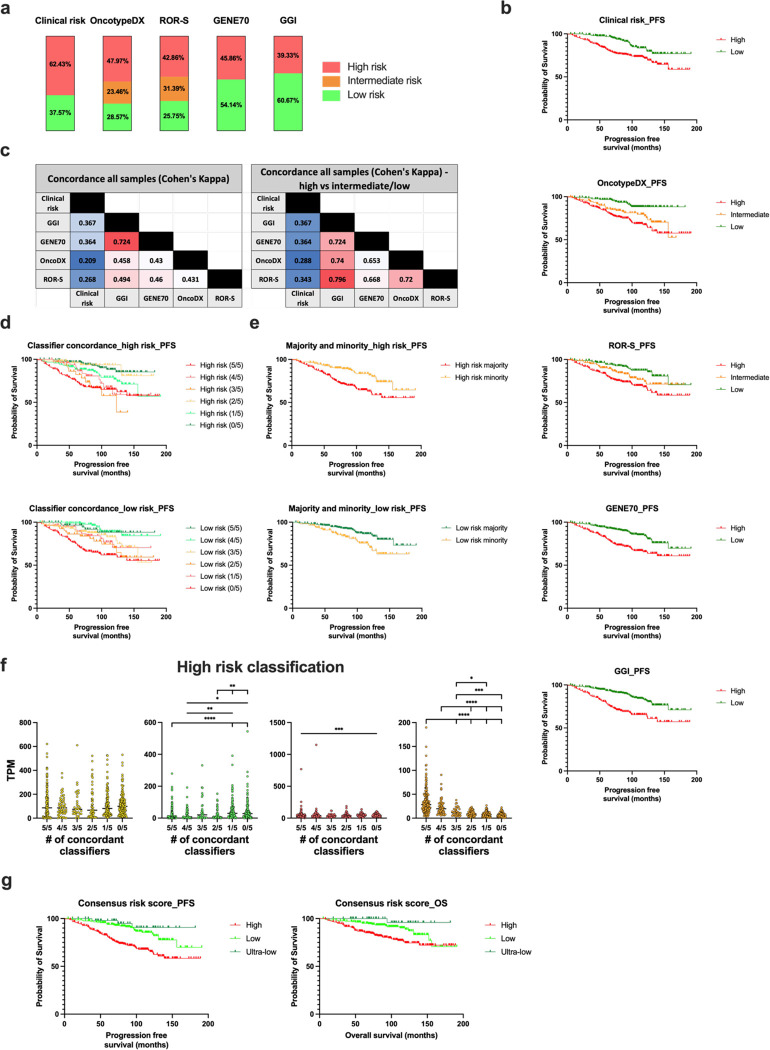
On a retrospective cohort of 1,082 FFPE breast tumors, we demonstrated the analytical validity of a test using multiplexed RNA-FISH-guided laser capture microdissection (LCM) coupled with RNA-sequencing (mFISHseq), which showed 93% accuracy compared to immunohistochemistry. The combination of these technologies makes strides in i) precisely assessing tumor heterogeneity, ii) obtaining pure tumor samples using LCM to ensure accurate biomarker expression and multigene testing, and iii) providing thorough and granular data from whole transcriptome profiling. We also constructed a 293-gene intrinsic subtype classifier that performed equivalent to the research based PAM50 and AIMS classifiers. By combining three molecular classifiers for consensus subtyping, mFISHseq alleviated single sample discordance, provided near perfect concordance with other classifiers (κ > 0.85), and reclassified 30% of samples into different subtypes with prognostic implications. We also use a consensus approach to combine information from 4 multigene prognostic classifiers and clinical risk to characterize high, low, and ultra-low risk patients that relapse early (< 5 years), late (> 10 years), and rarely, respectively. Lastly, to identify potential patient subpopulations that may be responsive to treatments like antibody drug-conjugates (ADC), we curated a list of 92 genes and 110 gene signatures to interrogate their association with molecular subtype and overall survival. Many genes and gene signatures related to ADC processing (e.g., antigen/payload targets, endocytosis, and lysosome activity) were independent predictors of overall survival in multivariate Cox regression models, thus highlighting potential ADC treatment-responsive subgroups. To test this hypothesis, we constructed a unique 19-feature classifier using multivariate logistic regression with elastic net that predicted response to trastuzumab emtansine (T-DM1; AUC = 0.96) better than either ERBB2 mRNA or Her2 IHC alone in the T-DM1 arm of the I-SPY2 trial. This test was deployed in a research-use only format on 26 patients and revealed clinical insights into patient selection for novel therapies like ADCs and immunotherapies and de-escalation of adjuvant chemotherapy.

Keywords: RNA-FISH; RNA-sequencing; antibody drug-conjugates; breast cancer; laser capture microdissection; spatial biology.


Conflict of interest statement

Competing interests All authors have completed the ICMJE uniform disclosure form at www.icmje.org/coi_disclosure.pdf and declared the following: E.D.P., B.H., N.Val., N.B., D.G., S.G., H.I., T.O., S.B., J.B., K.B., D.D., Z.K., M.K., D.L., V.Mam., V.Man., N.Voj., and P.Č. are current, or former employees of MultiplexDX, a biotechnology company that is developing a lab developed diagnostic test called Multiplex8+ (https://www.multiplexdx.com/products/multiplex-eight-plus), which is based on the research presented in the manuscript. P.Č. and E.D.P. are inventors and MultiplexDX, s.r.o is the assignee on patent applications that were filed in relation to the technology and research outlined in the manuscript. T.T. and F.P. are members of the Scientific Advisory board at MultiplexDX. All other authors declare no competing interests.

Figures

Extended Figure 1.
Extended Figure 1.. RNA-FISH image analysis pipeline using digital pathology/machine learning.
Representative images depicting the RNA-FISH image analysis pipeline for tissue and cell segmentation. The tissue was stained for DAPI, ERBB2 (Opal520), MKI67 (Opal570), ESR1 (Opal620), and PGR (Opal690) and scanned at 20x. (a) The image analysis workflow started with raw images of multiple merged fluorescent channels. (b) The same image was split into individual separate fluorescent channels - DAPI, Opal520, Opal570, Opal620, Opal690, and autofluorescence, according to the spectral library for each fluorescent probe, and the autofluorescence was isolated from the image. (c) Using a machine learning algorithm, the tissue was segmented based on the selected training regions (red = tumor; green = stroma) with the training considering the fluorescent signal intensity of DAPI, ERBB2, MKI67, ESR1, and PGR. (d) Then the trained algorithm was applied to the whole image. (e) Individual cells were identified by the shape and intensity of DAPI staining, (f) then segmented, and fluorescent intensity values were normalized to exposure time and obtained for both tumor and stroma.
Extended Figure 2.
Extended Figure 2.. Genes and gene signatures associated with overall survival in the entire cohort.
Forest plot illustrating significant Hazard ratios (HR) obtained from univariate Cox Proportional Hazard (Cox-PH) analyses, using a continuous signature scoring method calculated for the whole dataset (n=1015). Actual numbers in each analysis are lower due to missing follow up data and are denoted in the figure.
Extended Figure 3.
Extended Figure 3.. Gene signatures associated with overall survival in specific clinical subtypes.
A Forest plot illustrating the significant Hazard ratios (HR) obtained from univariate Cox Proportional Hazard (Cox-PH) analyses, using categorical gene signature scoring method separately calculated for each biobank clinical subtype (n=1015). Actual numbers in each analysis are lower due to missing follow up data and are denoted in the figure.
Extended Figure 4.
Extended Figure 4.. Expression of ADC targets in healthy versus invasive breast cancer tissue.
Scatter dot plots illustrate the expression of ADC antigen targets assessed by RNA sequencing in healthy tissue, invasive breast cancer tissue, and individual clinical subtypes. *p < 0.05, **p < 0.01 ***p < 0.001, ****p < 0.0001.
Figure 1.
Figure 1.. Study design, workflow, and analytical validity.
(a) The retrospective validation cohort consisted of 1,082 formalin-fixed paraffin-embedded (FFPE) breast cancer samples, which underwent multiplexed RNA-FISH-guided laser capture microdissection (LCM) coupled with RNA-sequencing. Annotation of the tumor area on an H&E section and the biomarker expression derived from multiplexed RNA-FISH were used to select regions of interest (ROIs) for LCM from cresyl violet sections. These tumor-enriched samples were then sequenced to characterize gene expression signatures to provide diagnostic, prognostic, and predictive inferences from the cohort clinical data (Created with BioRender.com) (b) Clinicopathologic features of the retrospective cohort according to intrinsic molecular subtype. (c) Analytical validity of mFISHseq compared to immunohistochemical data as assessed by receiver operating characteristic (ROC) and precision-recall (PR) curves in 70:30 training and test datasets. (d) Individual biomarker thresholds defined in the training set and applied in the test set.
Figure 2.
Figure 2.. Consensus subtyping yields intrinsic molecular subtypes associated with survival.
(a) Gene expression heatmap depicting the 293 differentially expressed genes in 1013 breast breast cancer samples used for molecular subtyping. The metadata shown in phenobars above the gene expression heatmap includes (from top to bottom) biobank origin, clinical parameters, LCM or no LCM, subtyping approaches, prognostic signatures, and IHC and RNA-FISH results. (b,c) Overall survival according to consensus subtyping with respect to their clinical subtype according to the biobank IHC results and nodal status. (d) The Sankey diagram shows the clinical subtypes according to biobank IHC classification and the proportion of samples reclassified by mFISHseq consensus clustering. (e) Overall survival of consensus molecular subtypes. (f) Overall survival of the Her2 consensus molecular subtype samples classified as the luminal androgen receptor (LAR) TNBC subtype in relation. To other non-LAR Her2 and basal-like consensus subtype samples. The vertical dashed line and annotated percentages denote probability of overall survival at 60 months.
Figure 3:
Figure 3:. Consensus prognostic risk categories show clinically relevant differences in survival
(a) Proportion of risk categories (high, intermediate, and low) among each of the five prognostic classifiers, including Clinical risk, OncotypeDX, Risk of Recurrence by Subtype (ROR-S), GENE70, and Genomic Grade Index (GGI) on 567 ER+/HER2− with 0–3 positive lymph nodes. (b) Progression free survival (PFS) of each of the five prognostic classifiers. (c) Concordance of each classifier when comparing all risk categories (high, intermediate, and low; left table) or after consolidating into two categories (high and intermediate/low combined; right table). (d) Concordance of each classifier for high and low risk samples as illustrated by the number of concordant classifiers and (e) after consolidating into majority (agreement in ≥3 prognostic classifiers) and minority (agreement in 1–2 prognostic classifiers) categories. (f) Distribution of mRNA expression for estrogen receptor (ESR1, yellow, left panel), progesterone receptor (PGR, green, left/middle panel), HER2 receptor (ERBB2, red, right/middle panel), and Ki67 marker of proliferation (MKI67, orange, right panel) in patients that were classified as high risk by a particular number of concordant classifiers (i.e., 1–5 concordant classifiers). (g) Kaplan Meier plots show PFS and overall survival (OS) for each consensus prognostic risk category (high, low, and ultra-low).
Figure 4.
Figure 4.. Gene signatures associated with survival and prediction of treatment response.
(a) Gene expression heatmap illustrating the expression of 92 genes and 110 gene signatures in respect to molecular subtype and clinical parameters. Univariate (b) and multivariate (c) Cox proportional hazards models (CPHM) on 20 ADC targets and their association with overall survival in all samples and stratified by subtype. (d) Univariate logistic regression analysis of 70 genes/gene signatures and their association with pathologic complete response (pCR) in the T-DM1 arm of the I-SPY2 trial. (e) The 19 genes/gene signatures selected in the multivariate logistic regression with elastic net modeling on the training dataset. Green bars denote signatures associated with pCR; red bars indicate signatures associated with no pCR. (f) Performance of two T-DM1_pred classifiers in the test set relative to ERBB2 alone. Univariate T-DM1_pred is a single score derived from all 19 features, while multivariate T-DM1_pred includes all 19 features in a multivariate regression model. AUC = area under the curve. (e) Scatter plots showing the distribution of selected genes/gene signature scores of the T-DM1_pred classifier in patient samples according to pCR.
Figure 5.
Figure 5.. Comparison of laser capture microdissection with bulk processing on biomarker expression, molecular subtyping, and prognostic classifiers.
(a) Photomicrographs depict examples of hematoxylin and eosin-stained resected tumor specimens with low, intermediate, or high tumor content represented in shaded annotations. Scale bars represents 2mm length. (b,c) Change in gene expression of PGR, ESR1, ERBB2, and MKI67 in specimens that were classified as IHC positive (b) or IHC negative (c). (d) Dot plots show the dynamic range of gene expression for each biomarker in LCM vs no LCM matched samples. Dotted lines represent the median. € Expression of cell-type specific markers in LCM vs no LCM samples containing either low, intermediate, or high tumor content. (f,g) Sankey diagrams illustrate change in mFISHseq consensus subtypes (f) and in PAM50 risk of recurrence by subtype (ROR-S) classification (g) for LCM samples and their paired undissected scrolls.
Figure 6.
Figure 6.. Deployment of mFISHseq as a research-use only test.
(a) Table outlining the number of genes and gene signatures and their relevant drug targets/pathways that were used for clinical testing. (b,c) Expression of 20 ADC antigen targets (b) and targets relevant to payloads for topoisomerase and microtubule inhibitors (c) in 26 patients. (d) Proportion of 26 patients according to treatment setting (left bar), molecular subtype (middle bar), and TNBC subtype (right bar). (e) Frequency of therapies that were recommended as the top 3 according to expression of genes and gene signatures tailored to each of the 26 patients.

References

    1. Yersal O. & Barutca S. Biological subtypes of breast cancer: Prognostic and therapeutic implications. World J Clin Oncol 5, 412–424 (2014). - PMC - PubMed
    1. Sorlie T. et al. Repeated observation of breast tumor subtypes in independent gene expression data sets. Proc Natl Acad Sci U S A 100, 8418–8423 (2003). - PMC - PubMed
    1. Sørlie T. et al. Gene expression patterns of breast carcinomas distinguish tumor subclasses with clinical implications. Proceedings of the National Academy of Sciences 98, 10869–10874 (2001). - PMC - PubMed
    1. Perou C. M. et al. Molecular portraits of human breast tumours. Nature 406, 747–752 (2000). - PubMed
    1. Litton J., Burstein H. & Turner N. Molecular testing in breast cancer. vol. 39 (2019). - PubMed

Publication types