[Preprint]. 2023 Dec 5:2023.12.04.569969.
doi: 10.1101/2023.12.04.569969.

An evolution-based framework for describing human gut bacteria

Affiliations

An evolution-based framework for describing human gut bacteria

Benjamin A Doran et al. bioRxiv. .

Abstract

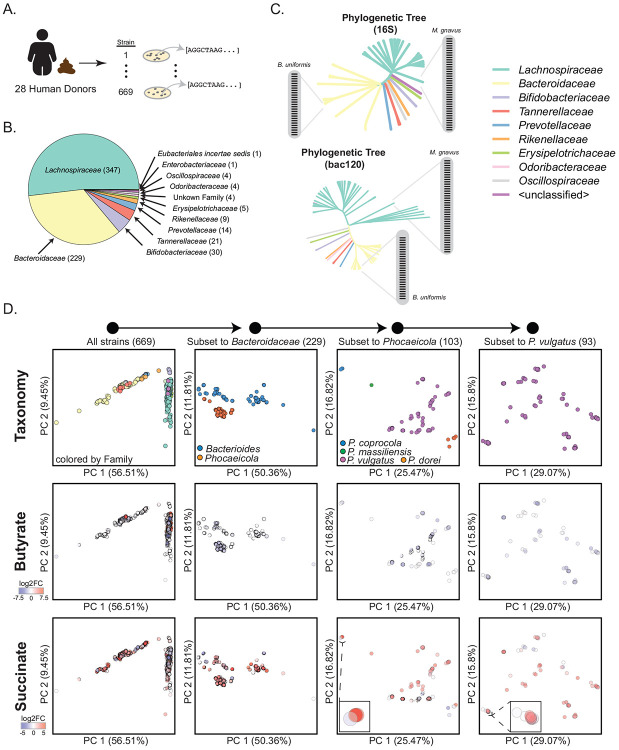
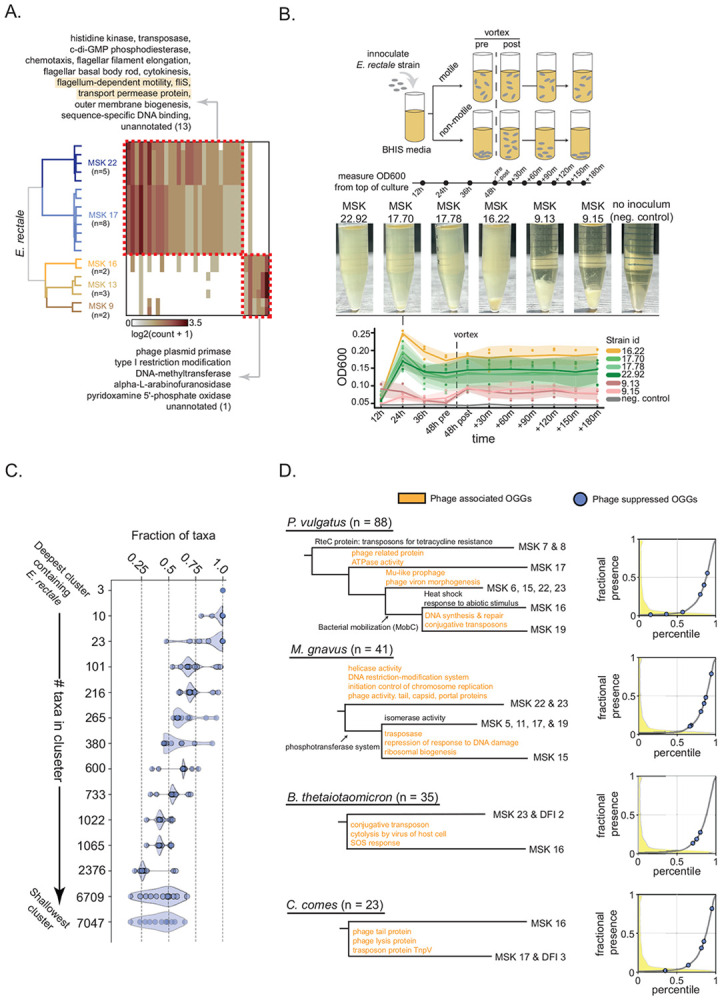
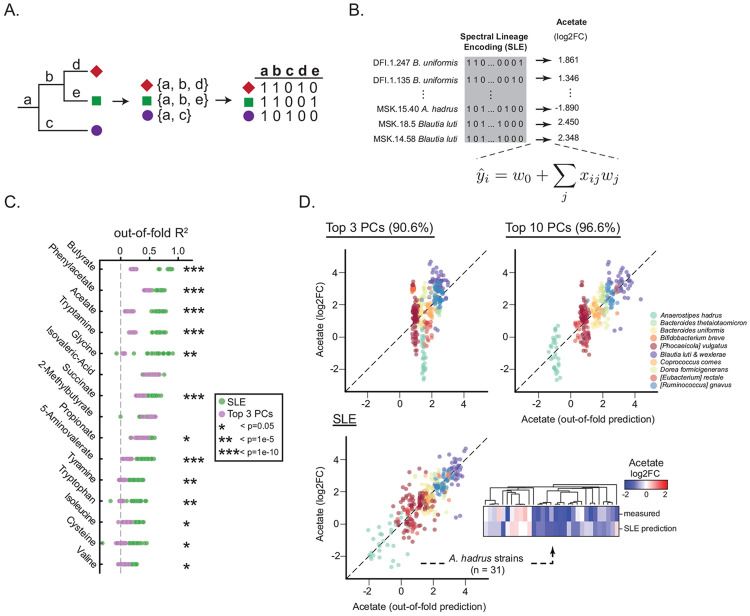
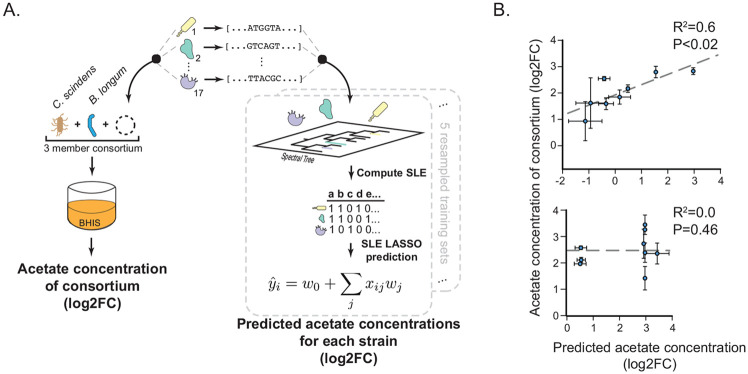
The human gut microbiome contains many bacterial strains of the same species ('strain-level variants'). Describing strains in a biologically meaningful way rather than purely taxonomically is an important goal but challenging due to the genetic complexity of strain-level variation. Here, we measured patterns of co-evolution across >7,000 strains spanning the bacterial tree-of-life. Using these patterns as a prior for studying hundreds of gut commensal strains that we isolated, sequenced, and metabolically profiled revealed widespread structure beneath the phylogenetic level of species. Defining strains by their co-evolutionary signatures enabled predicting their metabolic phenotypes and engineering consortia from strain genome content alone. Our findings demonstrate a biologically relevant organization to strain-level variation and motivate a new schema for describing bacterial strains based on their evolutionary history.


Figures

Fig. 1.
Fig. 1.. Establishing and characterizing a bank of commensal bacterial strains from the human gut.
(A) 669 gut commensal strains were isolated, cultured, and whole-genome sequenced from fecal samples of 28 healthy human donors. (B) Phylogenetic distribution of commensal strain bank; number of strains belonging to specific phylogenetic family in parenthesis. (C) Phylogenetic trees of commensal strain bank defined by either 16S rDNA sequence (upper panel) or set of 120 genes conserved across the bacterial tree-of-life (‘bac120’, lower panel). Insets show that both phylogenetic trees do not resolve strain-level variation amongst Mediterraneibacter gnavus or Bacteroides uniformis strains. (D) PCA plots of strains defined by orthologous gene groups (OGGs). Each dot in the PCA plots is a strain. From left to right, commensal strain bank is subset to strain-level variation amongst Phocaceicola vulgatus strains. The top row is colored by phylogeny, the middle and bottom rows are colored by relative changes in the concentrations of butyrate (middle) and succinate (bottom) for each strain.
Fig. 2.
Fig. 2.. The Spectral Tree reveals subspecies phylogeny.
(A) Workflow for projecting commensal strain bank into the Spectral Tree. (B) Distributions of relative distance between all pairs of strains in commensal strain bank belonging to either the same genus (bottom panel) or species (top panel). Relative distance is defined by either (i) the 16S phylogenetic tree (orange distribution), (ii) the bac120 phylogenetic tree (yellow distribution), or (iii) the Spectral Tree (blue distribution). Inset: distribution of relative distances for all strain pairs that are of the same species. (C) Following strains of M. gnavus (upper panel) and B. uniformis (lower panel) from shallow to deep branches of the Spectral Tree. Each leaf is a strain colored by the identity of the donor from which the strain was collected (see color key. MSK indicates donor from Memorial Sloan Kettering Hospital; DFI indicates donor from Duchossois Family Institute). (D) Information shared between phylogenetic designation (NCBI or GTDB database) or donor origin (color-key) and depth of strain cluster in Spectral Tree (x-axis). Tree depth at which 50% of cumulative information regarding shared donor identity is represented is delineated (brown).
Fig. 3.
Fig. 3.. Functional and evolutionary characterization of subspecies phylogeny.
(A) Clusters of E. rectale strains from the Spectral Tree. Branches are colored by strain cluster and are labeled by the donor from which they were isolated. Number in parenthesis below each donor is number of strains. Heatmap shows gene groups that are significantly differentially abundant between strains. Functional annotations of gene groups defining each cluster (red boxes) are shown in text. Highlighted annotations reflect gene groups shared amongst strains from MSK22, MSK17, and MSK16. (B) Evaluating motility of E. rectale strains derived from different donors. BHI media is inoculated with strains, grown for 48 hours, vortexed, then observed for 180 minutes. OD600 measurements are taken from the top of the culture. Pictures show cultures of six different strains—three from MSK22 and MSK17, three from MSK16 and MSK9—and a negative control of media alone after being grown for 24 hours. OD600 (y-axis) versus time for each strain in triplicate is shown. Solid lines are average OD600 value, contours are ± 1 standard deviation from average OD600 value. (C) The fraction of taxa (x-axis) containing the 12 annotated OGGs (circles) absent in MSK16, MSK13, and MSK9 out of all taxa within a given cluster in the Spectral Tree (y-axis). y-axis is ordered from the deepest cluster containing the reference E. rectale proteome (top) to the shallowest cluster (bottom). (D) Left panel; Spectral Tree for given species. Leaves are labeled by donors from which strains were collected; number of strains collected for each species indicated in parenthesis. Text along branches indicate functional annotation of significantly differentially abundant OGGs between daughter clusters. Orange text indicates annotations associated with phage presence; black text along daughter cluster indicates functional annotations of OGGs that are absent termed ‘Phage suppressed OGGs’. Right panel; all 10,117 OGGs are ordered by their percentile rank of fractional presence in the UniProt database (x-axis) and plotted against their fractional presence (y-axis) (grey distribution). The density of OGGs for a particular percentile rank is shown in the yellow distribution. Phage suppressed OGGs for each species are plotted along the grey distribution in blue circles.
Fig. 4.
Fig. 4.. Predicting metabolic traits of individual strains from the Spectral Tree.
(A) Workflow for defining Spectral Lineage Encodings (SLEs) for taxa. Taxa (red diamond, green square, purple circle) are labeled according to their unique branching path along the Spectral Tree and a table of SLEs is created with branches as features comprising the columns and taxa as rows. (B) Schematic for training a LASSO model on SLEs to predict acetate fold-change (FC) for strains. (C) Predictive capacity (out-of-fold R2, x-axis) of 20 SLE LASSO models (green circles) for 15 metabolites (y-axis) and 20 LASSO models trained on top three principal components (PCs) of strain co-evolution (purple circles). * indicates degree of statistically significant difference between predictive capacities of models (see key). (D) Out-of-fold prediction (x-axis) versus measured fold-change (y-axis) for acetate metabolism across all strains (see color key for species designation) for LASSO models trained on top three principal components (harboring 91% variance), top 10 principal components (harboring 97% variance), and SLEs. Inset shows predicted and measured fold-change of acetate for 31 Anaerostipes hadrus strains; strains are hierarchically clustered by fold-change measurement.
Fig. 5.
Fig. 5.. SLEs enable rationally engineering consortia from strain genomes.
(A) 17 new bacterial strains were isolated from fecal samples, whole genome sequenced, and added to a consortium of Clostridium scindens and Bifidobacterium longum. Consortia were grown and acetate concentrations were measured (left panel). Acetate concentrations for all 17 strains were predicted using SLE LASSO models (right panel). (B) Predicted relative acetate concentration for each of the 17 strains (x-axis) versus measured relative acetate concentration for cultured consortia (y-axis). Strains are grouped by whether the commensal strain bank contained a strain with a related genus (upper panel) or did not contain any strain with a related genus (lower panel).

References

    1. Sunagawa S., Acinas S. G., Bork P., Bowler C., Tara Oceans Coordinators, Eveillard D., Gorsky G., Guidi L., Iudicone D., Karsenti E., Lombard F., Ogata H., Pesant S., Sullivan M. B., Wincker P., de Vargas C., Tara Oceans: towards global ocean ecosystems biology. Nat. Rev. Microbiol. 18, 428–445 (2020). - PubMed
    1. Integrative HMP (iHMP) Research Network Consortium, The Integrative Human Microbiome Project. Nature. 569, 641–648 (2019). - PMC - PubMed
    1. Nayfach S., Roux S., Seshadri R., Udwary D., Varghese N., Schulz F., Wu D., Paez-Espino D., Chen I.-M., Huntemann M., Palaniappan K., Ladau J., Mukherjee S., Reddy T. B. K., Nielsen T., Kirton E., Faria J. P., Edirisinghe J. N., Henry C. S., Jungbluth S. P., Chivian D., Dehal P., Wood-Charlson E. M., Arkin A. P., Tringe S. G., Visel A., IMG/M Data Consortium, Woyke T., Mouncey N. J., Ivanova N. N., Kyrpides N. C., Eloe-Fadrosh E. A., A genomic catalog of Earth’s microbiomes. Nat. Biotechnol. 39, 499–509 (2021). - PMC - PubMed
    1. Compant S., Samad A., Faist H., Sessitsch A., A review on the plant microbiome: Ecology, functions, and emerging trends in microbial application. J. Advert. Res. 19, 29–37 (2019). - PMC - PubMed
    1. Yatsunenko T., Rey F. E., Manary M. J., Trehan I., Dominguez-Bello M. G., Contreras M., Magris M., Hidalgo G., Baldassano R. N., Anokhin A. P., Heath A. C., Warner B., Reeder J., Kuczynski J., Caporaso J. G., Lozupone C. A., Lauber C., Clemente J. C., Knights D., Knight R., Gordon J. I., Human gut microbiome viewed across age and geography. Nature. 486, 222–227 (2012). - PMC - PubMed

Publication types