[Preprint]. 2023 Dec 6:2023.12.06.570396.
doi: 10.1101/2023.12.06.570396.

A complex of the lipid transport ER proteins TMEM24 and C2CD2 with band 4.1 at cell-cell contacts

Affiliations

A complex of the lipid transport ER proteins TMEM24 and C2CD2 with band 4.1 at cell-cell contacts

Ben Johnson et al. bioRxiv. .

Update in

Abstract

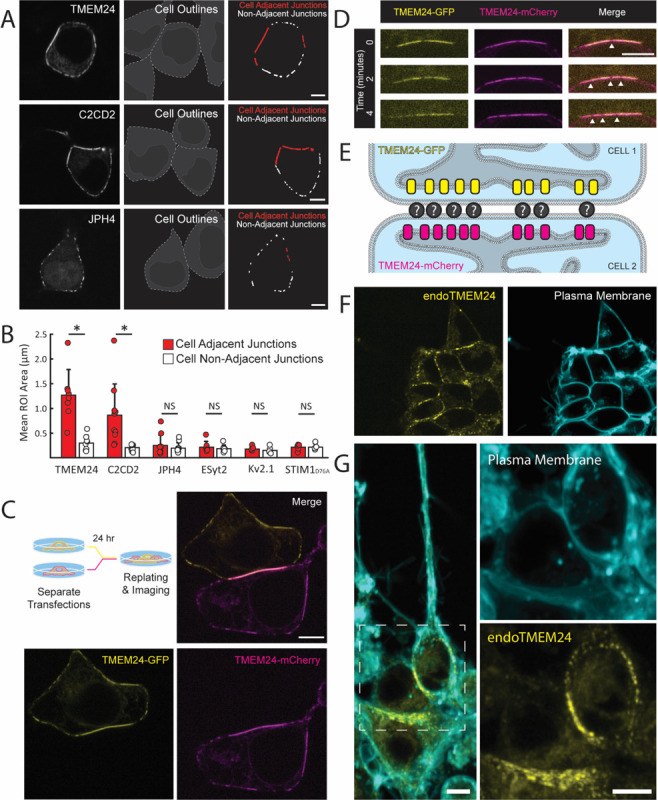
Junctions between the ER and the plasma membrane (ER/PM junctions) are implicated in calcium homeostasis, non-vesicular lipid transfer and other cellular functions. Two ER proteins that function both as membrane tethers to the PM via a polybasic motif in their C-terminus and as phospholipid transporters are brain-enriched TMEM24 (C2CD2L) and its paralog C2CD2. Based on an unbiased proximity ligation analysis, we found that both proteins can also form a complex with band 4.1 family members, which in turn can bind a variety of plasma membrane proteins including cell adhesion molecules such as SynCAM 1. This complex results in the enrichment of TMEM24 and C2CD2 containing ER/PM junctions at sites of cell contacts. Dynamic properties of TMEM24-dependent ER/PM contacts are impacted when in complex as TMEM24 present at cell adjacent junctions is not shed by calcium rise, unlike TMEM24 at non-cell adjacent junctions. These findings suggest that cell-contact interactions control ER/PM junctions via TMEM24 complexes involving band 4.1 proteins.


Figures

Figure 1.
Figure 1.. Large TMEM24-positive ER/PM junctions at cell-cell interfaces.
(A) Left, Spinning disk confocal images of TMEM24-mCherry, C2CD2-eGFP, and JPH4-eGFP in HEK293 cells. Center, cell silhouettes obtained by cell labeling with Tracker DiI or CellTracker Red. Right, ER/PM junctions from the left fields with cell-adjacent ER/PM junctions outlined in red. (B) Quantification of ER/PM junction sizes at cell adjacent and non-adjacent regions of the PM. Student’s t-test p-values of p = 0.0096 for TMEM24 and p = 0.01 for C2CD2. (C) and (D) Cells expressing TMEM24-eGFP and TMEM24-mCherry were co-plated as illustrated by the diagram. (C) TMEM24 expressed in adjacent cells forms symmetrical ER/PM junctions. (D) Gaps in the TMEM24 signal (indicated by arrowheads) in one cell are mirrored by gaps in the signal of the adjacent cell. (E) Diagram illustrating TMEM24 behavior in adjacent cells expressing TMEM24. (F) TMEM24 tagged with GFP at the endogenous locus in IMR32 cells localizes to the cell-cell interface. (G) Differentiated IMR32 cells with TMEM24 tagged at the endogenous locus also display a similar localization pattern. Plasma membrane labeled with CellBrite 650 dye in (F) and (G). Scale bars = 5 μm.
Figure 2.
Figure 2.. TMEM24-positive cell-adjacent junctions exhibit distinct characteristics.
(A) TMEM24-mCherry and JPH4-eGFP colocalize at ER/PM junctions that are non-cell adjacent (open arrowheads represent a few examples contained within the image) but JPH4 is excluded from TMEM24-induced cell-adjacent ER/PM junctions (solid arrowheads). Plasma membrane labeled with CellBrite 650. (B) Representative line scan of a cell membrane demonstrating fluorescence increases in both TMEM24 and JPH4 channels at ER/PM junctions with the exception of the cell-cell contact area where TMEM24 signal increases and JPH4 signal is lacking. (C) Images of TMEM24-mCherry cell adjacent and cell non-adjacent ER/PM junctions before and after addition of 10 μM Oxotremorine-M (OxoM). Junctions that are cell-adjacent and cell non-adjacent are indicated in lower panels. (D) TMEM24 response to treatment of 10 μM OxoM separated by cell-adjacent and cell non-adjacent TMEM24 fluorescence over time and normalized to an average pre-treatment fluorescence level. (E) Maximal average fluorescence change in TMEM24 signal at cell-adjacent and cell non-adjacent ER/PM junctions. Student’s t-test returned a value of p = 0.01. All images are from HEK293 cells and were acquired by confocal microscopy. Scale bars = 5 μm.
Figure 3.
Figure 3.. A β-sheet within the TMEM24 C-terminus is responsible for its targeting to cell-adjacent ER/PM junctions.
HEK293 cells. (A) TMEM24 domain architecture. TMR = transmembrane region; PBM = polybasic motif. (B) Fragment 1–414 is diffusely ER localized and does not localize to ER/PM junctions at any location. (C) Fragment 1–630 is localized at ER/PM junctions at sites of cell-cell contact (D) The TRAPγ-eGFP has a diffuse ER localization. (E) TRAPγ-(414–630)-eGFP hybrid construct localizes to ER/PM junctions at sites of cell-cell contact. (F) Alphafold predicted structure of a TMEM24 monomer in two different orientations. (G) Disruption of both the polybasic motif (accomplished via the 5S→E mutation) and the TMEM24 C-terminal β-sheet interferes with TMEM24’s ability to localize at any ER/PM junction. Plasma membranes were labeled with CellBrite 650. Scale bars = 5 μm.
Figure 4.
Figure 4.. APEX2 proximity biotinylation identifies TMEM24 protein neighbors.
(A) Schematic representations and confocal images of APEX2 conjugated proteins expressed in HEK293 cells and used in the APEX screen. After the APEX reaction cells were fixed, labeled with CF640R streptavidin to visualize biotinylated proteins and imaged via confocal microscopy. (B) Volcano plot of proteins identified via mass spectrometry after streptavidin-based purification. Significantly enriched proteins are found in the upper right quadrant indicated by cyan. Student t-test values for 4.1G, 4.1B, and 4.1R were found to be p = 0.024, p = 0.033, and p = 0.074, respectively. Scale bars = 5 μm
Figure 5.
Figure 5.. Band 4.1 Proteins bind TMEM24 via an interaction between TMEM24 β-sheet motif and Band 4.1 C-terminal domain.
(A) Diagram of Band 4.1 family proteins (a cell adhesion protein is indicated by a gray rectangle) and confocal images of the indicated proteins coexpressed in HEK293 cells showing their colocalization. High magnification of the boxed regions of the middle panels are shown at right. (B) Diagram of Band 4.1 construct lacking the CTD and confocal images of the corresponding construct co-expressed with TMEM24 in HEK293 cells, showing lack of colocalization of the two proteins. (C) Diagram of the Mem-mCherry-4.1G(CTD) construct and confocal images of the corresponding construct co-expressed with TMEM24 in HEK293 cells. The two proteins are colocalized at ER/PM junctions, but the strong accumulation of TMEM24 at sites of cell-cell contacts is no longer observed. The panel at right shows the location of a neighboring cells stained with CellBrite 650. (D) Alphafold multimer predicted interaction between the β-sheet of TMEM24 and the β-sheet contained in the 4.1G CTD. (E) Coexpression of JPH4-eGFP and mCherry-4.1G in HEK293 cells result in no colocalization. Scale bars = 5 μm
Figure 6.
Figure 6.. A TMEM24–4.1-SynCAM1 complex at sites of cell-cell contact.
(A) Confocal images of SynCAM1(363)-eGFP expressed in HEK293 cells. The upper panel is a slice at mid z level while the lower panel is shows the basal surface. (B) Coexpression of TMEM24-mCherry and SynCAM1(363)-eGFP in HEK293 cells. Images are of a mid-level z-slice (above) or the basal surface (below) of the cell. Plasma membrane labeled with CellBrite 650. (C) Coexpression of JPH4-mCherry and SynCAM1(563)-eGFP in HEK293 cells. The plasma membrane was labeled with CellBrite 650. (D) Expression of SynCAM1(363)-eGFP, mCherry-4.1G, and TMEM24-Halo labeled with JF646 HaloTag ligand in HEK293 cells. All three proteins colocalize at ER/PM junctions. (E) Model of the TMEM24–4.1-SynCAM 1 complex. Scale bars = 5 μm
Figure 7.
Figure 7.. TMEM24 localizes to neurons contact sites.
(A) Diagram of the coculturing system. (B) TMEM24-mCherry and SynCAM1(563)-eGFP expressed in HEK293 cells accumulate at contacts with axons of co-plated rat hippocampal neurons as revealed by anti-tau immunofluorescence. (C) Endogenous TMEM24 (endo-eGFP) in IMR32 cells accumulates at contacts with three neuronal processes when co-plated with rat hippocampal neurons expressing the PM marker mCherry-CAAX. Note that neurons are only sparsely transfected with mCherry-CAAX, so that at least some linear arrays of endo-eGFP spots not in register with mCherry-labeled axons may correspond to unlabeled axons. Scale bars = 5 μm

References

    1. Amos C., Xu P., and De Camilli P.. 2023. Erythroid differentiation dependent interaction of VPS13A with XK at the plasma membrane of K562 cells. Cold Spring Harbor Laboratory. - PMC - PubMed
    1. Baines A.J., Lu H.-C., and Bennett P.M.. 2014. The Protein 4.1 family: Hub proteins in animals for organizing membrane proteins. Biochimica et Biophysica Acta (BBA) - Biomembranes. 1838:605–619. - PubMed
    1. Balla T., Gulyas G., Kim Y.J., and Pemberton J.. 2020. Phosphoinositides and calcium signaling; a marriage arranged at ER-PM contact sites. Current Opinion in Physiology. 17:149–157. - PMC - PubMed
    1. Bharathan N.K., Giang W., Hoffman C.L., Aaron J.S., Khuon S., Chew T.-L., Preibisch S., Trautman E.T., Heinrich L., Bogovic J., Bennett D., Ackerman D., Park W., Petruncio A., Weigel A.V., Saalfeld S., Wayne Vogl A., Stahley S.N., and Kowalczyk A.P.. 2023. Architecture and dynamics of a desmosome–endoplasmic reticulum complex. Nature Cell Biology. 25:823–835. - PMC - PubMed
    1. Biederer T., Sara Y., Mozhayeva M., Atasoy D., Liu X., Kavalali E.T., and Südhof T.C.. 2002. SynCAM, a Synaptic Adhesion Molecule That Drives Synapse Assembly. Science. 297:1525–1531. - PubMed

Publication types