[Preprint]. 2023 Dec 7:2023.12.06.570473.
doi: 10.1101/2023.12.06.570473.

ProteinNPT: Improving Protein Property Prediction and Design with Non-Parametric Transformers

Affiliations

ProteinNPT: Improving Protein Property Prediction and Design with Non-Parametric Transformers

Pascal Notin et al. bioRxiv. .

Abstract

Protein design holds immense potential for optimizing naturally occurring proteins, with broad applications in drug discovery, material design, and sustainability. However, computational methods for protein engineering are confronted with significant challenges, such as an expansive design space, sparse functional regions, and a scarcity of available labels. These issues are further exacerbated in practice by the fact most real-life design scenarios necessitate the simultaneous optimization of multiple properties. In this work, we introduce ProteinNPT, a non-parametric transformer variant tailored to protein sequences and particularly suited to label-scarce and multi-task learning settings. We first focus on the supervised fitness prediction setting and develop several cross-validation schemes which support robust performance assessment. We subsequently reimplement prior top-performing baselines, introduce several extensions of these baselines by integrating diverse branches of the protein engineering literature, and demonstrate that ProteinNPT consistently outperforms all of them across a diverse set of protein property prediction tasks. Finally, we demonstrate the value of our approach for iterative protein design across extensive in silico Bayesian optimization and conditional sampling experiments.


Figures
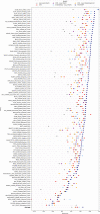
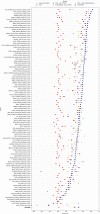
Figure 6:
Figure 6:. Single mutants fitness prediction - Random cross-validation scheme
We report the DMS-level performance (measured by the Spearman’s rank correlation ρ between model scores and experimental measurements) of ProteinNPT and other baselines listed in Appendix D.1.
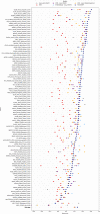
Figure 7:
Figure 7:. Single mutants fitness prediction - Modulo cross-validation scheme
We report the DMS-level performance (measured by the Spearman’s rank correlation ρ between model scores and experimental measurements) of ProteinNPT and other baselines listed in Appendix D.1.
Figure 8:
Figure 8:. Single mutants fitness prediction - Contiguous cross-validation scheme
We report the DMS-level performance (measured by the Spearman’s rank correlation ρ between model scores and experimental measurements) of ProteinNPT and other baselines listed in Appendix D.1.
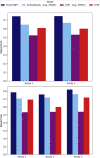
Figure 9:
Figure 9:. Multiple target prediction
Avg. Spearman’s rank correlation between model predictions and experimental measurements, for proteins with 2 or 3 distinct experimental measurements predicted simultaneously (respectively top and bottom plots).
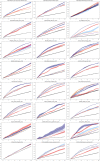
Figure 10:
Figure 10:. Uncertainty calibration curves for each cross-validation scheme.
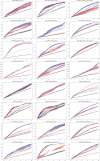
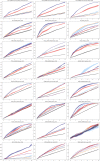
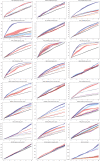
Uncertainty calibration curves plot a performance metric of interest, here MSE (y-axis), as a function of the proportion of points set aside based on their uncertainty (x-axis) (from right to left, we set aside an increasing fraction of the most uncertain points). To be properly calibrated, an uncertainty quantification metric should monotonically improve as we set aside an increasing proportion of the most uncertain points. We experiment with three different uncertainty quantification schemes: MC dropout, Batch resampling, and a hybrid scheme. For a fixed compute budget, the hybrid scheme delivers optimal performance across our three cross-validation schemes.
Figure 11:
Figure 11:. DMS-level performance for iterative protein redesign experiments (Assays 1–24).
We plot the recall rate of high fitness points (top 3 deciles) as the function of the number of batch acquisition cycles. The shaded regions represent the standard errors of each method.
Figure 12:
Figure 12:. DMS-level performance for iterative protein redesign experiments (Assays 25–48).
We plot the recall rate of high fitness points (top 3 deciles) as the function of the number of batch acquisition cycles. The shaded regions represent the standard errors of each method.
Figure 13:
Figure 13:. DMS-level performance for iterative protein redesign experiments (Assays 49–72).
We plot the recall rate of high fitness points (top 3 deciles) as the function of the number of batch acquisition cycles. The shaded regions represent the standard errors of each method.
Figure 14:
Figure 14:. DMS-level performance for iterative protein redesign experiments (Assays 73–96).
We plot the recall rate of high fitness points (top 3 deciles) as the function of the number of batch acquisition cycles. The shaded regions represent the standard errors of each method.
Figure 15:
Figure 15:. DMS-level performance for iterative protein redesign experiments (Assays 97–100).
We plot the recall rate of high fitness points (top 3 deciles) as the function of the number of batch acquisition cycles. The shaded regions represent the standard errors of each method.
Figure 1:
Figure 1:. ProteinNPT architecture.
(Left) The model takes as input the primary structure of a batch of proteins of length Lseq along with the corresponding Lt labels and, optionally, La auxiliary labels (for simplicity we consider Lt=La=1 here). Each input is embedded separately, then all resulting embeddings are concatenated into a single tensor. Several ProteinNPT layers are subsequently applied to learn a representation of the entire batch, which is ultimately used to predict both masked tokens and targets (depicted by question marks). (Right) A ProteinNPT layer alternates between tied row and column attention to learn rich embeddings of the labeled batch.
Figure 2:
Figure 2:. Multiples mutants performance.
(Left) Spearman’s rank correlation between model predictions and experimental measurements, for each assay in ProteinGym with multiple mutants (see Appendix A.1). (Right) Average Spearman’s rank correlation, overall and by mutational depth.
Figure 3:
Figure 3:. In silico protein redesign.
(Left) Iterative redesign algorithm (Right) Recall rate of high fitness points (top 3 deciles) vs acquisition cycle, averaged across all DMS assays in ProteinGym.
Figure 4:
Figure 4:. Conditional sampling.
ProteinNPT is used to sample novel sequences for the GFP protein conditioned on high fitness values, leading to sequences with high predicted fitness relative to controls.
Figure 5:
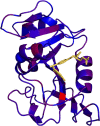
Figure 5:. Row-wise attention map.
Row-wise attention between residues & fitness, mapped on the DHFR enzyme structure. The high intensity residue (red) corresponds to a substrate binding site.

References

    1. Arnold Frances H.. Directed Evolution: Bringing New Chemistry to Life. Angewandte Chemie International Edition, 57(16):4143–4148, 2018. ISSN 1521–3773. doi: 10.1002/anie.201708408. URL https://onlinelibrary.wiley.com/doi/abs/10.1002/anie.201708408._eprint: https://onlinelibrary.wiley.com/doi/pdf/10.1002/anie.201708408. - DOI - DOI - DOI - PMC - PubMed
    1. Huang Po-Ssu, Boyken Scott E., and Baker David. The coming of age of de novo protein design. Nature, 537(7620):320–327, September 2016. ISSN 1476–4687. doi: 10.1038/nature19946. URL https://www.nature.com/articles/nature19946. Number: 7620 Publisher: Nature Publishing Group. - DOI - PubMed
    1. Romero Philip A., Krause Andreas, and Arnold Frances H.. Navigating the protein fitness landscape with Gaussian processes. Proceedings of the National Academy of Sciences, 110(3):E193–E201, January 2013. doi: 10.1073/pnas.1215251110. URL https://www.pnas.org/doi/10.1073/pnas.1215251110. Publisher: Proceedings of the National Academy of Sciences. - DOI - DOI - PMC - PubMed
    1. Biswas Surojit, Khimulya Grigory, Alley Ethan C., Esvelt Kevin M., and Church George M.. Low-N protein engineering with data-efficient deep learning. Nature Methods, 18(4):389–396, April 2021a. ISSN 1548–7091, 1548–7105. doi: 10.1038/s41592-021-01100-y. URL http://www.nature.com/articles/s41592-021-01100-y. - DOI - PubMed
    1. Dougherty Michael J and Arnold Frances H. Directed evolution: new parts and optimized function. Current Opinion in Biotechnology, 20(4):486–491, August 2009. ISSN 0958–1669. doi: 10.1016/j.copbio.2009.08.005. URL https://www.sciencedirect.com/science/article/pii/S0958166909000986. - DOI - PMC - PubMed

Publication types