[Preprint]. 2024 Apr 8:2023.12.05.569919.
doi: 10.1101/2023.12.05.569919.

Dystrophin deficiency impairs cell junction formation during embryonic myogenesis

Affiliations

Dystrophin deficiency impairs cell junction formation during embryonic myogenesis

Elise Mozin et al. bioRxiv. .

Update in

Abstract

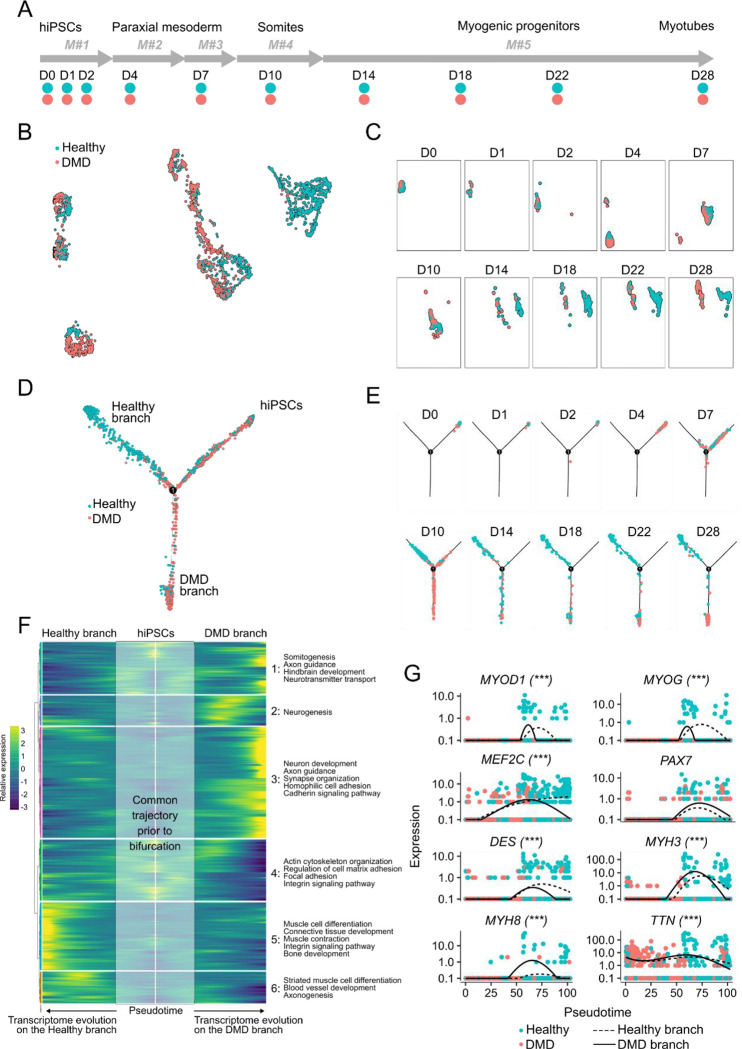
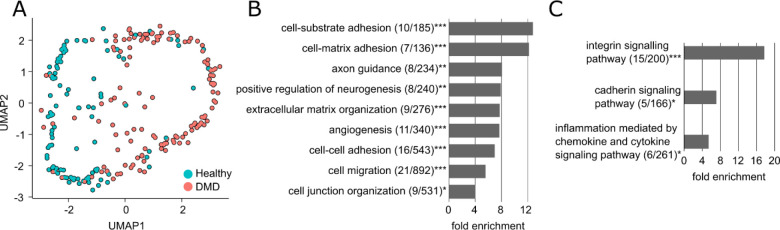
Mutations in the DMD gene lead to Duchenne muscular dystrophy, a severe X-linked neuromuscular disorder that manifests itself as young boys acquire motor functions. DMD is typically diagnosed at 2 to 4 years of age, but the absence of dystrophin negatively impacts muscle structure and function before overt symptoms appear in patients, which poses a serious challenge in the optimization of standards of care. In this report, we investigated the early consequences of dystrophin deficiency during skeletal muscle development. We used single-cell transcriptome profiling to characterize the myogenic trajectory of human pluripotent stem cells and showed that DMD cells bifurcate to an alternative branch when they reach the somite stage. Here, dystrophin deficiency was linked to marked dysregulations of cell junction protein families involved in the cell state transitions characteristic of embryonic somitogenesis. Altogether, this work demonstrates that in vitro, dystrophin deficiency has deleterious effects on cell-cell communication during myogenic development, which should be considered in future therapeutic strategies for DMD.

Keywords: DMD; Duchenne muscular dystrophy; cell junctions; hiPSCs; myogenesis; somite.


Conflict of interest statement

Declaration of interests The authors declare no competing interests

Figures

Figure 1:
Figure 1:
Myogenic differentiation of DMD and healthy control hiPSCs at the single-cell resolution. (A) Cell collection timeline along hiPSC myogenic differentiation using the combination of 5 defined media (M#1 to M#5) described previously. D0 to D28: Day 0 to Day 28. (B) UMAP plot showing the 1917 individual cells colored by hiPSC line of origin. (C) Deconvolution of the UMAP plot by collection time point (D0 to D28). (D) Single-cell trajectory capturing the dynamics of myogenic differentiation as DMD and Healthy hiPSCs progress along the initial common branch (hiPSCs) to the bifurcation point (1) and one of the two alternative branches. (E) Deconvolution of the single-cell trajectory by collection time point (D0 to D28). (F) Branched expression analysis modeling identifying modules of genes with branch-dependent expression. Key Gene Ontology terms associated with each individual module are indicated on the right-hand side. (G) Gene expression kinetic in pseudotime for myogenic markers along the Healthy (dotted line) and the DMD (full line) branch. Each dot shows an individual cell with its computed pseudotime value. Significant differences in branch-dependent expression are indicated with *** (p-adj < 0.001).
Figure 2:
Figure 2:
DMD cells exhibit a marked dysregulation of cell junction genes at Day 10. (A) UMAP plot of the individual cells collected at Day 10 from the sci-RNA-Seq data set (Figure 1) colored by their hiPSC line of origin. (B-C) Gene Ontology (B) and Pathway enrichment (C) analyses performed with the 94 genes differentially expressed in DMD cells at Day 10 in the sci-RNA-Seq data set. Legend: * false discovery rate (FDR) < 0.05; ** FDR < 0.01; *** FDR < 0.001; (X/Y): number of genes from the GO category found differentially expressed in the dataset / total number of genes in the GO category.
Figure 3:
Figure 3:
Dystrophin deficiency does not compromise myotube formation despite upstream dysregulation of multiple cell junction protein families. (A) Fluorescent staining of myosin heavy chains and a-actinin (red) in myotubes derived from Healthy hiPSCs. Arrowheads indicate multinucleation and the right panel focuses on a striation pattern. (B) Quantification of the α-actinin fluorescent area in the three cell lines, expressed as a percentage of total area (n = 3 to 5 panels by cell line). (C) UMAP plot showing the 3566 individual cells colored by their hiPSC line of origin. (D) Violin plots showing the expression of somite marker genes in single cells from Healthy, CRISPR and DMD hiPSCs at Day 10. (E) Venn diagram of the differentially expressed genes in DMD and CRISPR hiPSC lines at Day 10. The absolute numbers of genes are indicated in the appropriate sections. (F) Gene ontology analysis with the 1885 genes differentially expressed in both the DMD and the CRISPR hiPSC lines at Day 10, showing a selection of significantly enriched biological processes. Legend: * false discovery rate (FDR) < 0.05; ** FDR < 0.01; *** FDR < 0.001; (X/Y): number of genes from the GO category found differentially expressed in the dataset / total number of genes in the GO category. (G-H) Differential expression of cell junction genes and potential implications at the protein level in the DMD (G) and CRISPR (H) hiPSC lines. Fold change estimates from single-cell data are indicated between brackets and color-coded for each protein. CLDN: claudin; OCLN: occludin; TJP: tight junction protein; CDH: cadherin; CTNN: contactin; PCDH: protocadherin; DSG: desmoglein; DSP: desmoplakin; DSC: desmocollin; PKP: plakophilin; JUP: plakoglobin; PERP: p53 apoptosis effector related to PMP22.
Figure 4:
Figure 4:
Dystrophin deficiency leads to impaired cell state transitions during in vitro somite development. (A) Optical microscopy with phase contrast of somite progenitors derived from hiPSCs. Insets highlight the “epithelial-like” (Epi) and “mesenchymal-like” (Mes) cell populations. Scale bar = 200μm. (B) Detection of E-Cad and Vim in somite progenitors derived from hiPSCs by immunofluorescence and confocal microscopy. (C) Quantification of the percentage of E-Cad-positive cells in the Healthy, DMD and CRISPR hiPSC lines at Day 10 in three replicate experiments (N = 10 panels by experiment). n.s. not significant; *** p-value < 0.001. (D) Detection of C-Met in the three hiPSC lines by immunostaining and confocal microscopy at differentiation Day 10. (E) Quantification of the C-Met fluorescent area normalized by the number of nuclei. Imaging was performed on four large mosaic panels per cell line.
Figure 5:
Figure 5:
DMD-specific defects in somitogenesis and cell junction gene dysregulations are independent of the genetic background. (A) Fluorescent staining of C-Met in DMD hiPSCs and healthy control lines at Day 10 of the myogenic differentiation. One representative picture is shown per individual line (Healthy_1 to 3 and DMD_1 to 3). (B) Quantification of the C-Met fluorescent area normalized by the number of nuclei. Imaging was performed on three independent pictures per line and the data shows the median value for each line. (C) Volcano plot of the differentially expressed genes in DMD somite progenitor cells at Day 10 (thresholds: |log2 FC| > 1 & p-adj < 0.01). (D) Gene Ontology analysis using the differentially expressed genes as input and showing key biological processes. Legend: * false discovery rate (FDR) < 0.05; ** FDR < 0.01; *** FDR < 0.001; (X/Y): number of genes from the GO category found differentially expressed in the dataset / total number of genes in the GO category. (E) Differential expression of cell junction genes and potential implications at the protein level. Fold change values (DMD vs. Healthy) are indicated between brackets and color-coded for each protein. CLDN: claudin; OCLN: occludin; TJP: tight junction protein; CDH: cadherin; CTNN: contactin; PCDH: protocadherin; DSG: desmoglein; DSP: desmoplakin; DSC: desmocollin; PKP: plakophilin; JUP: plakoglobin; PERP: p53 apoptosis effector related to PMP22. (F) Representative scratch wound assay in Healthy and DMD cells at Day 10 (T0). Recolonization of the wound area is shown by the reduction of the blue/red area. (G) Monitoring of the relative wound density (RWD) over time in the 3 DMD and 3 Healthy control lines. (H) For each line, the time to reach an RWD of 50% (RWD T50) was determined and averaged from 2 × 8 wells in 2 independent experiments.
Figure 6:
Figure 6:
Working model of dysregulated somite development in DMD embryos. The top panel shows the successive steps of somitogenesis from the paraxial mesoderm in a healthy context, including the migration of myogenic progenitors colonizing the fetal muscle territories. In the bottom panel, the defective epithelialization and the aberrant migration phenotypes are highlighted in DMD somites, giving rise to fetal muscles with disease phenotypes, as previously published,.

References

    1. Bushby K., Finkel R., Birnkrant D.J., Case L.E., Clemens P.R., Cripe L., Kaul A., Kinnett K., McDonald C., Pandya S., et al. (2010). Diagnosis and management of Duchenne muscular dystrophy, part 1: diagnosis, and pharmacological and psychosocial management. Lancet Neurol 9, 77–93. 10.1016/S1474-4422(09)70271-6. - DOI - PubMed
    1. Wang C.H., Bonnemann C.G., Rutkowski A., Sejersen T., Bellini J., Battista V., Florence J.M., Schara U., Schuler P.M., Wahbi K., et al. (2010). Consensus statement on standard of care for congenital muscular dystrophies. J. Child Neurol. 25, 1559–1581. 10.1177/0883073810381924. - DOI - PMC - PubMed
    1. Wang C.H., Dowling J.J., North K., Schroth M.K., Sejersen T., Shapiro F., Bellini J., Weiss H., Guillet M., Amburgey K., et al. (2012). Consensus statement on standard of care for congenital myopathies. J. Child Neurol. 27, 363–382. 10.1177/0883073812436605. - DOI - PMC - PubMed
    1. Duan D., Goemans N., Takeda S., Mercuri E., and Aartsma-Rus A. (2021). Duchenne muscular dystrophy. Nat Rev Dis Primers 7, 1–19. 10.1038/s41572-021-00248-3. - DOI - PMC - PubMed
    1. Nguyen F., Cherel Y., Guigand L., Goubault-Leroux I., and Wyers M. (2002). Muscle lesions associated with dystrophin deficiency in neonatal golden retriever puppies. J. Comp. Pathol. 126, 100–108. 10.1053/jcpa.2001.0526. - DOI - PubMed

Publication types