[Preprint]. 2023 Dec 9:2023.12.08.569638.
doi: 10.1101/2023.12.08.569638.

Somatic mutation as an explanation for epigenetic aging

Affiliations

Somatic mutation as an explanation for epigenetic aging

Zane Koch et al. bioRxiv. .

Update in

Abstract

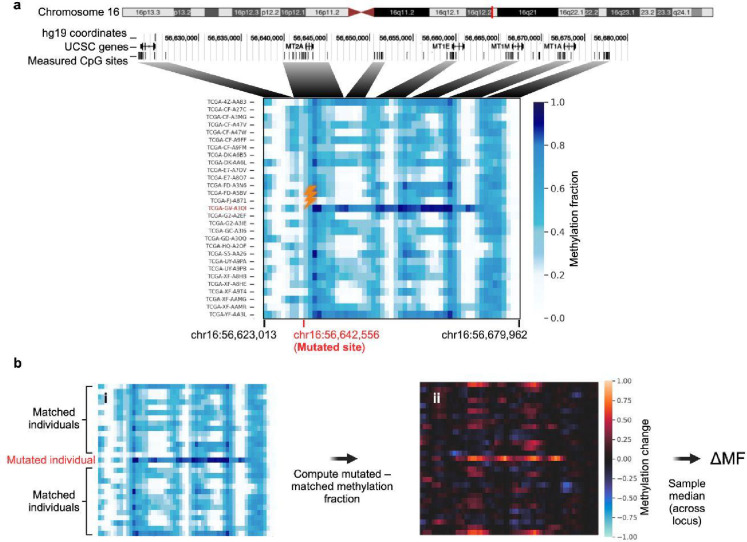
DNA methylation marks have recently been used to build models known as "epigenetic clocks" which predict calendar age. As methylation of cytosine promotes C-to-T mutations, we hypothesized that the methylation changes observed with age should reflect the accrual of somatic mutations, and the two should yield analogous aging estimates. In analysis of multimodal data from 9,331 human individuals, we find that CpG mutations indeed coincide with changes in methylation, not only at the mutated site but also with pervasive remodeling of the methylome out to ±10 kilobases. This one-to-many mapping enables mutation-based predictions of age that agree with epigenetic clocks, including which individuals are aging faster or slower than expected. Moreover, genomic loci where mutations accumulate with age also tend to have methylation patterns that are especially predictive of age. These results suggest a close coupling between the accumulation of sporadic somatic mutations and the widespread changes in methylation observed over the course of life.


Conflict of interest statement

Declaration of Interests T.I. is a cofounder of Serinus and Data4Cure, is on their Scientific Advisory Boards, and has equity interest in both companies. T.I. is on the Scientific Advisory Board of Ideaya BioSciences and has an equity interest. The terms of these arrangements have been reviewed and approved by the University of California San Diego, in accordance with its conflict of interest policies.

Figures

Figure 1:
Figure 1:. Links among CpG mutations, methylome remodeling, and aging
a) Various mutational processes affect the genome. Here, we show that some of these mutations associate with an aberrant DNA methylation pattern at both the mutated site and at numerous neighboring CpGs. b) An individual’s DNA mutation profile and DNA methylation profile make similar predictions of both their calendar age and rate of aging.
Figure 2:
Figure 2:. Frequency and methylation status of CpG mutation events
a) Percent of genome-wide somatic mutations that are classified as CpG (n = 467,079 mutations) or non-CpG mutations (n = 2,990,796 mutations). Expected percentages are calculated supposing mutation probability to be uniform across the genome (Methods). b) Diagram showing two categories of CpG sites: those where no individual is mutated (non-mutated CpG site, gray) and those where a mutation has occurred in at least one individual (mutated CpG site, red) and remaining individuals are non-mutated (blue). c) Distribution of CpG methylation values for the categories of CpG sites from (b). The methylation fractions of mutated individuals (red) and non-mutated individuals (blue) are shown for the 1,000 CpG sites with the highest mutated allele frequency (corresponding to MAF > 0.53, Methods). d) Methylation change between mutated and non-mutated individuals at (n = 8,037) mutated CpG sites. Methylation change is the difference between the median methylation fraction in mutated individuals and the median methylation fraction in non-mutated individuals of matched age and tissue. CpG sites are binned into five groups based on MAF, with violin plots summarizing the distribution of methylation changes within each group. Vertical bars inside each violin represent the interquartile range.
Figure 3:
Figure 3:. Association of mutations with regional methylation patterns
a) Example mutated site where the individual TCGA-GV-A3QI has a C>T mutation at chr16:56,642,556 of the hg19 human genome. Upper: Ideogram of chromosome 16, with a red bar indicating the location of the mutated site. The first underlying track shows hg19 base pair coordinates, the second the documented genes in the region, encoding five Metallothionein (MT) factors, and the third the locations of CpG sites measured on the Illumina 450k methylation array (vertical bars). Lower: Heatmap of CpG methylation fractions. Rows are samples (1 mutated, 28 background), and columns are the measured CpGs within a ±50 kb window proximal to the mutation (n = 62 CpG sites). The color corresponds to the methylation fraction of each CpG. The mutated sample row and mutated site column are labeled in red, with the mutation event indicated by a lightning bolt. b) Calculation of change in methylation fraction, or ΔMF, with reference to a specific mutated site. i) Heatmap of methylation fractions of the mutated site and CpGs in the surrounding window, replicated from panel (a). ii) Heatmap of corresponding differences in methylation between each sample (row) and all other samples in the matrix (median of other rows), computed separately for each site in the window (columns). The final ΔMF value was calculated as the overall methylation change of the mutated sample, taking the median across all sites in the window (Methods).
Figure 4:
Figure 4:. Magnitude and extent of methylation changes near somatic mutations
a) Probability distribution of ΔMF values calculated in a ±10 kb window surrounding mutated (red) versus random control (blue) sites. Mutated sites include n = 2,600 mutated sites with MAF ≥0.8, ≥15 matched individuals (individuals of same tissue type within ±5 years of age), and ≥1 measured CpG within the window. Random control sites include n = 260,000 non-mutated sites (Methods). P value shown for a two-sided Mann-Whitney test for a difference in median absolute deviation (MAD) of ΔMF between the mutated and non-mutated random control loci. b) Line plot depicting the fold enrichment for mutated over non-mutated sites as a function of ΔMF. Fold enrichment is the ratio of the probability of observing a given ΔMF for mutated sites versus the probability of that ΔMF for non-mutated control sites. ΔMF divided into equally spaced bins from −0.4 to 0.4. c) Line plot depicting ΔMF as a function of genomic distance from the site of mutation. For the 25% of mutated sites with the most positive (top, n = 650) or negative (bottom, n = 650) ΔMF values from (a), the ΔMF value in overlapping 2 kb windows at each distance from the mutation is plotted for mutated sites (red) versus random control sites (blue). The shaded region indicates the 40th-60th percentiles at that same distance. d) Enrichment of extreme ΔMF values at CpG sites and CpG islands. Top versus bottom barcharts show the 25% of mutations with the most positive versus most negative ΔMF values in panel (a) (n = 650 mutations each). The enrichment of these mutations (bars, y axis) is considered for different types of sites, depending on whether the site is a CpG and/or falls within a CpG island (x-axis categories). Enrichment is compared to the genomic baseline (Methods), with significance determined by a one-sided binomial test. Significant enrichment (p ≤ 0.001) is marked with (***), and non-significant (p > 0.01) is marked with (n.s.). CpG Islands are defined as genomic regions ≥ 200 bp, ≥ 50% GC content, and a high CpG occurrence. e) Boxplot of the absolute ΔMF value as a function of the mutated allele fraction (MAF). Includes all mutated sites with ≥15 matched samples (samples of the same tissue type within ± 5 years of age) and ≥1 measured CpG within ±10 kb (n = 3,880 mutated loci). Two-sided p value calculated based on the exact distribution of Pearson’s r modeled as a beta function.
Figure 5:
Figure 5:. Association between mutation age, methylation age, and chronological age
a) Methylation clock: the methylation fractions of CpGs are used in a gradient boosted tree model to predict chronological age. Mutation clock: the count of mutations around the same CpGs is used in an identical model to predict chronological age. Both models incorporate similar covariates (Methods). b) Scatter plot of human individuals, showing age predictions from the mutation model versus their chronological age. Includes 1,250 individuals from five tissues (Methods). c) Similar to panel (b) but showing age predictions from the methylation rather than mutation model. d) Violin plots of the methylation age residual versus mutation age residual. The residual in each case is the predicted age minus chronological age. Plot includes the same individuals as in panels (b,c). Pearson r refers to the correlation between methylation age and mutation age, controlling for chronological age (i.e., partial correlation, p = 6.14 10−124). e) Distribution of methylation age residuals for the same individuals as in panels (b,c), computed according to each of four previous methylation clocks. “This study” refers to the methylation clock shown in panel (c) (Methods). For each clock, the 20% (n = 250) of individuals with the youngest mutation age for their chronological age are shown in lighter color (low mutation – chronological age), and the 20% (n = 250) of individuals with the oldest mutation age for their chronological age are shown in darker color (high mutation – chronological age). (***) indicates a significant (p ≤ 10−10) difference in distribution between the low and high mutation residual age groups, based on a two-sided Mann–Whitney U test. f) Barplot depicting the ratio of observed to expected overlap between sets of age-associated CpG sites. The CpGs with maximal (top 1%, 5%, and 10%) mutual information between local mutation burden (±10 kb) and age or between methylation fraction and age were chosen. The intersection (overlap) between age-associated mutation burden and age-associated methylation sets was compared to the expected intersection assuming random selection (Methods). Significant enrichment (p ≤ 10−10) is marked with (***). g) Mutation burden (y-axis left) or methylation fraction (y-axis right) is plotted versus chronological age (x-axis) for CpG site cg19236454. Data from brain (LGG) samples, considering individuals with a nonzero mutation burden (±10 kb) at this site (n = 67). Pearson correlation with chronological age: mutation burden = 0.18, methylatio n = −0.18. Error bars denote standard error. h) Diagram summarizing the relationships between three measures of age: mutation, methylation, and chronological time. Variance explained is calculated as the squared Pearson correlation between each pair of measures for the same individuals as in panels (b,c).

References

    1. Szilard L. ON THE NATURE OF THE AGING PROCESS. Proc. Natl. Acad. Sci. U. S. A. 45, 30–45 (1959). - PMC - PubMed
    1. Failla G. The aging process and cancerogenesis. Ann. N. Y. Acad. Sci. 71, 1124–1140 (1958). - PubMed
    1. Wolf A. M. The tumor suppression theory of aging. Mech. Ageing Dev. 200, 111583 (2021). - PubMed
    1. Cagan A. et al. Somatic mutation rates scale with lifespan across mammals. Nature 604, 517–524 (2022). - PMC - PubMed
    1. Schumacher B., Pothof J., Vijg J. & Hoeijmakers J. H. J. The central role of DNA damage in the ageing process. Nature 592, 695–703 (2021). - PMC - PubMed

Publication types