[Preprint]. 2023 Dec 6:2023.12.05.570116.
doi: 10.1101/2023.12.05.570116.

Conserved autism-associated genes tune social feeding behavior in C. elegans

Affiliations

Conserved autism-associated genes tune social feeding behavior in C. elegans

Mara H Cowen et al. bioRxiv. .

Update in

Abstract

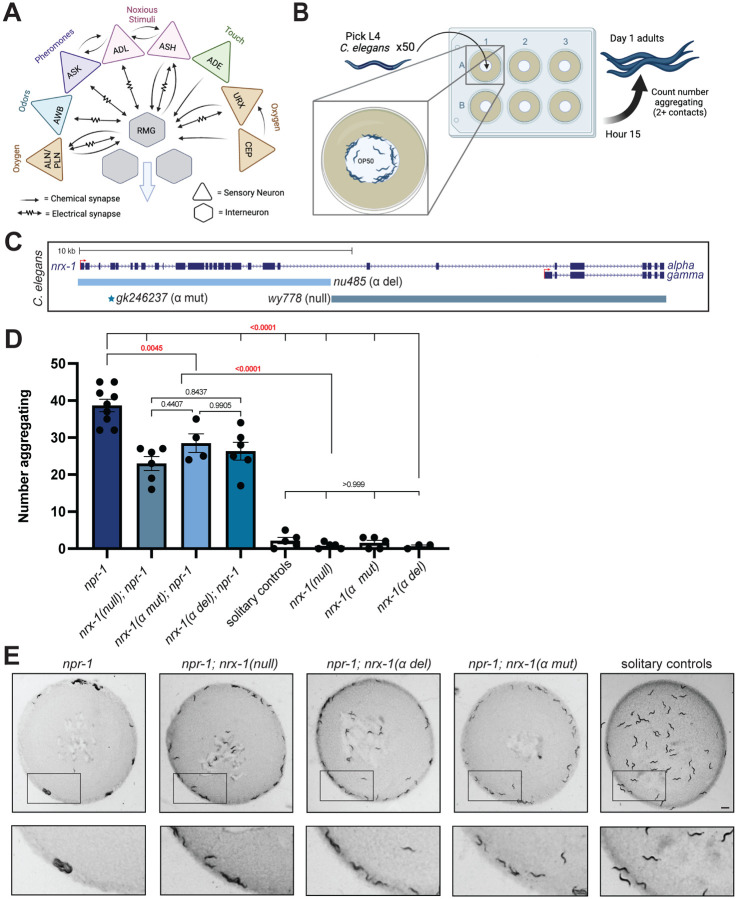
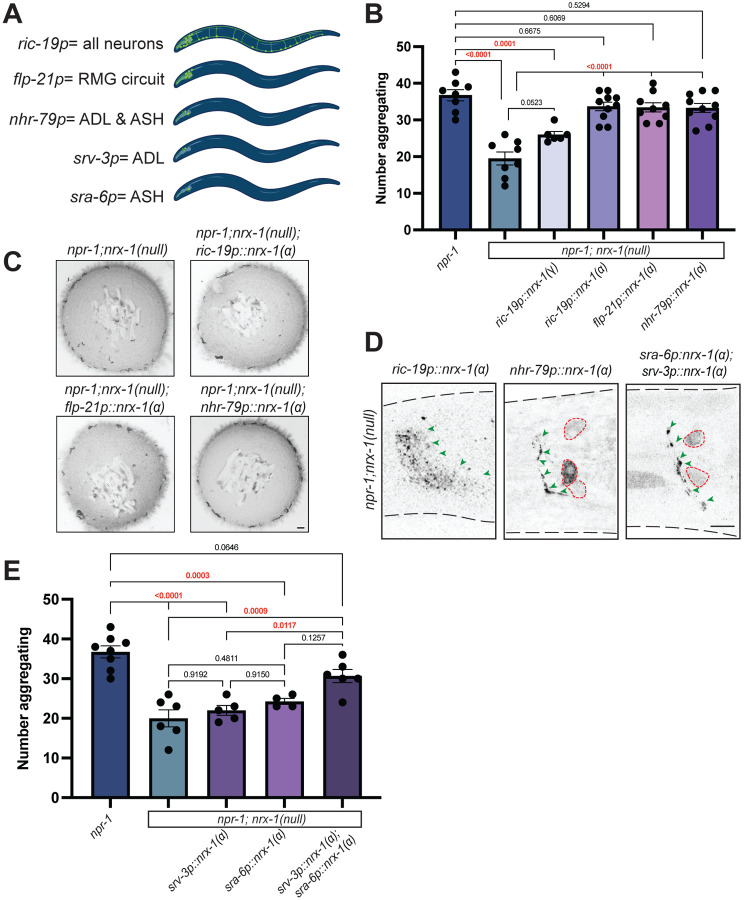
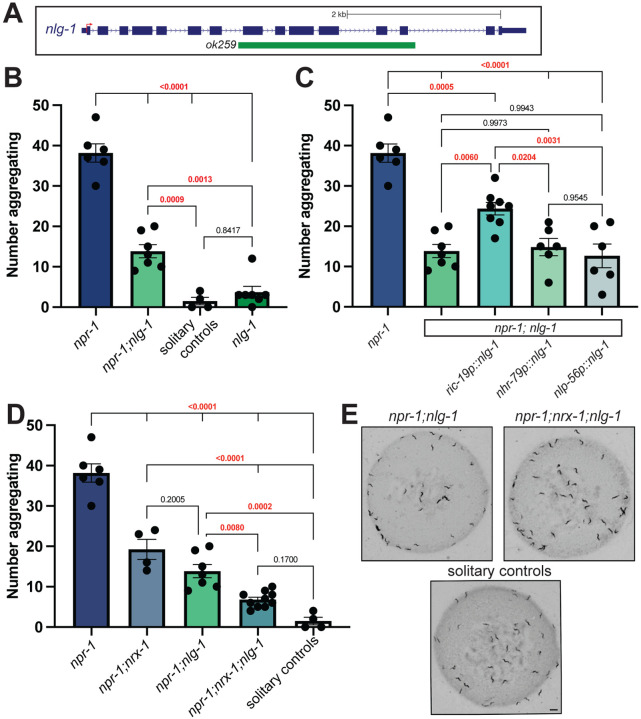
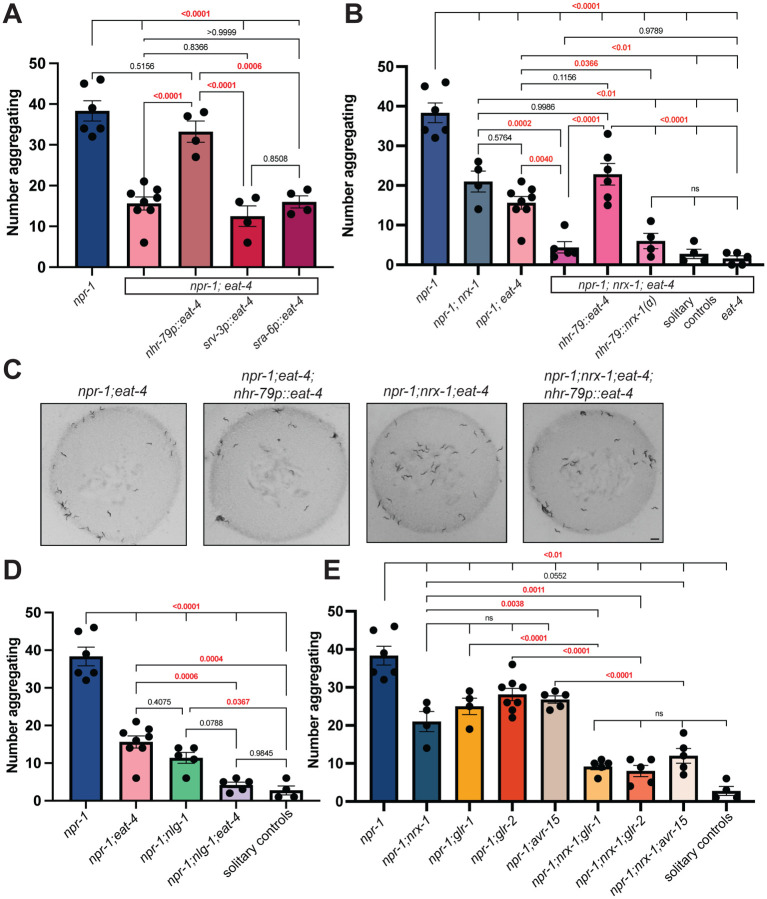
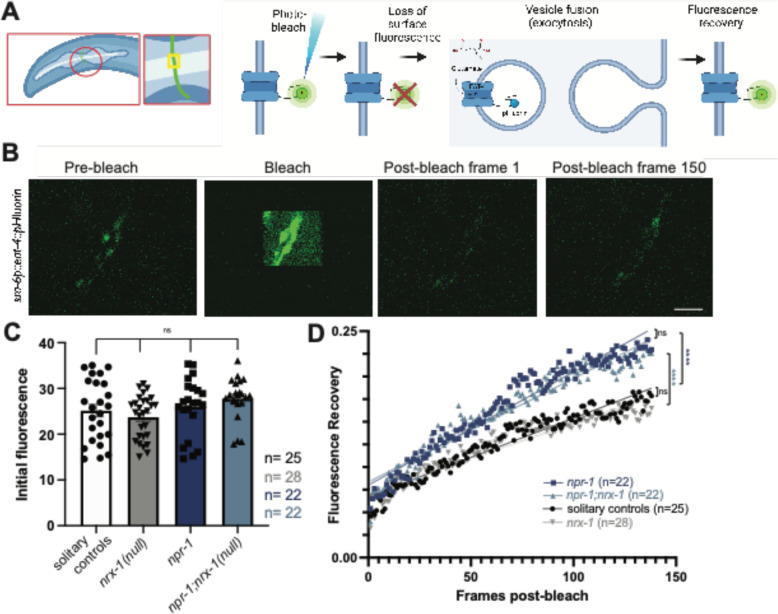
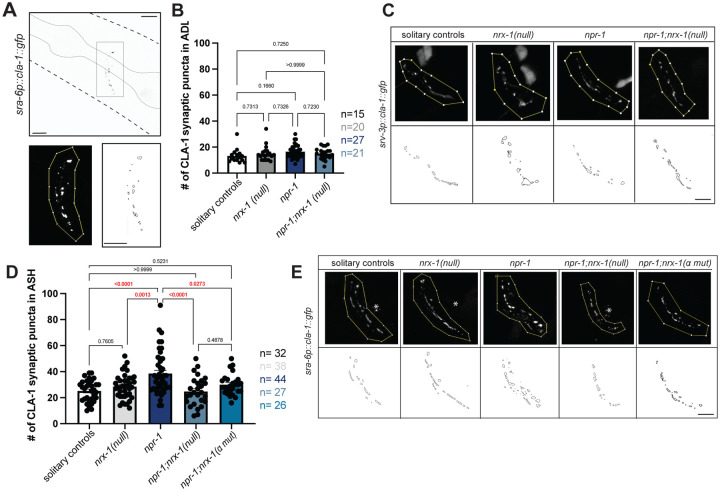
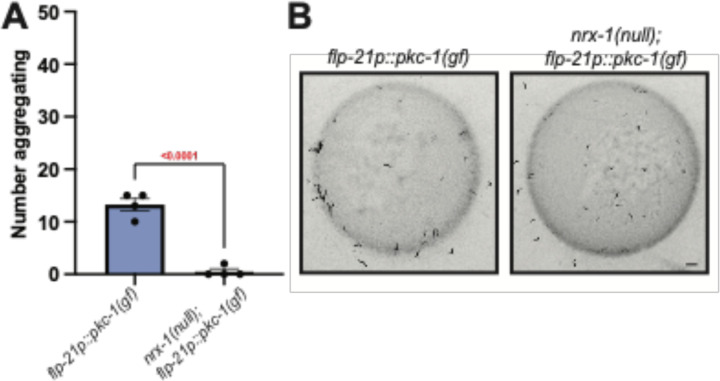
Animal foraging is an essential and evolutionarily conserved behavior that occurs in social and solitary contexts, but the underlying molecular pathways are not well defined. We discover that conserved autism-associated genes (NRXN1(nrx-1), NLGN3(nlg-1), GRIA1,2,3(glr-1), GRIA2(glr-2), and GLRA2,GABRA3(avr-15)) regulate aggregate feeding in C. elegans, a simple social behavior. NRX-1 functions in chemosensory neurons (ADL and ASH) independently of its postsynaptic partner NLG-1 to regulate social feeding. Glutamate from these neurons is also crucial for aggregate feeding, acting independently of NRX-1 and NLG-1. Compared to solitary counterparts, social animals show faster presynaptic release and more presynaptic release sites in ASH neurons, with only the latter requiring nrx-1. Disruption of these distinct signaling components additively converts behavior from social to solitary. Aggregation induced by circuit activation is also dependent on nrx-1. Collectively, we find that aggregate feeding is tuned by conserved autism-associated genes through complementary synaptic mechanisms, revealing molecular principles driving social feeding.


Conflict of interest statement

Competing Interests: The authors declare no conflicts of interest.

Figures

Fig. 1.
Fig. 1.. nrx-1 is essential for aggregation behavior
A) Circuit diagram of sensory integration circuit. Connectome based on NemaNode and WormWiring data. B) Cartoon of medium through-put aggregation behavior assay with 50 timed day 1 adult worms per well of a 6-well WormCamp then imaged using WormWatcher platforms and scored for aggregation behavior defined as two or more animals in direct contact. C) Schematic of C. elegans nrx-1 gene showing mutant alleles used and isoforms removed by functional null and α-isoform specific mutants. D) Graph showing number of aggregating animals in various genetic backgrounds. All mutant nrx-1 alleles (wy778 = nrx-1 null, gk246237 = nrx-1 α mut, nu485 = nrx-1 α del) show decreased aggregation behavior. E) Representative images of aggregation behavior in npr-1(ad609), npr-1(ad609);nrx-1(wy778), npr-1(ad609);nrx-1(nu485), npr-1(ad609);nrx-1(gk246237) mutants, and solitary controls (Scale bar = 1mm).
Fig. 2.
Fig. 2.. NRX-1(α) acts in ADL and ASH sensory neurons for aggregate feeding
A) Cartoons showing the neurons where each promoter is expressed. ric-19p expresses in all neurons, flp-21p expresses in neurons in several sensory neurons and RMG, nhr-79p expresses in ADL and ASH sensory neurons, srv-3p expresses in ADL neurons, and sra-6p expresses in ASH neurons. Graph showing number of aggregating animals (B) and representative images of aggregation behavior assay plates (C) in npr-1(ad609);nrx-1(null) mutants with NRX-1(α) driven by ric-19, flp-21, and nhr-79 promoters, and NRX-1(γ) driven by the ric-19 promoter and controls (Scale bar = 1mm). D) Confocal image of NRX-1(α) expression in all neurons (ric-19p∷sfGFP∷nrx-1), ADL and ASH neurons (nhr-79p∷sfGFP∷nrx-1), and ADL and ASH neurons (sra-6p∷sfGFP∷nrx-1 & srv-3p∷sfGFP∷nrx-1). Green arrows indicate NRX-1 axonal expression. Red dashed lines show cell bodies. ric-19p∷sfGFP∷nrx-1(α) imaging performed in nrx-1(wy778) (Scale bar = 10μm). E) Graph showing number of aggregating animals in various genetic backgrounds. Data for npr-1 and npr-1;nrx-1 is plotted in both 2B and 2E.
Fig. 3.
Fig. 3.. NLG-1 contributes independent of NRX-1 in aggregation behavior
A) Schematic of C. elegans nlg-1 gene showing deletion allele assessed. B) Graph showing number of aggregating animals in npr-1(ad609), npr-1(ad609);nlg-1(ok259), nlg-1(ok529), and solitary controls. nlg-1 deletion decreased aggregation behavior in npr-1 animals. C) Graph showing number of aggregating animals in npr-1(ad609);nlg-1(ok259) mutants with NLG-1 driven by ric-19, nhr-79, and nlp-56 promoters and controls. ric-19p expresses in all neurons, nhr-79p expresses in ADL and ASH sensory neurons and nlp-56p expresses in RMG neurons. D) Graph showing number of aggregating animals in npr-1(ad609), npr-1(ad609);nrx-1(wy778), npr-1(ad609);nlg-1(ok259), npr-1(ad609);nrx-1(wy778);nlg-1(ok259), and solitary controls. E) Representative images of aggregation behavior in npr-1(ad609);nlg-1(ok259), npr-1(ad609);nrx-1(wy778); nlg-1(ok259) and solitary controls (Scale bar = 1mm). Data for npr-1 and npr-1;nlg-1 is plotted in 3B, 3C, and 3D. Data for solitary controls is plotted in 3B and 3C.
Fig. 4.
Fig. 4.. Aggregation behavior depends on glutamate signaling from ADL and ASH neurons
A) Graph showing number of aggregating animals in npr-1(ad609) compared to npr-1;eat-4(ky5) mutants and number of aggregating animals in npr-1(ad609);eat-4(ky5) mutants with EAT-4 driven by nhr-79, srv-3, and sra-6 promoters. B) Graph showing number of aggregating animals in npr-1(ad609), npr-1(ad609);nrx-1(wy778), npr-1(ad609);eat-4(ky5), npr-1(ad609);nrx-1(wy778);eat-4(ky5) mutants. Graph also includes npr-1(ad609);nrx-1(wy778);eat-4(ky5) mutants with EAT-4 driven under the nhr-79 promoter, npr-1(ad609);nrx-1(wy778);eat-4(ky5) mutants with NRX-1(α) driven under the nhr-79 promoter, and solitary controls. C) Representative images of aggregation behavior in npr-1(ad609);eat-4(ky5), npr-1(ad609);eat-4(ky5); nhr-79p∷eat-4, npr-1(ad609);nrx-1(wy778);eat-4(ky5), and npr-1(ad609);nrx-1(wy778);eat-4(ky5); nhr-79p∷eat-4 animals (Scale bar = 1mm). D) Graph showing number of aggregating worms in npr-1(ad609), npr-1(ad609);eat-4(ky5), npr-1(ad609);nlg-1(ok259), npr-1(ad609);nlg-1(ok259);eat-4(ky5) mutants, and solitary controls. E) Graph showing number of aggregating animals in npr-1(ad609), npr-1(ad609);nrx-1(wy778), npr-1(ad609);glr-1(n2461), npr-1(ad609);glr-2(ok2342), npr-1(ad609);avr-15(ad1051), npr-1(ad609);nrx-1(wy778);glr-1(n2461), npr-1(ad609);nrx-1(wy778); glr-2(ok2342), and npr-1(ad609);nrx-1(wy778);avr-15(ad1051) mutants. Data for npr-1 and npr-1;eat-4 is plotted in 4A, 4B, and 4D. Data for npr-1;nrx-1 is plotted in 4B and 4E. Data for solitary controls is plotted in 4B, 4D, and 4E.
Fig. 5.
Fig. 5.. Glutamate release is faster in aggregating C. elegans, independent of NRX-1
A) Cartoon of sra-6p∷eat-4∷pHluorin experiment, including schematic of small neuron section bleached and EAT-4∷pHluorin photobleaching and recovery process. B) Representative images of ASH neuron prior to bleaching (pre-bleach), during bleach, immediately following bleach, and after recovery period of two minutes (Scale bar = 5μm). C) Graph showing initial fluorescence values taken from first 10 pre-bleach frames of FRAP experiments. D) Graph of post-bleach recovery as a fraction of initial fluorescence by post-bleach frame up to frame 138 (120 seconds, frame taken every 0.87 seconds) Comparisons shown on graph include: npr-1 and npr-1;nrx-1 (p=0.278), solitary control and nrx-1(p=0.080), solitary control and npr-1 (dark blue, p<0.0001), and npr-1;nrx-1 and nrx-1 (light blue, p<0.0001).
Fig. 6.
Fig. 6.. Higher number of ASH pre-synaptic puncta in aggregating C. elegans depends on nrx-1
A) Confocal micrograph of sra-6p∷cla-1∷gfp construct with pharynx outlined. Region of interest (ROI) in which counts are performed and puncta outlines generated by FIJI. Soma and projections outside of the nerve ring are not included in ROI (Scale bar = 10μm). Graph showing number (B) and representative images (C) of srv-3p∷cla-1∷gfp puncta in ADL in solitary controls nrx-1(wy778), npr-1(ad609), and npr-1(ad609);nrx-1(wy778) mutants. Graph showing number (D) and representative images (E) of sra-6p∷cla-1∷gfp puncta in ASH in solitary controls nrx-1(wy778), npr-1(ad609), and npr-1(ad609);nrx-1(wy778) mutants (Scale bars = 10μm).
Fig. 7:
Fig. 7:. Disruption of nrx-1 prevents aggregation behavior induced by activation of sensory neurons and RMG interneurons.
A) Graph showing number of aggregating animals in flp-21p∷pkc-1(gf) strain compared to flp-21p∷pkc-1(gf);nrx-1(wy778). B) Representative images of aggregation behavior in flp-21p∷pkc-1(gf) and flp-21p∷pkc-1(gf);nrx-1(wy778) animals.

References

    1. Hamilton WD. The genetical evolution of social behaviour. I. Journal of Theoretical Biology. 1964;7(1):1–16. doi:10.1016/0022-5193(64)90038-4 - DOI - PubMed
    1. Chen P, Hong W. Neural Circuit Mechanisms of Social Behavior. Neuron. 2018;98(1):16–30. doi:10.1016/j.neuron.2018.02.026 - DOI - PMC - PubMed
    1. Davidson JD, Arauco-Aliaga RP, Crow S, Gordon DM, Goldman MS. Effect of Interactions between Harvester Ants on Forager Decisions. Frontiers in Ecology and Evolution. 2016;4. Accessed October 9, 2023. https://www.frontiersin.org/articles/10.3389/fevo.2016.00115 - DOI - PMC - PubMed
    1. Gordon DM. Ant Encounters: Interaction Networks and Colony Behavior. In: Ant Encounters. Princeton University Press; 2010. doi:10.1515/9781400835447 - DOI
    1. Azorsa F, Muscedere ML, Traniello JFA. Socioecology and Evolutionary Neurobiology of Predatory Ants. Frontiers in Ecology and Evolution. 2022;9. Accessed October 9, 2023. https://www.frontiersin.org/articles/10.3389/fevo.2021.804200 - DOI

Publication types