[Preprint]. 2023 Dec 7:rs.3.rs-3592059.
doi: 10.21203/rs.3.rs-3592059/v1.

p14ARF forms meso-scale assemblies upon phase separation with NPM1

Affiliations

p14ARF forms meso-scale assemblies upon phase separation with NPM1

Eric Gibbs et al. Res Sq. .

Update in

  • p14ARF forms meso-scale assemblies upon phase separation with NPM1.
    Gibbs E, Miao Q, Ferrolino M, Bajpai R, Hassan A, Phillips AH, Pitre A, Kümmerle R, Miller S, Nagy G, Leite W, Heller W, Stanley C, Perrone B, Kriwacki R. Gibbs E, et al. Nat Commun. 2024 Nov 11;15(1):9531. doi: 10.1038/s41467-024-53904-z. Nat Commun. 2024. PMID: 39528457 Free PMC article.

Abstract

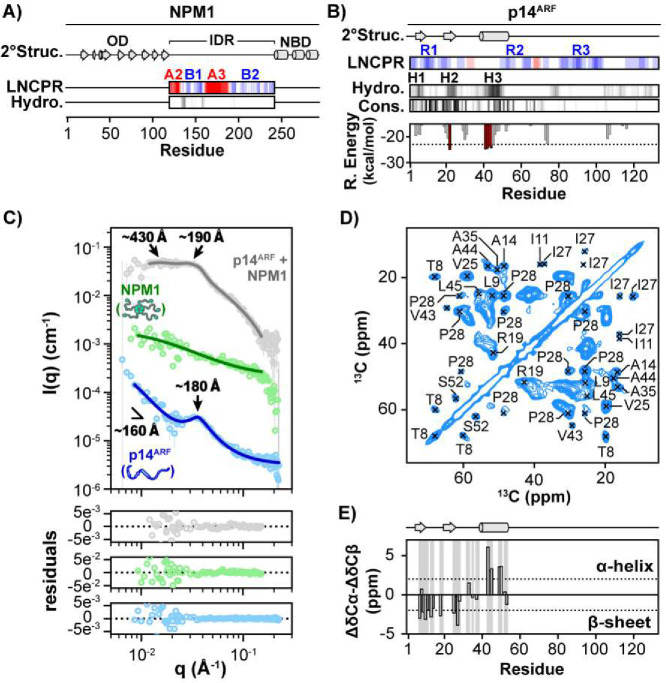
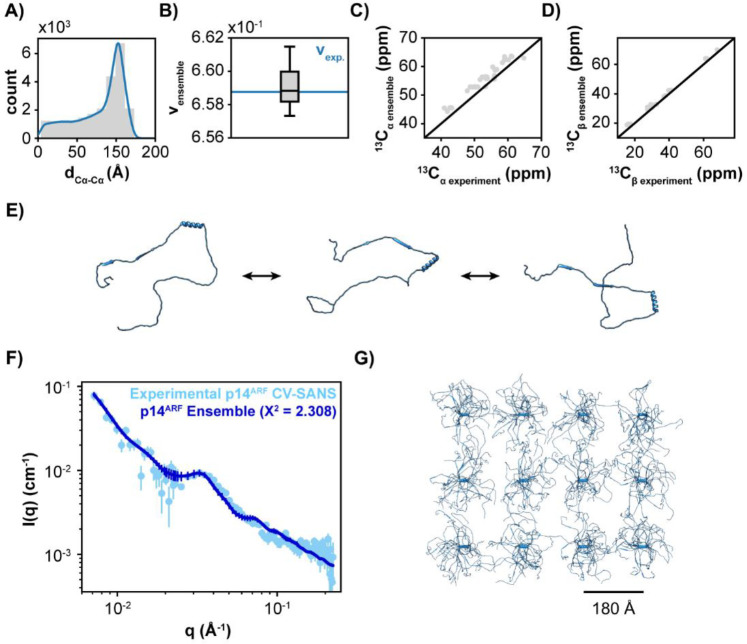
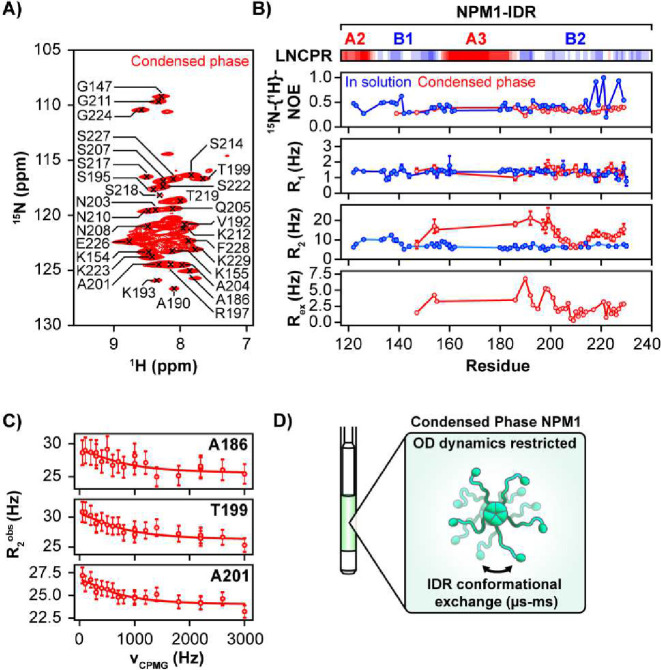
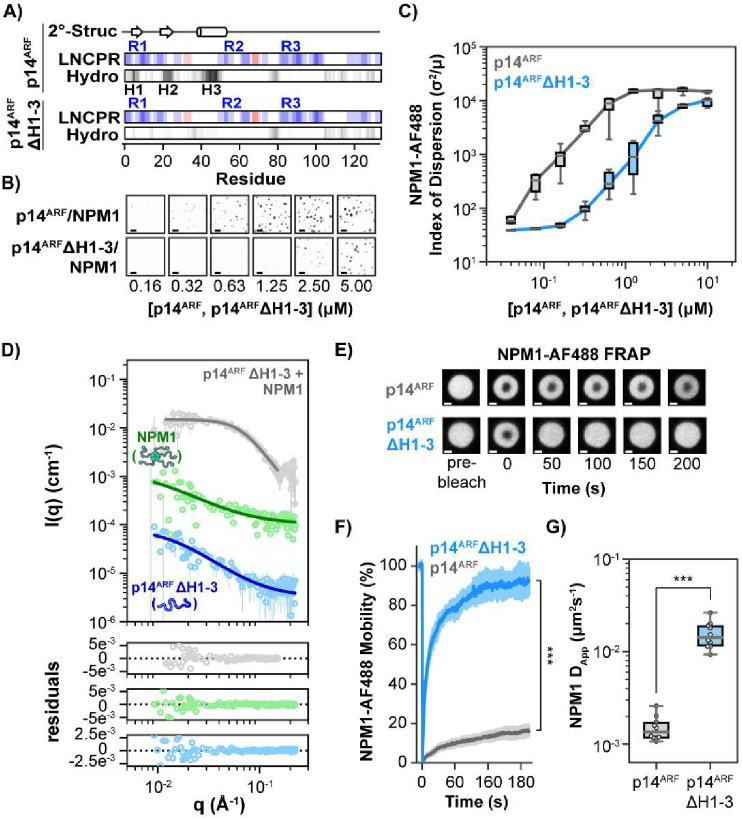
NPM1 is an abundant nucleolar chaperone that, in addition to facilitating ribosome biogenesis, contributes to nucleolar stress responses and tumor suppression through its regulation of the p14 Alternative Reading Frame tumor suppressor protein (p14ARF). Oncogenic stress induces p14ARF to inhibit MDM2, stabilize p53 and arrest the cell cycle. Under non-stress conditions, NPM1 stabilizes p14ARF in nucleoli, preventing its degradation and blocking p53 activation. However, the mechanisms underlying the regulation of p14ARF by NPM1 are unclear because the structural features of the p14ARF-NPM1 complex remain elusive. Here we show that NPM1 sequesters p14ARF within phase-separated condensates, facilitating the assembly of p14ARF into a gel-like meso-scale network. This assembly is mediated by intermolecular contacts formed by hydrophobic residues in an α-helix and β-strands within a partially folded N-terminal domain of p14ARF. Those hydrophobic interactions promote phase separation with NPM1, enhance nucleolar partitioning of p14ARF, restrict p14ARF and NPM1 diffusion within condensates and in nucleoli, and reduce cell viability. Our structural model provides novel insights into the multifaceted chaperone function of NPM1 in nucleoli by mechanistically linking the nucleolar localization of p14ARF to its partial folding and meso-scale assembly upon phase separation with NPM1.


Conflict of interest statement

Additional Declarations: There is NO Competing Interest.

Figures

Fig. 1.
Fig. 1.. p14ARF Exhibits Local and Long-Range Ordering within Condensates with NPM1.
A) NPM1 structural features, including the secondary structure calculated from PDB:4N8M (OD), and PDB:2LLH (NTD) using DSSP, and the linear net charge per residue (LNCPR) and linear hydropathy (Hydro.) calculated using CIDER. B) p14ARF structural features, including PSI-PRED secondary structure prediction (2°Struc.; β-strands are indicated with arrows and an α-helix with a cylinder), CIDER linear net charge per residue (LNCPR) and linear hydropathy (Hydro.), sequence conservation (Cons.) based on multi-sequence alignment using MUSCLE, and Rosetta steric zipper propensity energy (R. Energy) calculated using ZipperDB. C) CV-SANS curves for the p14ARF-NPM1 condensed phase, which reveal the spatial organization of NPM1 (green trace), p14ARF (blue trace) and the p14ARF-NPM1 complex (grey trace). All curves are offset for clarity, with points shown as the average and standard deviation. Correlation peaks at ~200 Å and ~400 Å correspond to meso-scale organization of p14ARF. D) 2D CC-DARR spectrum of [13C,15N]-p14ARF within the condensed phase. E) Secondary 13C chemical shifts for [13C,15N]-p14ARF within the condensed phase. Assigned residues are highlighted in grey. The secondary structure prediction from panel B is shown at the top.
Fig. 2.
Fig. 2.. Structural Model for the p14ARF Component of the p14ARF-NPM1 Condensed Phase.
A) Intramolecular Cα-Cα distances for the p14ARF ensemble. B) Comparison of the ensemble and experimental polymer scaling factors. C) Comparison of the ensemble and experimental Cα chemical shifts. D) Comparison of the ensemble and experimental Cβ chemical shifts. E) Representative conformers from the p14ARF ensemble. F) Comparison of the experimental p14ARF CV-SANS curve (light blue scatter points) and the p14ARF ensemble model (blue trace). Points represent the average and standard deviation. G) Ensemble model for the p14ARF meso-scale assembly.
Fig. 3.
Fig. 3.. The NPM1 IDR Retains Disorder and Experiences Attenuated Backbone Motions within the Condensed Phase with p14ARF.
A) 2D 1H-15N TROSY-HSQC spectrum of [13C,15N]-NPM1 within the p14ARF-NPM1 condensed phase, displaying signals from the NPM1 IDR. B) Linear net charge per residue (LNCPR) for the NPM1 IDR. 1H-15N heteronuclear NOE, R1 and R2 transverse relaxation profiles for NPM1 in solution (blue) and within the p14ARF-NPM1 condensed phase (red), which show a restriction of IDR backbone motions on the ps-ns timescale. Exchange broadening rates Rex for condensed NPM1 are shown on the bottom. C) 15N-CPMG relaxation dispersion profiles for Ala186, A201 and T199 collected at 800 MHz, with fits to a two-state model. D) Upon phase separation with p14ARF the NPM1 IDR exchanges slowly between multiple conformations on the μs-ms timescale. All error bars represent the standard deviations.
Fig. 4.
Fig. 4.. Substitution of p14ARF Hydrophobic Residues Blocks p14ARF Meso-Scale Ordering and Restores NPM1 Mobility within Condensates.
A) p14ARF structural features, including PSI-PRED4.0 secondary structure (2°Struc.) prediction, CIDER linear net charge per residue (LNCPR) and CIDER linear hydropathy (Hydro.). CIDER analysis for p14ARFΔH1-3 is shown on the bottom. B) Confocal fluorescence micrographs of p14ARF-NPM1 condensates (top) and p14ARFΔH1-3-NPM1 condensates (bottom). Scale bars = 10 μm. C) Phase diagrams for condensates shown in panel B quantified using the index of dispersion. D) CV-SANS curves for the p14ARFΔH1-3-NPM1 condensates; NPM1 (green trace), p14ARFΔH1-3 (blue trace), p14ARFΔH1-3-NPM1 complex (grey trace). All curves are offset for clarity, with points shown as the average and standard deviation. E) FRAP of NPM1-AF488 within condensates shows that substitution of p14ARF hydrophobic residues to Gly/Ser spacer residues restores NPM1 mobility. F) FRAP recovery curves for p14ARF-NPM1 and p14ARFΔH1-3-NPM1 condensates (n=10 for each condition, Wilcoxon rank-sum test). G) NPM1-AF488 DApp values extracted from the FRAP recovery curves in panel F (n=10, Wilcoxon rank-sum test). For panels F and G, (***) p < 0.001.
Fig. 5.
Fig. 5.. p14ARF Reduces Nucleolar NPM1 Diffusion in a Concentration Dependent Manner.
A) Schematic constant-temperature and pressure phase diagram for p14ARF-NPM1. Single phase regions are shown in white; coexistence regions are shown in gray. The curved arrow represents a concentration vector that crosses through the coexistence regions, initially sampling a liquid-like NPM1-rich phase, followed by a gel-like p14ARF-NPM1 phase, terminating in a solid-like p14ARF-rich phase. B) Fluorescence microscopy images of live B11 cells before and 48 hours after doxycycline induced p14ARF-iRFP expression. Scale bars = 2 μm. C) Z-score analysis of NPM1-GFP and p14ARF-iRFP levels in DLD-1NPM1–G cells, showing that p14ARF and NPM1 levels are anti-correlated (two-sided Mann-Whitney U-test, n = 2272, 122, 54), (*) p < 0.05, (****) p < 0.0001. D) Representative single-cell FRAP for two cells selected from the DLD-1 population shown in C. The curves on the left are from a cell expressing a high level of nucleolar NPM1 and low level of p14ARF. The curves on the right are from a cell expressing a low level of nucleolar NPM1 and a high level of p14ARF. E) The DApp and F) the mobility for nucleolar NPM1-GFP is reduced as nucleolar p14ARF-iRFP levels increase (small, transparent markers) and as the duration of p14ARF-iRFP expression is extended (large, opaque markers). These correlated reductions in dynamics are consistent with the assembly of large molecular weight p14ARF-NPM1 complexes. For panels E and F error bars represent the standard deviation.

References

    1. Sherr C. J. Divorcing ARF and p53: an unsettled case. Nat Rev Cancer 6, 663–673 (2006). 10.1038/nrc1954 - DOI - PubMed
    1. Bertwistle D., Sugimoto M. & Sherr C. J. Physical and functional interactions of the Arf tumor suppressor protein with nucleophosmin/B23. Mol Cell Biol 24, 985–996 (2004). 10.1128/Mcb.24.3.985-996.2004 - DOI - PMC - PubMed
    1. Korgaonkar C. et al. Nucleophosmin (B23) targets ARF to nucleoli and inhibits its function. Mol Cell Biol 25, 1258–1271 (2005). 10.1128/Mcb.25.4.1258-1271.2005 - DOI - PMC - PubMed
    1. Quin J. E. et al. Targeting the nucleolus for cancer intervention. Bba-Mol Basis Dis 1842, 802–816 (2014). 10.1016/j.bbadis.2013.12.009 - DOI - PubMed
    1. Kuo M. L., den Besten W., Bertwistle D., Roussel M. F. & Sherr C. J. N-terminal polyubiquitination and degradation of the Arf tumor suppressor. Gene Dev 18, 1862–1874 (2004). 10.1101/gad.1213904 - DOI - PMC - PubMed

Publication types