[Preprint]. 2024 Nov 8:2023.12.07.570640.
doi: 10.1101/2023.12.07.570640.

Single-cell eQTL mapping in yeast reveals a tradeoff between growth and reproduction

Affiliations

Single-cell eQTL mapping in yeast reveals a tradeoff between growth and reproduction

James Boocock et al. bioRxiv. .

Update in

Abstract

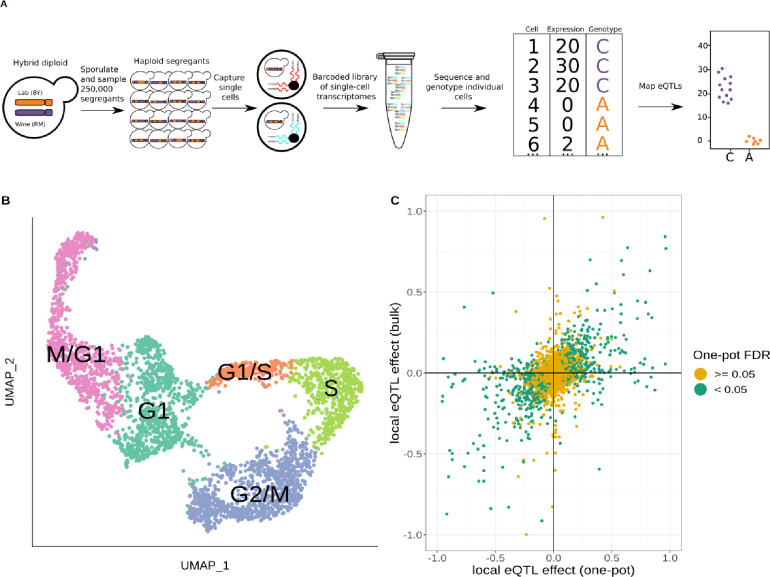
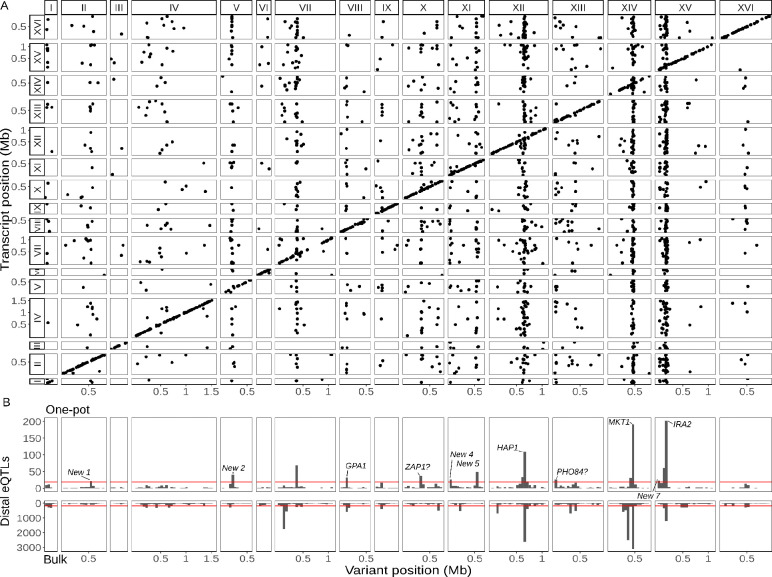
Expression quantitative trait loci (eQTLs) provide a key bridge between noncoding DNA sequence variants and organismal traits. The effects of eQTLs can differ among tissues, cell types, and cellular states, but these differences are obscured by gene expression measurements in bulk populations. We developed a one-pot approach to map eQTLs in Saccharomyces cerevisiae by single-cell RNA sequencing (scRNA-seq) and applied it to over 100,000 single cells from three crosses. We used scRNA-seq data to genotype each cell, measure gene expression, and classify the cells by cell-cycle stage. We mapped thousands of local and distant eQTLs and identified interactions between eQTL effects and cell-cycle stages. We took advantage of single-cell expression information to identify hundreds of genes with allele-specific effects on expression noise. We used cell-cycle stage classification to map 20 loci that influence cell-cycle progression. One of these loci influenced the expression of genes involved in the mating response. We showed that the effects of this locus arise from a common variant (W82R) in the gene GPA1, which encodes a signaling protein that negatively regulates the mating pathway. The 82R allele increases mating efficiency at the cost of slower cell-cycle progression and is associated with a higher rate of outcrossing in nature. Our results provide a more granular picture of the effects of genetic variants on gene expression and downstream traits.


Conflict of interest statement

Competing interests The authors declare no competing financial interests.

Figures

Figure 1:
Figure 1:. One-pot eQTL mapping is feasible in yeast.
A) One-pot eQTL mapping workflow. A large population of hybrid diploid cells is sporulated, and MATa haploid yeast progeny cells (segregants) are isolated by fluorescence-activated cell sorting. Cells are captured and processed with the 10x Chromium device. The resulting barcoded library of single-cell transcriptomes is sequenced by Illumina short-read sequencing. Unique molecular identifier counts are tallied for each transcript in each segregant. The number of supporting molecules for each parental allele is identified at every transcribed sequence position that differs between the parental strains, and a hidden Markov model is used to infer the genotype of each segregant. In the cartoon example of an eQTL shown on the top right, segregants with the C allele have higher expression of the gene than those with the A allele. B) Representative UMAP plot of cells colored by their assigned cell-cycle stage. C) Scatter plot of local eQTL effects from the one-pot experiment in the cross between BY and RM (x-axis) against local eQTL effects based on expression measurements from bulk RNA-seq in the same cross (y-axis). Green dots denote one-pot eQTL effects that were significant at a false-discovery rate (FDR) of 0.05; yellow dots denote those that were not. The x-axis and y-axis were truncated at −1 and 1 for ease of visualization, which left out 67 of 4,044 data points.
Figure 2:
Figure 2:. Single-cell eQTL map recapitulates bulk trans-eQTL hotspots and identifies new hotspots.
A) Map of local and distant eQTLs. Each point denotes an eQTL, with the genomic position of the peak marker on the x-axis and the genomic location of the gene with the expression difference on the y-axis. The high density of points on the diagonal line with a slope of one indicates that many genes have local eQTLs. The dense vertical bands correspond to trans-eQTL hotspots. B) Histogram showing the number of distant eQTLs in 50 kb windows (top: one-pot eQTL map; bottom: bulk eQTL map). Red lines show statistical eQTL enrichment thresholds for a window to be designated a hotspot. Text labels highlight known and putative causal genes underlying hotspots, as well as loci that meet hotspot criteria only in the current study.
Figure 3:
Figure 3:. Single-cell eQTL maps in two new crosses.
A) eQTL map for the YJM145xYPS163 cross (cross B). B) eQTL map for the CBS2888 xYJM981 cross (cross C). C) Histogram of distal eQTLs showing hotspots in cross B. D) Histogram of distal eQTLs showing hotspots in cross C. The y-axis has been truncated to have a maximum value 100 for ease of visualization purposes. The hotspot on chromosome X near the gene CYR1 influences the expression of 175 genes, and the hotspot on chromosome XI influences the expression of 386 genes.
Figure 4:
Figure 4:. Genetic effects on expression noise.
A) Cumulative distribution of simulated allele-specific counts for two alleles with different average expression but the same expression noise. B) Cumulative distribution of simulated allele-specific counts for two alleles with different expression noise but the same average expression. These simulated distributions are shown to illustrate allele-specific effects on average expression and on expression noise, respectively. C) Log-log scatter plot of change in expression noise between alleles (x-axis) against change in average expression between alleles (y-axis); points correspond to all 1,487 genes with significant allele-specific effects on expression noise and/or average expression. Black line shows the predicted change in noise given a change in expression, with the 95% confidence interval for the trend shown in gray. The 377 genes with allele-specific effects on expression noise that cannot be accounted for by the overall trend are shown in red. The x and y axes have been truncated at −5 and 5 for ease of visualization purposes, which left out 30 of 1,487 data points.
Figure 5:
Figure 5:. Natural genetic variants affect cell-cycle occupancy.
A) Cell-cycle occupancy QTL map for three different crosses. LOD score for linkage with cell-cycle occupancy (y-axis) is plotted against the genomic location of genetic markers (x-axis). Colored lines show results for different cell-cycle stages as denoted in the legend. Horizontal line corresponds to a family-wise error rate (FWER) threshold of 0.05. Text labels highlight genes with QTL effects shown in panels B-D. Cell-cycle occupancy mapping was not performed on chromosome III. B) Variation in MKT1 increases G1 occupancy and decreases G2/M occupancy in the BYxRM cross. C) Variation in GPA1 decreases G1 occupancy and increases S and G2/M occupancy in the YJM145xYPS163 cross. D) Variation in CYR1 decreases G1 occupancy and increases S and G2/M occupancy in the CBS2888xYJM981 cross. Error bars in B-D represent 95% confidence intervals.
Figure 6:
Figure 6:. The 82R allele of GPA1 increases mating efficiency at the cost of growth rate and is associated with increased outbreeding in natural populations.
A) Boxplots show growth of allele replacement strains grown in glucose. Points represent replicate measurements of the doublings per hour for each strain. Tukey’s HSD adjusted p-values of pairwise comparisons of allele replacement strains are shown. B) Boxplots show mating efficiency of allele replacement strains; details as in A). C) Genome-wide neighbor-joining tree of 1,011 sequenced yeast isolates. Strains in which only the 82R allele is present are denoted in blue; strains with support for both 82R and 82W alleles are denoted in red; and strains in which only 82W allele is present are denoted in grey. We observed that the 82R allele is enriched in mosaic strains (allele frequency=45.3%, permutation test p=0.007). Other clades mentioned in the text are labeled on the tree.

References

    1. Albert F. W. & Kruglyak L. The role of regulatory variation in complex traits and disease. Nat. Rev. Genet. 16, 197–212 (2015). - PubMed
    1. Kang J. B., Raveane A., Nathan A., Soranzo N. & Raychaudhuri S. Methods and Insights from Single-Cell Expression Quantitative Trait Loci. Annu. Rev. Genomics Hum. Genet. 24, 277–303 (2023). - PMC - PubMed
    1. Finucane H. K. et al. Partitioning heritability by functional annotation using genome-wide association summary statistics. Nat. Genet. 47, 1228–1235 (2015). - PMC - PubMed
    1. Umans B. D., Battle A. & Gilad Y. Where Are the Disease-Associated eQTLs? Trends Genet. 37, 109–124 (2021). - PMC - PubMed
    1. Gusev A. et al. Integrative approaches for large-scale transcriptome-wide association studies. Nat. Genet. 48, 245–252 (2016). - PMC - PubMed

Publication types