[Preprint]. 2023 Dec 6:rs.3.rs-3674059.
doi: 10.21203/rs.3.rs-3674059/v1.

Zika Virus NS1 Drives Tunneling Nanotube Formation for Mitochondrial Transfer, Enhanced Survival, Interferon Evasion, and Stealth Transmission in Trophoblasts

Affiliations

Zika Virus NS1 Drives Tunneling Nanotube Formation for Mitochondrial Transfer, Enhanced Survival, Interferon Evasion, and Stealth Transmission in Trophoblasts

Indira Mysorekar et al. Res Sq. .

Update in

Abstract

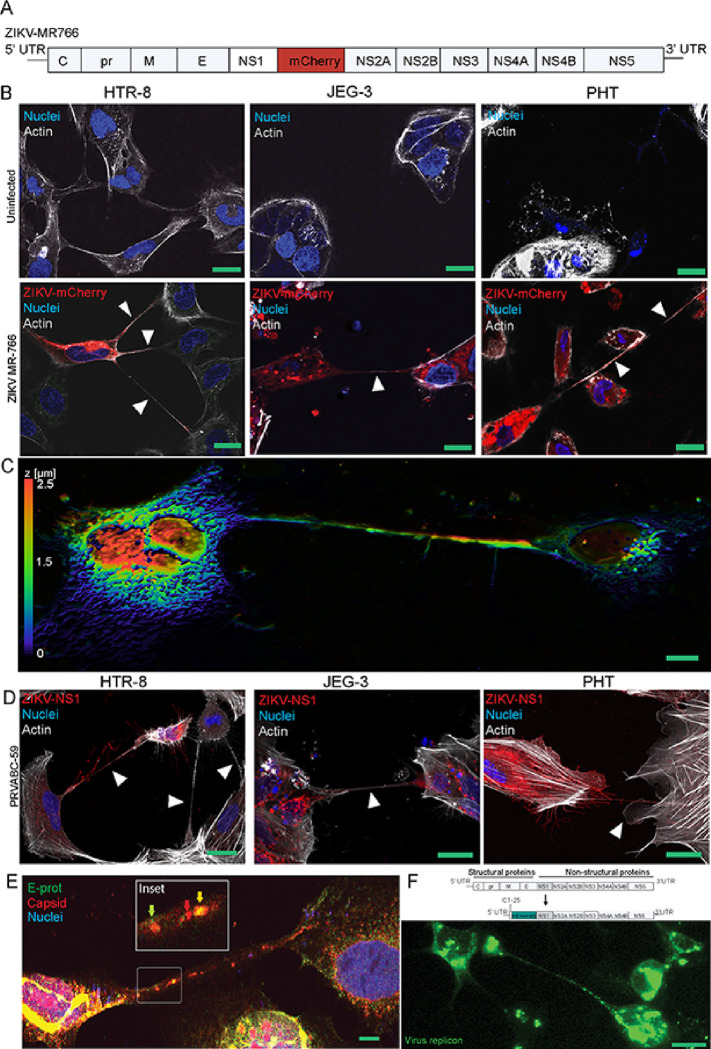
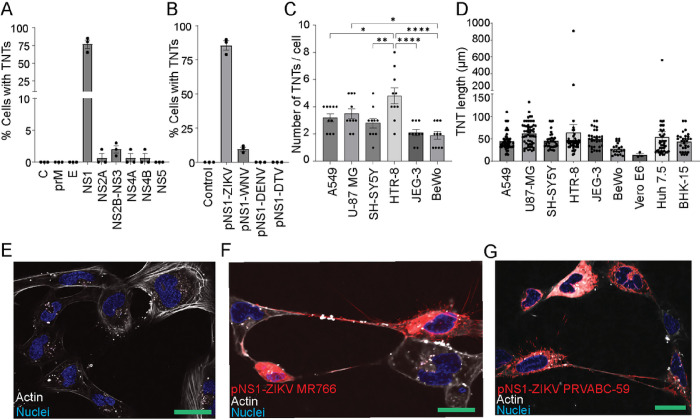
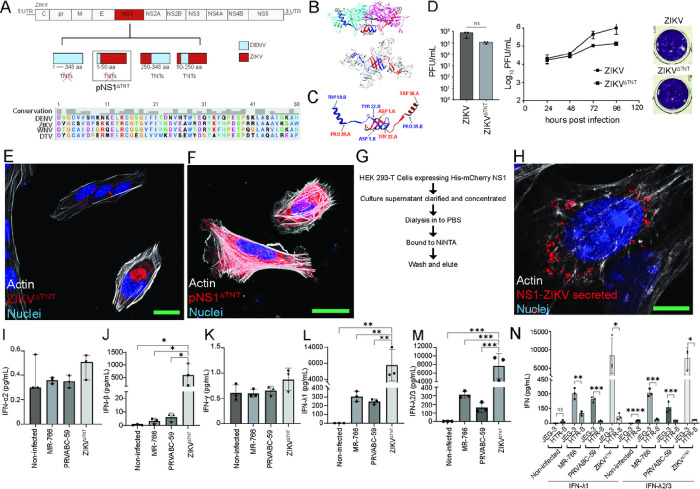
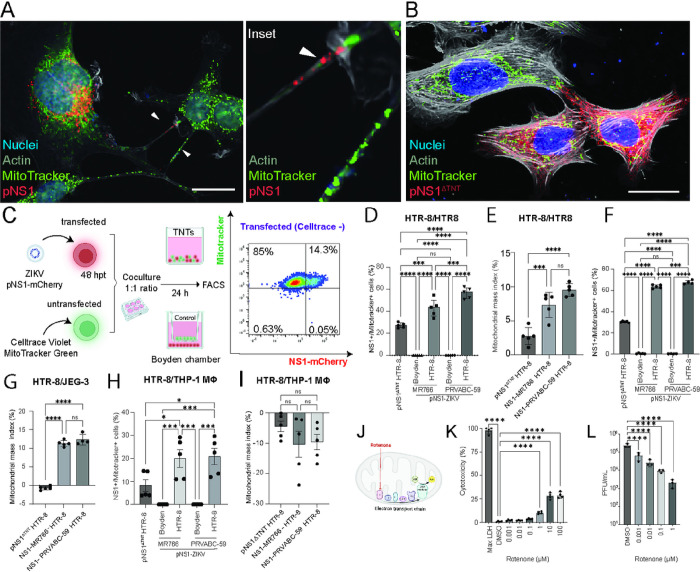
Zika virus (ZIKV) infection continues to pose a significant public health concern due to limited available preventive measures and treatments. ZIKV is unique among flaviviruses in its vertical transmission capacity (i.e., transmission from mother to fetus) yet the underlying mechanisms remain incompletely understood. Here, we show that both African and Asian lineages of ZIKV induce tunneling nanotubes (TNTs) in placental trophoblasts and multiple other mammalian cell types. Amongst investigated flaviviruses, only ZIKV strains trigger TNTs. We show that ZIKV-induced TNTs facilitate transfer of viral particles, proteins, and RNA to neighboring uninfected cells. ZIKV TNT formation is driven exclusively via its non-structural protein 1 (NS1); specifically, the N-terminal region (50 aa) of membrane-bound NS1 is necessary and sufficient for triggering TNT formation in host cells. Using affinity purification-mass spectrometry of cells infected with wild-type NS1 or non-TNT forming NS1 (pNS1ΔTNT) proteins, we found mitochondrial proteins are dominant NS1-interacting partners, consistent with the elevated mitochondrial mass we observed in infected trophoblasts. We demonstrate that mitochondria are siphoned via TNTs from healthy to ZIKV-infected cells, both homotypically and heterotypically, and inhibition of mitochondrial respiration reduced viral replication in trophoblast cells. Finally, ZIKV strains lacking TNT capabilities due to mutant NS1 elicited a robust antiviral IFN-λ 1/2/3 response, indicating ZIKV's TNT-mediated trafficking also allows ZIKV cell-cell transmission that is camouflaged from host defenses. Together, our findings identify a new stealth mechanism that ZIKV employs for intercellular spread among placental trophoblasts, evasion of antiviral interferon response, and the hijacking of mitochondria to augment its propagation and survival. Discerning the mechanisms of ZIKV intercellular strategies offers a basis for novel therapeutic developments targeting these interactions to limit its dissemination.


Conflict of interest statement

Competing interests IUM serves on the scientific advisory board of Luca Biologics.

Figures

Figure 1
Figure 1. Multiple ZIKV strains induce TNT formation in human placental trophoblast cells and transfer viral proteins.
A)Schematics showing the generation of fluorescent mCherry-tagged ZIKV MR-766 for live-cell imaging of tunneling nanotubes (TNTs). B) ZIKV strain MR-766 induce thin and long TNTs (arrows) connecting infected cells after 24 hours post infection (hpi) in extravillous trophoblast-like cells (HTR-8/SVneo, MOI=0.1) and cytototrophoblasts (JEG-3, MOI=0.1), and primary human trophoblast cells (PHTs, MOI=3) isolated from term placenta. Maximum intensity projection was used to construct z-series images into 2D images (ImageJ). C) Maximum intensity projection from a Z-series image of a TNT hovering over the substrate connecting ZIKV-NS1 expressing cells (HTR-8/SVneo). D) ZIKV-PRVABC-59 strain also induces TNT formation in HTR-8/SVneo and JEG-3 (MOI=0.1), and PHTs (MOI=3) after 24 hpi. ZIKV NS1 was stained with anti-NS1 and secondary antibodies conjugated to Alexa Fluor 594 dye was used to visualize the protein. E) ZIKV MR-766 (MOI=1, 24 hpi) infection of A549 cells induces TNT formation showing colocalization of virus envelope (E) and capsid proteins within TNT. ZIKV E and capsid was stained with anti-envelope and anti-capsid and secondary antibodies conjugated to FITC and TRITC was used to visualize the protein. F)Schematic showing the construction of ZIKV fluorescent-tagged viral replicon plasmid. Open reading frames (ORFs) for structural proteins capsid, precursor membrane (prM), and E were removed from ZIKV cDNA and replaced with an ORF coding for fluorescent mEmerald protein by site directed mutagenesis and overlap PCR cloning. Live-cell imaging of A549 cells transfected (48 hours) with ZIKV-mEmerald replicon reveals viral RNA and mEmerald within TNTs and neighboring cells. Images B-D were acquired by confocal microscopy at 60X oil objectives lens at 1.4 normal aperture (NA) using a Nikon A1R. Images E and F acquired using a Nikon A1R-MP. Images were processed using the NIS Elements software (Nikon). Nuclei in blue are stained with Hoechst 33342, actin in gray stained with Sir700-Actin Kit, and NS1 in red. Bar = 25 μm.
Figure 2
Figure 2. The non-structural protein 1 (NS1) of ZIKV is unique and necessary for inducing TNT formation in multiple cell types.
A) A549 cells were transfected with fluorescent mCherry-tagged ZIKV proteins and determined their ability to induce TNT formation. B) ZIKV-NS1 uniquely induces TNT formation compared to West Nile (WNV)-NS1, dengue (DENV)-NS1, and deer tick virus (DTV)-NS1 in transfected A549 cells. TNT counting was determined by quantifying cells with TNT per 100 cells expressing mCherry-tagged ZIKV proteins after 48 hours post transfection (hpt) and is represented as the average percentage ± standard error (SE), n=3. C-D) Expression of NS1 protein induces TNTs. pNS1-ZIKV (MR-766) expression induces TNTs of varying number C) and length D) in several mammalian cell lines. The number of TNTs per cell and TNT length was quantified and is represented as the average percentage ± SE, n≥ 10 (one-way ANOVA and Dunnett’s post-hoc test, *P≤0.05, **P≤ 0.01, and ****P≤0.0001). E-G) Confocal imaging of TNTs formed in HTR-8/SVneo cells. Compared to untransfected cells E), cells transfected NS1 from MR-766 (African strain) F) and PRVABC-59 (Asian strain) G) induced TNT formation 24 hpt. Images were acquired using a Nikon A1R (60X oil objectives lens at 1.4 normal aperture (NA)). Nuclei in blue are stained with Hoechst 33342, actin in gray stained with Sir700-Actin Kit, and NS1-mCherry is in red. Bar=25μm.
Figure 3
Figure 3. The N-terminus of ZIKV NS1 is necessary to induce TNT formation, and TNTs are functionally important for dampening IFN response.
A) Schematic depicting plasmid constructs and ZIKV mutants (ZIKVΔTNT) generated in which ZIKV-NS1 sequence was replaced with the nucleotide sequences from dengue virus-2 (DENV2)-NS1 (top panel). The N-terminal 50 amino acids are critical for the TNT-inducing ability of ZIKV-NS1. Alignment of NS1 sequences from DENV2, ZIKV, West Nile virus (WNV), and deer tick virus (DTV) highlighted sequence conservation and potential determinants for TNT formation (bottom panel). Multiple sequence alignment was performed using Clustal Omega and visualized in UCSF Chimera. B) Ribbon representation of ZIKV-NS1 dimer structure (PDB:4O6B) where the monomers are colored in teal (chain A) and pink (chain B). The N-terminal 50 amino acids of each monomer are colored in blue and red for chains A and B, respectively. C) Ribbon representation of N-terminal 50 amino acids of NS1 dimers (chain A and chain B). Images in B and C were generated using UCSF Chimera D) ZIKVΔTNT retained similar infectious plaque-forming capacity on Vero E6 cells compared to wild-type MR-766 strain as determined by plaque assay (representative image), and viral growth curve (n=3). E,F) Confocal imaging to detect TNTs in HTR-8/SVneo cells infected with ZIKVΔTNT (MOI=0.1) (E) and transfected with pNS1ΔTNT (F) showing absence of TNTs after 24 hours. G) schematic depicting the methodology for purification and concentration of secreted ZIKV-NS1. H) Secreted NS1 does not induce TNT formation. Representative image of HTR-8 cells treated with secreted NS1 for 48 hours showing NS1 in endosomal-like compartments, and no TNT formation. I-M) Interferon analysis of ZIKV infected JEG-3 cells. Multiplex assays for interferon type 1/2/3 (LEGENDplex) were performed on supernatants from JEG-3 cells infected with MR-766, PRVABC-59 ZIKV strains, and ZIKVΔTNT (MOI=0.1) for 48 hrs. I) IFN-α2 levels were represented as median ± SE (n=3, Kruskal-Wallis and Dunn’s post-hoc tests). J) IFN-β, K) IFN-γ, L) IFN-λ1, and M) IFN-λ2/3 levels were represented as mean ± SD (n=3; ANOVA and Dunnett’s post-hoc test, *P≤0.05, **P≤ 0.01, and ***P≤0.001). N) Comparison between JEG-3 and HTR-8’s IFN-λ1 and IFN-λ2/3 response to ZIKV infection (n=3, Student’s t-test, *P≤0.05, **P≤ 0.01, ***P≤0.001, ****P≤0.0001, ns=not significant). Nuclei in blue are stained with Hoechst 33342, actin in gray stained with Sir700-Actin Kit, and NS1 in red. Images (E, F) were acquired by confocal microscopy at 60X oil objectives lens at 1.4 normal aperture (NA) using a Nikon A1R and (H) A1R-MP. Images were processed using the NIS Elements software (Nikon). Bar= 25 μm.
Figure 4
Figure 4. NS1-induced TNTs are associated with mitochondrial proteins.
A-D) Affinity Purification Mass spectrometry analysis of ZIKV NS1 interacting proteins associated with TNT formation in JEG-3 cells. A) Venn diagram showing pNS1-ZIKV and pNS1ΔTNT (non-TNT forming) interacting partners (2-fold difference; P-value ≤0.05) B) Subcellular location of 178 proteins enriched with wild-type TNT forming ZIKV NS1 C) unique interacting partners of wild-type TNT forming ZIKV NS1 (n=50) according to the Uniprot database (https://www.uniprot.org/ accessed on 09/29/2023 at 2:28pm). D) Heatmap showing differential protein-protein interactions with TNT forming NS1 and mutant NS1ΔTNT, n=3. E) Representative confocal images showing colocalization of ZIKV-NS1 (red) and mitochondria (green) in HTR-8 trophoblast cells at 16 hours post-transfection (hpt) and co-culture. ROI is magnified as insets and shown as single channels. F-I) Mitochondria accumulation in ZIKV infected or ZIKV-NS1 expressing cells. F) Representative confocal images showing mitochondria accumulation in JEG-3 infected with ZIKV-mCherry (MR-766) compared to uninfected cells (MOI=0.1, 16 hours post-infection). G) comparison of the median fluorescence intensity (MFI) of mitotracker in uninfected and infected cells (n=5, pairwise t-test, ****P≤0.000). H) Representative images of JEG-3 cells transfected with pNS1-ZIKV showing mitochondria accumulation and I) quantification of mitochondria accumulation via flow cytometry (n=5, Student’s t-test, **P≤ 0.01). Nuclei in blue are stained with Hoechst 33342, mitochondria in green stained with Mitotracker green, and NS1 in red. Images were acquired by confocal microscopy at 40X using a Nikon A1R. Images were processed using the NIS Elements software (Nikon). Bar=10 μm (E) and 25 μm (F,H).
Figure 5
Figure 5. ZIKV NS1 induces mitochondrial transfer between cells via TNTs, and inhibition of mitochondrial activity limits viral replication.
A,B) Mitochondria transfer through TNTs. Confocal image of HTR-8 cells transfected with pNS1-ZIKV showing mitochondria (green, arrow) and NS1 (red, arrow) transported within F-actin-rich TNTs (gray) (A), while cells transfected with pNS1ΔTNT shows limited TNT formation and transfer of mitochondria cargo at 24 hpt (B). Images were acquired using a Nikon A1R confocal microscope (40X, 60X oil objectives lens at 1.4 normal aperture (NA)) and processed using the NIS Elements software (Nikon). Nuclei in blue are stained with Hoechst 33342, actin in gray stained with Sir700-Actin Kit, and NS1 in red. Bar= 10 μm (A), 100 μm (B-C). C-I) Analysis of mitochondria transfer via TNTs by co-culture experiments. C) Experimental set up of co-culture and flow cytometry as in D-I. pNS1-ZIKV transfected cells (NS1-mCherry, acceptor cells) were co-cultured with non-transfected donor cells (MitoTracker green and Celltrace violet) for 24 hours and analyzed by flow cytometry. Experimental control co-cultures were set up in Boyden chambers where donor and acceptor cells are physically separated. Cells were gated singlets, live cells (Live/Dead stain) followed by Celltrace. The resulting cells were gated on NS1-mCherry and Mitotracker expression and represented as the percentage of total acceptor cells (D, F and H). Graphs showing percentage of NS1-expressing acceptor cells that acquired mitochondria from donor cells in co-culture experiments (E, G, I). The homotypic HTR-8/HTR-8 co-cultures (D,E) and heterotypic HTR-8/JEG-3 (F,G) and heterotypic HTR-8/THP-1 (H,I) co-cultures show varying percentage of double positive expressing cells (NS1+ and mitotracker+) and mitochondrial mass index compared to mitotracker and pNS1ΔTNT expressing cells. Quantification of mitochondria transfer was performed using the BD LSRFortessa cell analyzer, total events collected= 30,000 cells, n= 4–5, Flow cytometry results were analyzed using FlowJo v10.8 Software (BD Life Sciences). Mitochondrial mass index= 100*((NS1+/Mitotracker+ - NS1−/Mitotracker+) / NS1+/Mitotracker+). J) Rotenone is a reversible mitochondrial electron transport chain complex I inhibitor. K) Graph showing cytotoxicity of JEG-3 cells to Rotenone 48 hours post-treatment as determined by. Cells were treated with 0.001–0.1 μM of Rotenone and cytotoxicity was determined by lactate dehydrogenase (LDH) cytotoxicity assay, n=4; Brown-Forsythe and Welch ANOVA test. L) Rotenone treatment of JEG-3 cells restricts growth of ZIKV MR-766 strain. JEG-3 cells were infected with ZIKV MR766 (MOI=0.1) and treated with different concentrations of Rotenone or DMSO (control) in culture media as shown. At 48 hpi, culture media was harvested, and virus titer determined by plaque assay on Vero-E6 monolayers (n=3). Data was analyzed by one-way ANOVA and post-hoc Dunnett test. ns=non-statistically significant, *P≤0.05, **P≤ 0.01, ***P≤0.001, ****P≤0.0001.

References

    1. Duffy M. R. et al. Zika virus outbreak on Yap Island, Federated States of Micronesia. N. Engl. J. Med. 360, 2536–2543 (2009). - PubMed
    1. Cao-Lormeau V.-M. et al. Zika virus, French polynesia, South pacific, 2013. Emerg. Infect. Dis. 20, 1085–1086 (2014). - PMC - PubMed
    1. Hu T., Li J., Carr M. J., Duchêne S. & Shi W. The Asian Lineage of Zika Virus: Transmission and Evolution in Asia and the Americas. Virol. Sin. 34, 1–8 (2019). - PMC - PubMed
    1. Moore S. M. et al. Leveraging multiple data types to estimate the size of the Zika epidemic in the Americas. PLoS Negl. Trop. Dis. 14, e0008640 (2020). - PMC - PubMed
    1. Paixao E. S. et al. Population-based surveillance for congenital zika virus syndrome: a latent class analysis of recorded cases from 2015–2018. BMC Pregnancy Childbirth 22, 530 (2022). - PMC - PubMed

Publication types