[Preprint]. 2024 Sep 23:2023.12.08.570803.
doi: 10.1101/2023.12.08.570803.

High-resolution awake mouse fMRI at 14 Tesla

Affiliations

High-resolution awake mouse fMRI at 14 Tesla

David Hike et al. bioRxiv. .

Update in

  • High-resolution awake mouse fMRI at 14 tesla.
    Hike D, Liu X, Xie Z, Zhang B, Choi S, Zhou XA, Liu A, Murstein A, Jiang Y, Devor A, Yu X. Hike D, et al. Elife. 2025 Jan 9;13:RP95528. doi: 10.7554/eLife.95528. Elife. 2025. PMID: 39786364 Free PMC article.

Abstract

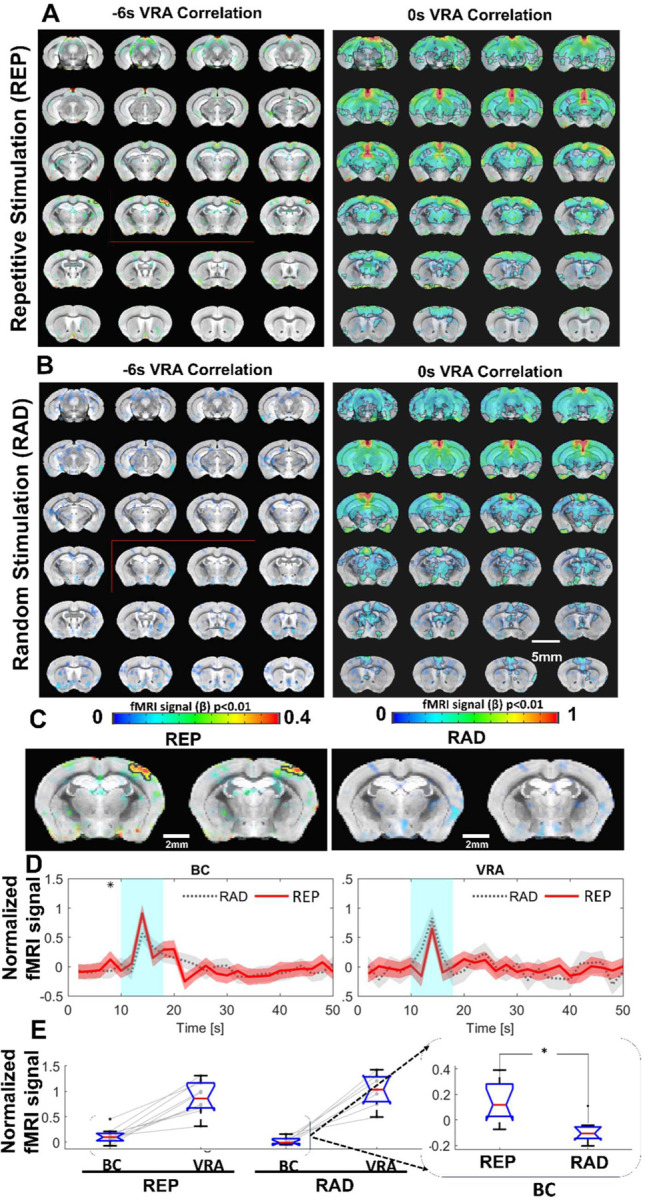
High-resolution awake mouse fMRI remains challenging despite extensive efforts to address motion-induced artifacts and stress. This study introduces an implantable radiofrequency (RF) surface coil design that minimizes image distortion caused by the air/tissue interface of mouse brains while simultaneously serving as a headpost for fixation during scanning. Furthermore, this study provides a thorough acclimation method used to accustom animals to the MRI environment minimizing motion induced artifacts. Using a 14T scanner, high-resolution fMRI enabled brain-wide functional mapping of visual and vibrissa stimulation at 100×100×200μm resolution with a 2s per frame sampling rate. Besides activated ascending visual and vibrissa pathways, robust BOLD responses were detected in the anterior cingulate cortex upon visual stimulation and spread through the ventral retrosplenial area (VRA) with vibrissa air-puff stimulation, demonstrating higher-order sensory processing in association cortices of awake mice. In particular, the rapid hemodynamic responses in VRA upon vibrissa stimulation showed a strong correlation with the hippocampus, thalamus, and prefrontal cortical areas. Cross-correlation analysis with designated VRA responses revealed early positive BOLD signals at the contralateral barrel cortex (BC) occurring 2 seconds prior to the air-puff in awake mice with repetitive stimulation, which was not detected using a randomized stimulation paradigm. This early BC activation indicated a learned anticipation through the vibrissa system and association cortices in awake mice under continuous training of repetitive air-puff stimulation. This work establishes a high-resolution awake mouse fMRI platform, enabling brain-wide functional mapping of sensory signal processing in higher association cortical areas.

Keywords: Awake Mouse; BOLD; Biological Sciences: Neuroscience; fMRI; prediction; vibrissa stimulation; visual stimulation.


Figures

Figure 1.
Figure 1.
A & B show representative (unattached) prototype coils in the single loop and figure 8 styles, respectively. C presents the cortical specific SNR values calculated by dividing the mean signal of the upper cortex by the standard deviation of the noise to compare between commercial Bruker phased array surface coil, single loop implant and “figure 8” style implants. Bruker → commercial phased array coil, IL → implanted single loop coil, IF8 → implanted “figure 8” coil. The bar graph shows the SNR of anatomical images acquired with different RF coils using the 9.4T scanner (SNR¯Bruker=27.2, N = 6, SNR¯IL=57.5, N = 5, SNR¯IF8=142.5, N = 5) and the 14T scanner (SNR¯IL=96.8, N = 4, SNR¯IF8=209.2, N = 5)
Figure 2.
Figure 2.
High resolution awake mouse fMRI at 14T. A. The awake mouse setup with head-fixed position in a custom-built cradle for visual and vibrissa stimulation. B. The representative fMRI time course of an awake mouse based on raw image data acquired from high-resolution EPI, enabling the trace of motion-induced artifacts. C. The anatomical MRI images (FLASH) acquired from one representative awake mouse, showing minimal susceptibility and whole brain coverage from the implanted surface coil. D. The raw EPI fMRI image with same spatial resolution as the anatomical FLASH image. E. The snapshot of the distorted images due to motion of the awake mouse during scanning (Supp Movie 2 shows the video of motion-induced artifacts throughout the fMRI trial).
Figure 3.
Figure 3.
Visual stimulation-evoked high-resolution fMRI of awake mice. A. The brain-wide functional maps of awake mice show strong positive BOLD activation in the visual cortex (VC), lateral geniculate nucleus (LGN), superior colliculus (SC), and anterior cingulate area (ACA)) based on the group analysis. B. The averaged time course of the ROIs derived from the Allan brain atlas, demonstrating an evoked positive BOLD signal changes upon the 8s visual stimulation (5Hz 530nm and 5.1Hz 490nm 20ms light pluses). Each graph displays the average of 162 sets of 3 stimulation epochs. Shaded regions represent standard error. Red lines represent the 8s stimulation duration. C. Functional maps overlain with the brain atlas to highlight the activated brains regions: VC, SC, LGN, and ACA. (N = 13 (6F/7M)).
Figure 4.
Figure 4.
Vibrissa stimulation-evoked high-resolution fMRI of awake mice. A. The brain-wide functional maps of awake mice show the strong positive BOLD activation in the contralateral barrel cortex (BC) and ventral posteromedial nucleus (VPM) and posterior thalamic nucleus (PO). Positive BOLD signals are also detected at the motor cortex (MC) and the ventral retrosplenial area (VRA), as well as at the ipsilateral BC and thalamic nuclei. Negative BOLD signals are detected in supplementary somatosensory areas (SSs) (including nose and mouth) as well as part of the caudoputamen. B. The averaged time course based on the brain atlas ROIs for VMP, BC, and VRA, demonstrating positive BOLD signal changes upon the 8s air-puff vibrissa stimulation (8Hz, 10ms). Averaged time course of the SSs ROI shows negative BOLD signal changes. Each graph displays the average of 279 sets of 3 stimulation epochs. Shaded regions represent standard error. Red lines represent the 8s stimulation duration. C. The functional maps are overlain with the brain atlas to highlight the activated vibrissa thalamocortical pathway (VPM→BC) and the VRA in awake mice. (N = 13 (6F/7M)).
Figure 5.
Figure 5.
VRA-based brain-wide correlation maps at different time shifts. A. The VRA-based correlation maps at −6s and 0s time shifts of awake mice with repetitive stimulation (REP). The strong correlation in the contralateral BC is shown in the correlation map at the −6s time shift (red box). B. The VRA-based correlation maps at −6s and 0s time shifts of awake mice with randomized stimulation (RAD). No correlation is detected in the contralateral BC at the −6s time shift (red box). C. The enlarged images from the −6s time shift correlation maps of REP and RAD groups, demonstrating the strong correlation patterns located at the contralateral BC only in the REP group. D. The averaged time course from both contralateral BC and VRA of REP and RAD groups, showing that early positive BOLD signals detected at 2 s prior to the stimulation in contralateral BC of the REP group and no significance difference detected in VRA. E. The bar graph presents the mean BOLD signals of contralateral BC at 2s prior to stimulation time point and peak signals of VRA in REP and RAD groups. The inset is the expanded bar graph to show the significantly higher BOLD signals detected in the contralateral BC at 2 s prior to stimulation in REP group (p=0.015, REP graph displays the average of 930 stimulation epochs, RAD graph displays the average of 240 stimulation epochs). (N = 9 (4F/5M)).

Similar articles

References

    1. Ogawa S., Lee T. M., Kay A. R., Tank D. W., Brain magnetic resonance imaging with contrast dependent on blood oxygenation. Proc Natl Acad Sci U S A 87, 9868–9872 (1990). - PMC - PubMed
    1. Ogawa S., Lee T. -M, Nayak A. S., Glynn P., Oxygenation-sensitive contrast in magnetic resonance image of rodent brain at high magnetic fields. Magn Reson Med 14, 68–78 (1990). - PubMed
    1. Logothetis N. K., Pauls J., Augath M., Trinath T., Oeltermann A., Neurophysiological investigation of the basis of the fMRI signal. Nature 2001 412:6843 412, 150–157 (2001). - PubMed
    1. Pauling L., Coryell C. D., The Magnetic Properties and Structure of Hemoglobin, Oxyhemoglobin and Carbonmonoxyhemoglobin. Proc Natl Acad Sci U S A 22, 210 (1936). - PMC - PubMed
    1. Ogawa S., et al., Intrinsic signal changes accompanying sensory stimulation: functional brain mapping with magnetic resonance imaging. Proc Natl Acad Sci U S A 89, 5951–5955 (1992). - PMC - PubMed

Publication types