[Preprint]. 2023 Dec 19:2023.12.07.570603.
doi: 10.1101/2023.12.07.570603.

Systematic benchmarking of imaging spatial transcriptomics platforms in FFPE tissues

Affiliations

Systematic benchmarking of imaging spatial transcriptomics platforms in FFPE tissues

Huan Wang et al. bioRxiv. .

Abstract

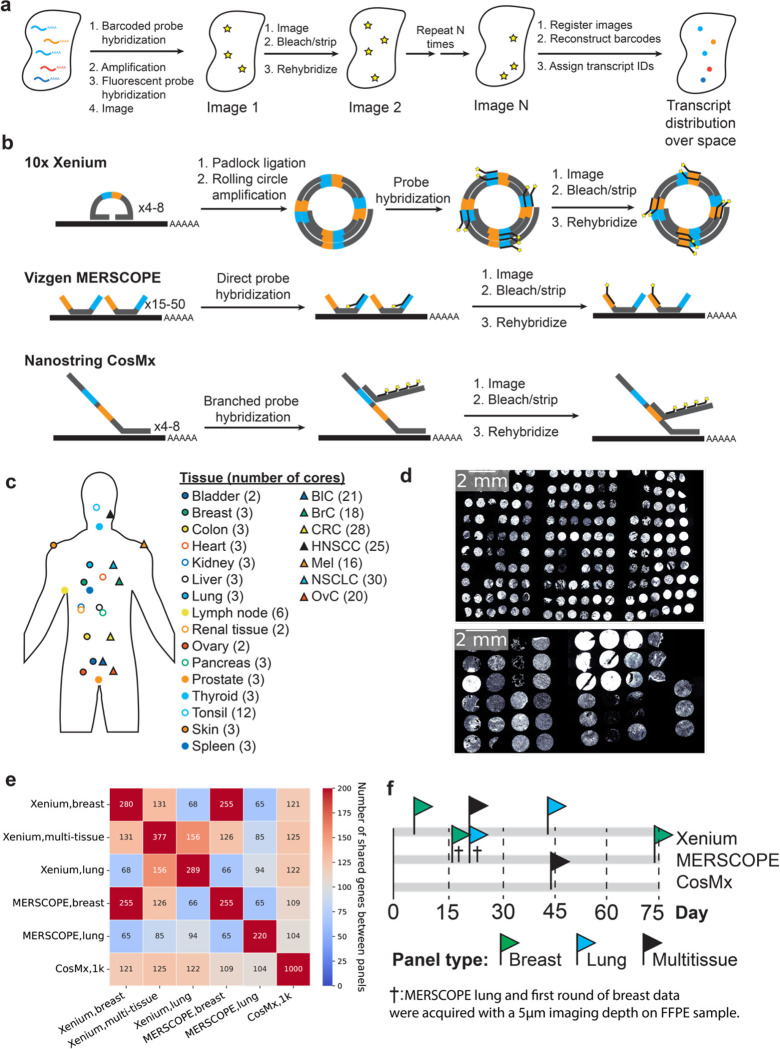
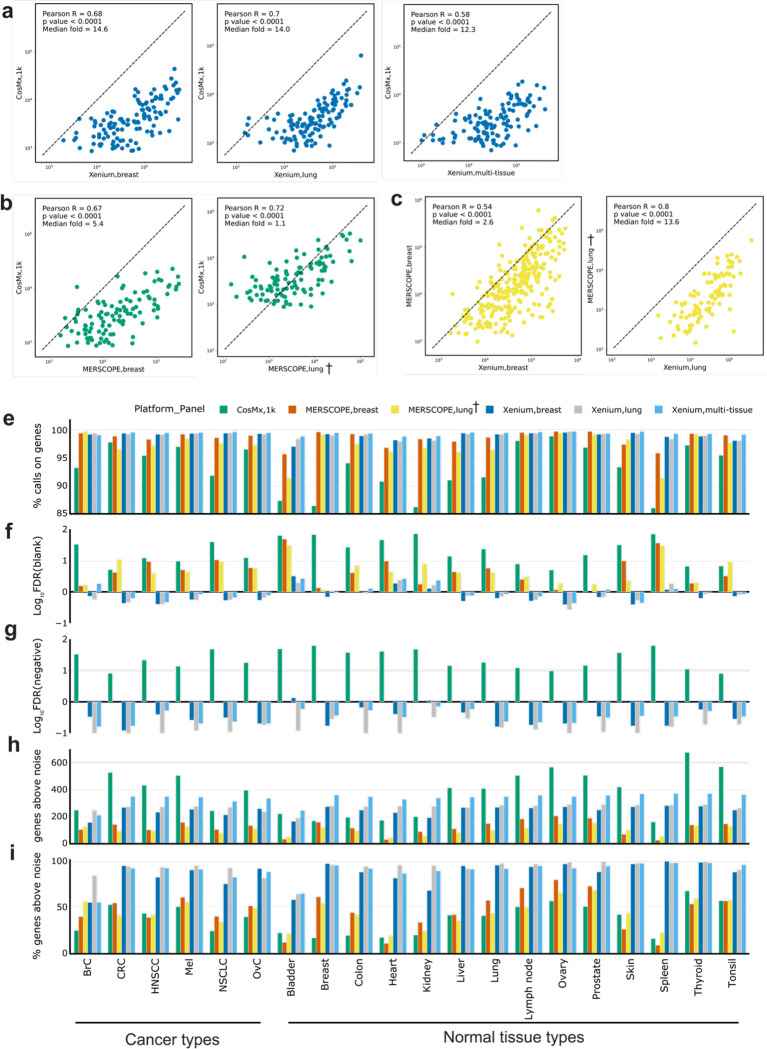
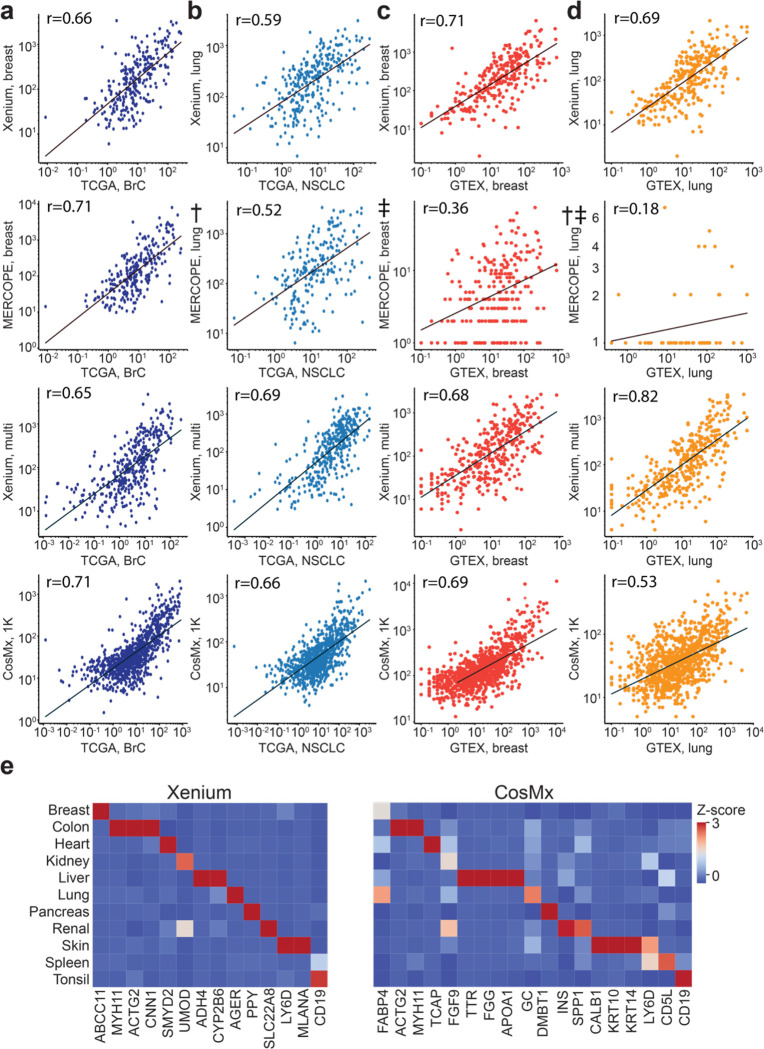
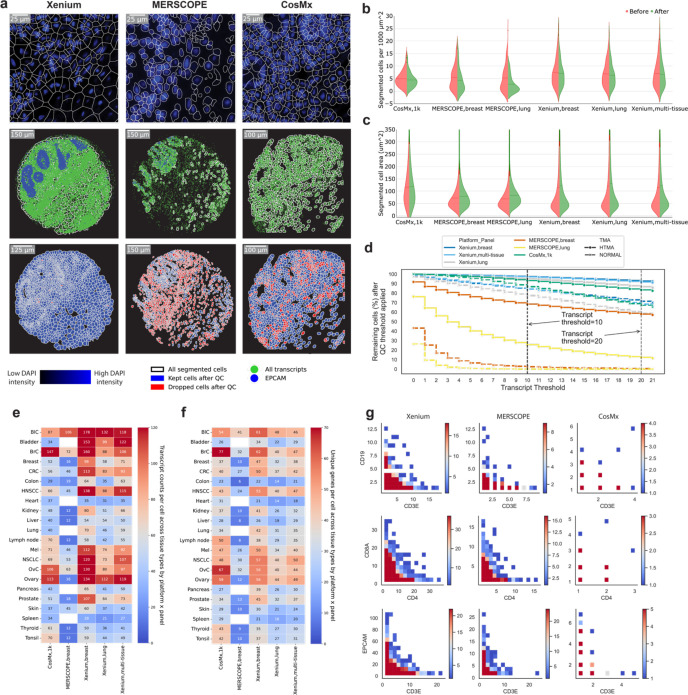
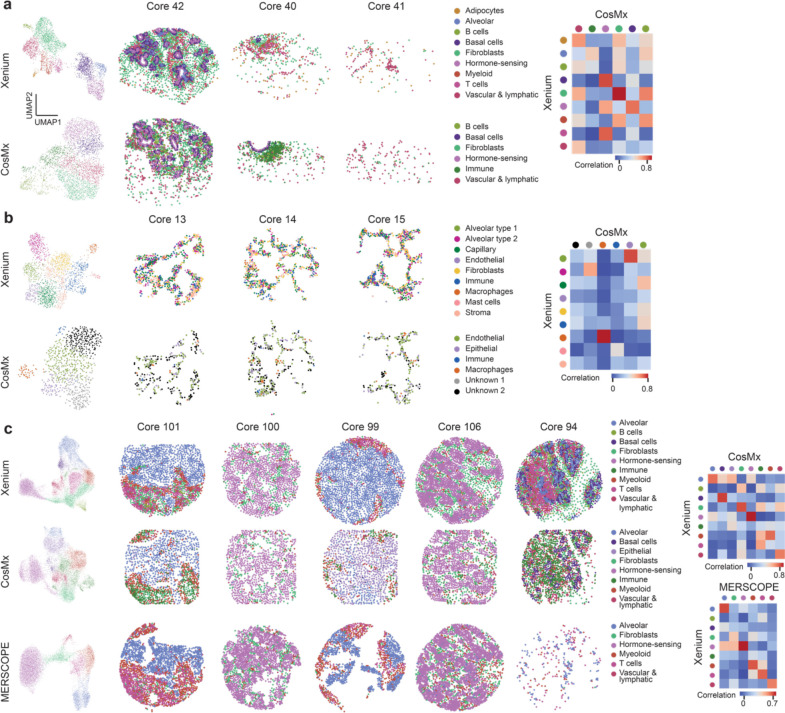
Emerging imaging spatial transcriptomics (iST) platforms and coupled analytical methods can recover cell-to-cell interactions, groups of spatially covarying genes, and gene signatures associated with pathological features, and are thus particularly well-suited for applications in formalin fixed paraffin embedded (FFPE) tissues. Here, we benchmarked the performance of three commercial iST platforms on serial sections from tissue microarrays (TMAs) containing 23 tumor and normal tissue types for both relative technical and biological performance. On matched genes, we found that 10x Xenium shows higher transcript counts per gene without sacrificing specificity, but that all three platforms concord to orthogonal RNA-seq datasets and can perform spatially resolved cell typing, albeit with different false discovery rates, cell segmentation error frequencies, and with varying degrees of sub-clustering for downstream biological analyses. Taken together, our analyses provide a comprehensive benchmark to guide the choice of iST method as researchers design studies with precious samples in this rapidly evolving field.


Conflict of interest statement

Declaration of interests All authors declare that they have no conflicts of interest.

Figures

Figure 1:
Figure 1:. Experimental design and iST platforms.
(a) Overall approach for generating iST data. (b) Different amplification approaches for Xenium, MERSCOPE, and CosMx. (c) Overview of the tissue types and numbers of cores used in this study. BlC = bladder cancer, BrC = breast cancer, CRC = colorectal cancer, HNSCC = head and neck squamous cell carcinoma, Mel = Melanoma, NSCLC = non-small cell lung cancer, OvC = ovarian cancer. (d) DAPI images from the Xenium run of each TMA, including tumors (top) and normal tissues (bottom) (e) The number of common target genes in each panel used in this study. (f) Overall timeline of the imaging days for each study. Day = 0 corresponds to the day of slicing. † denotes the MERSCOPE breast and lung panels acquired with a 5 μm imaging thickness, thinner than manufacturer instructions.
Figure 2:
Figure 2:. Technical performance comparison of iST platforms grouped by tissue types.
(a) Scatter plots of summed gene expression levels (on a logarithmic scale) of every shared gene between Xenium (breast/lung) and CosMx (1k) data, captured from matched tumor TMA cores. Each data point corresponds to a gene. (b) Same as (a) but between MERSCOPE (breast/lung) and CosMx(1k). (c) Same as (a) but between Xenium(breast/lung) and MERSCOPE(breast/lung). (d) Same as (a) but between Xenium(multi-tissue) and CosMx(1k). (e) Bar plot of percentage of all transcripts corresponding to genes relative to the total number of calls (including negative control probes and unused barcodes) averaged across cores of the same tissue type. Results are presented by panel including breast, lung, and multi-tissue panels from Xenium; breast and lung panels from MERSCOPE; and multi-tissue 1k panel from CosMx. (f) Bar plot of false discovery rate (FDR) where FDR(%) = (blank barcode calls / total transcript calls) x (Number of panel genes /Number of blank barcode) x 100. FDR values were log10 transformed to better show the differences between panels. (g) Same as (f) but using negative control probes to replace blank barcodes. MERSCOPE is missing in this bar plot as it does not have negative control probes by design. (h) Bar plot of number of genes detected above noise, estimated as two standard deviations above average of the negative control probes. (i) Same as (h) but normalized to the number of genes in a panel. † denotes the MERSCOPE lung panel acquired with a 5 μm imaging thickness.
Figure 3:
Figure 3:. Concordance of iST data with reference RNA-seq datasets.
(a) Scatter plots of overlapping genes, showing the averaged expression of a gene across breast cancer cores profiled by the indicated panel, normalized to 100,000 vs the average FPKM from TCGA for all samples of a matched tissue type (BRCA). (b) Same as (a) but for lung cancer cores plotted vs averaged LUAD and LUSC samples from TCGA. (c) Same as (a) but showing breast cores vs averaged nTPM values from GTEx breast samples. (d) Same as (a) but for lung cores and samples. † denotes the MERSCOPE lung data acquired with a 5-μm imaging depth on FFPE sample. ‡ denotes the normal tissue TMA data of MERSCOPE which failed initial QC. (e) Heatmap of Z-scored average gene expression for several canonical marker genes in the indicated tissue cores for the Xenium multi-tissue panel (left) and CosMx 1K panel (right).
Figure 4:
Figure 4:. Comparison of cell segmentation results from each iST platform.
(a) Top row: DAPI image overlaid with cell segmentation boundaries (subset). Middle row: all the transcripts in green dots, white lines for the cell boundaries, and EPCAM in blue dots. Bottom row: segmented cell boundaries before and after filtration. (b) Violin plot of segmented cells per unit area before (left half) and after filtration (right half) grouped by panel with tumor and normal TMA data combined. (c) Same as (b) but showing cell areas before and after filtration. (d) Line plot showing remaining cells in percentage after filtering with various thresholds (transcripts per cell). Dotted lines indicate selected thresholds: 10 transcripts or above for Xenium and MERSCOPE and 20 for CosMx. (e) Heatmap of transcripts per cell after filtration. All available genes are considered here for each panel. MERSCOPE lung panel (5 μm) was excluded from this heatmap. (f) Same as (e) but showing unique genes per cell. (g) Co-expression density map for three pairs of disjoint genes (rows) from all three platforms (columns). All cells across all tissues which include at least one detected transcript of either of the indicated genes are plotted together, with color indicating the number of cells at the indicated expression levels of each gene.
Figure 5:
Figure 5:. Cell type recovery performance across technology.
(a) Clustering results of breast samples in normal TMA from Xenium breast panel and CosMx multi-tissue panel. Correlation plot showing the correlation between cell types identified. (b) Clustering results of lung samples in normal TMA from Xenium lung panel and CosMx multi-tissue panel. Correlation plot showing the correlation between cell types identified. (c) Clustering results of breast cancer samples in tumor TMA from Xenium breast panel, MERFISH breast panel, and CosMx multi-tissue panel. Correlation plot showing the correlation between cell types identified in CosMx and Xenium as well as MERFISH and Xenium.

References

    1. Chen W.T., Lu A. Croissants K. et al. Spatial Transcriptomics and In Situ Sequencing to Study Alzheimer’s Disease. Cell. 182 (4), 976–991 (2020). - PubMed
    1. Hunter M.V., Moncada R., Weiss J.M. et al. Spatially resolved transcriptomics reveals the architecture of the tumor-microenvironment interface. Nat Commun 12, 6278 (2021). - PMC - PubMed
    1. Lein E, Borm LE, Linnarsson S. The promise of spatial transcriptomics for neuroscience in the era of molecular cell typing. Science. 2017. Oct 6;358(6359):64–69. - PubMed
    1. Lewis SM, Asselin-Labat ML, Nguyen Q, et al. Spatial omics and multiplexed imaging to explore cancer biology. Nat Methods. 2021. Sep;18(9):997–1012. - PubMed
    1. Rao A., Barkley D., França G.S. et al. Exploring tissue architecture using spatial transcriptomics. Nature 596, 211–220 (2021). - PMC - PubMed

Publication types