. 2023 Dec 1;13(12):7680-7694.
doi: 10.21037/qims-23-163. Epub 2023 Nov 7.

Tensor radiomics: paradigm for systematic incorporation of multi-flavoured radiomics features

Affiliations

Tensor radiomics: paradigm for systematic incorporation of multi-flavoured radiomics features

Arman Rahmim et al. Quant Imaging Med Surg. .

Abstract

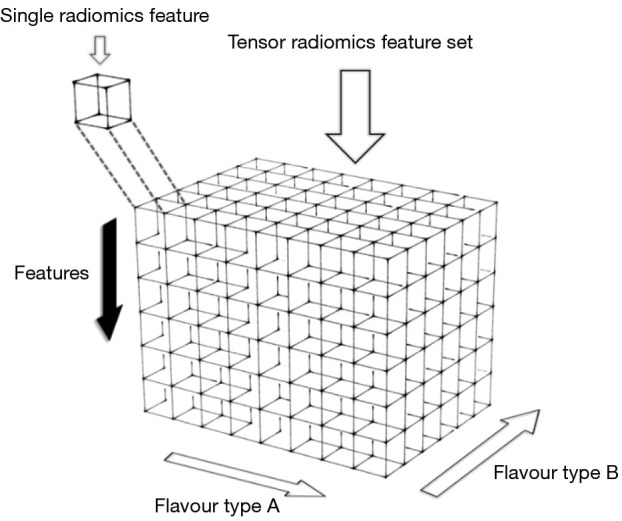
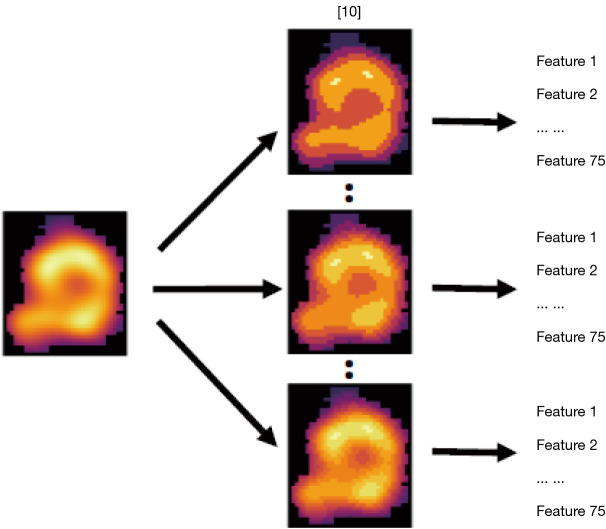
Background: Radiomics features hold significant value as quantitative imaging biomarkers for diagnosis, prognosis, and treatment response assessment. To generate radiomics features and ultimately develop signatures, various factors can be manipulated, including image discretization parameters (e.g., bin number or size), convolutional filters, segmentation perturbation, or multi-modality fusion levels. Typically, only one set of parameters is employed, resulting in a single value or "flavour" for each radiomics feature. In contrast, we propose "tensor radiomics" (TR) where tensors of features calculated using multiple parameter combinations (i.e., flavours) are utilized to optimize the creation of radiomics signatures.

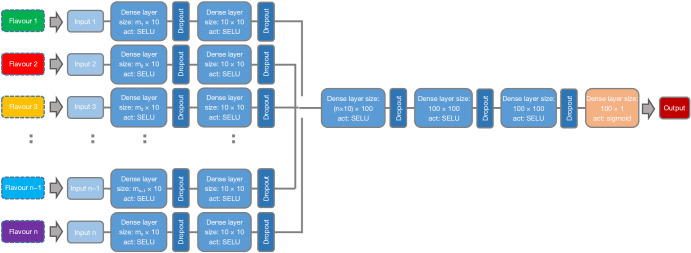
Methods: We provide illustrative instances of TR implementation in positron emission tomography-computed tomography (PET-CT), magnetic resonance imaging (MRI), and CT by leveraging machine learning (ML) and deep learning (DL) methodologies, as well as reproducibility analyses: (I) to predict overall survival (OS) in lung cancer (CT) and head and neck cancer (PET-CT), TR was employed by varying bin sizes. This approach involved use of a hybrid deep neural network called 'TR-Net' and two ML-based techniques for combining different flavours. (II) TR was constructed by incorporating different segmentation perturbations and various bin sizes to classify the response of late-stage lung cancer to first-line immunotherapy using CT images. (III) In MRI of glioblastoma (GBM), TR was implemented to generate multi-flavour radiomics features, enabling enhanced analysis and interpretation. (IV) TR was employed via multiple PET-CT fusions in head and neck cancer. Flavours based on different fusions were created using Laplacian pyramids and wavelet transforms.

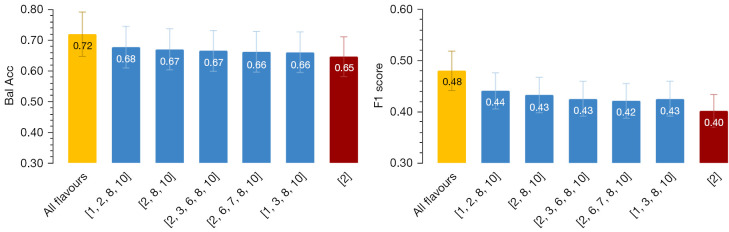
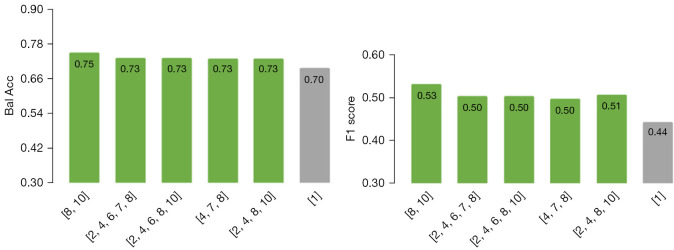
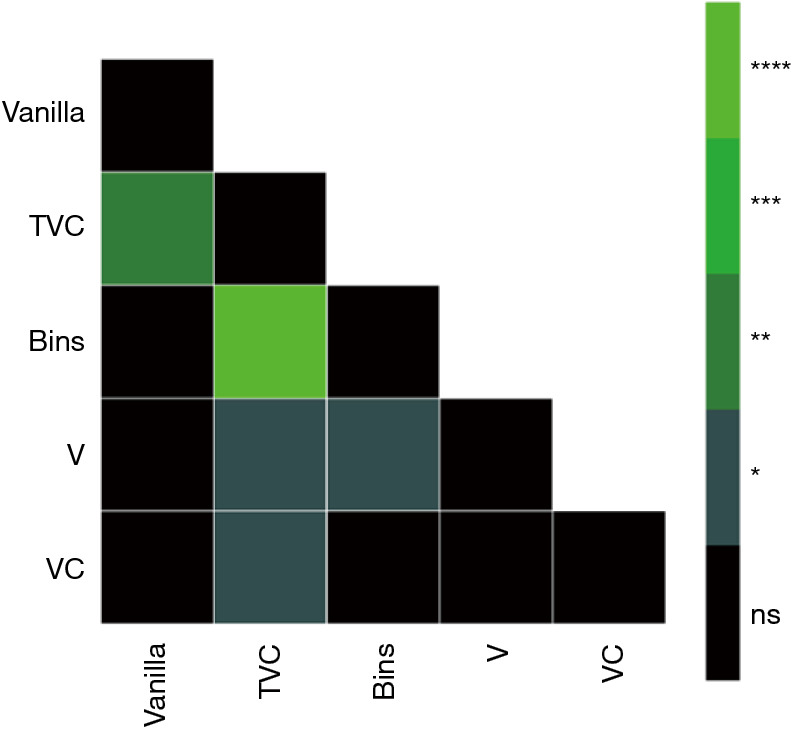
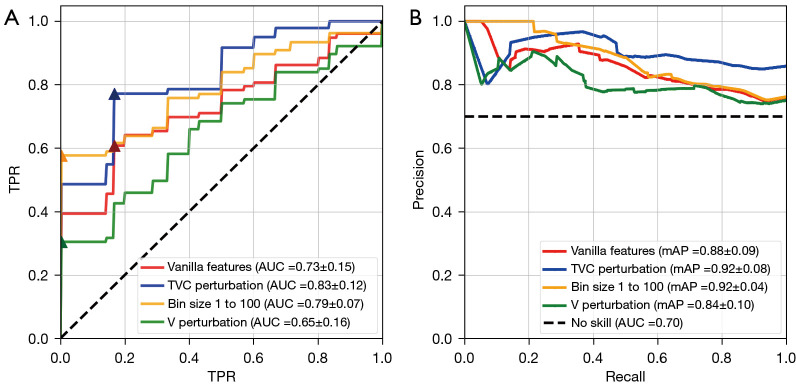
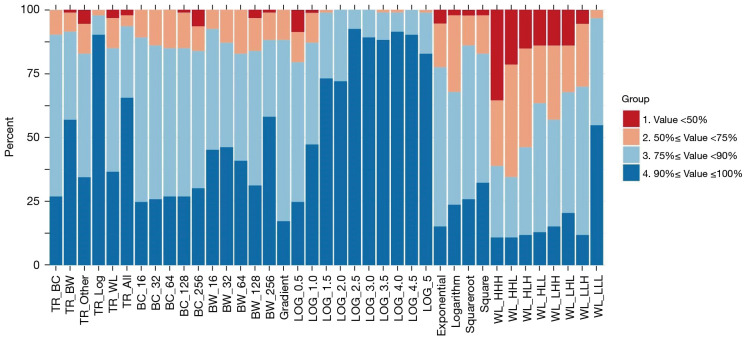
Results: Our findings demonstrated that TR outperformed conventional radiomics features in lung cancer CT and head and neck cancer PET-CT images, significantly enhancing OS prediction accuracy. TR also improved classification of lung cancer response to therapy and exhibited notable advantages in reproducibility compared to single-flavour features in MR imaging of GBM. Moreover, in head and neck cancer, TR through multiple PET-CT fusions exhibited improved performance in predicting OS.

Conclusions: We conclude that the proposed TR paradigm has significant potential to improve performance in different medical imaging tasks. By incorporating multiple flavours of radiomics features, TR overcomes limitations associated with individual features and shows promise in enhancing prognostic capabilities in clinical settings.

Keywords: Imaging biomarkers; image fusion; machine learning (ML); outcome/disease prediction; radiomics.


Conflict of interest statement

Conflicts of Interest: All authors have completed the ICMJE uniform disclosure form (available at https://qims.amegroups.com/article/view/10.21037/qims-23-163/coif). A.R. reports that this work was in part supported by the Natural Sciences and Engineering Research Council of Canada (NSERC) Discovery Grant (No. RGPIN-2019-06467), the Canadian Institutes of Health Research (CIHR) Project Grants (Nos. PJT-162216 and PJT-173231), and the BC Cancer Foundation. H.Z. reports that this work was in part supported by the Swiss National Science Foundation Grant (No. SNRF 320030_176052). C.H. has received honoraria paid to self from Abbvie, Amgen, AstraZeneca, Bayer, BMS, Eisai, Jazz, Janssen, Merck, Novartis, Pfizer, Roche, Sanofi and research grants paid to the institution from AstraZeneca and Roche. A.R. and C.U. are cofounders of Ascinta technologies Inc. The other authors have no conflicts of interest to declare.

Figures

Figure 1
Figure 1
A representation of a radiomics tensor. The black arrow indicates the dimension where the different extracted radiomics features are stacked, while the flavour types (A, B, ...) encompass variations by which feature values are generated: examples include variations in discretization bin sizes, segmentations, pre-processing filters and fusion methods. Only two variants can be represented here in 3D, but even higher dimension tensors can be generated.
Figure 2
Figure 2
Radiomics features calculated on PET-CT images from head and neck data. 10 ‘bin flavours’ calculated by using different discretization strategies to extract 75 features. PET, positron emission tomography; CT, computed tomography.
Figure 3
Figure 3
The architecture for our TR-Net. Features of a given flavour are input into the ‘legs’ of the network, which work to extract and combine the most effective features. The various flavour legs are then concatenated and put through several final layers before producing a binary prediction. SELU, scaled exponential linear unit; TR-Net, tensor radiomics network.
Figure 4
Figure 4
Balanced accuracy (left) and f1 score values (right) when using conventional radiomics (single-flavour) using ML pipeline (red), 5 different combinations of TR flavours using ML pipelines (blue), and all 10 TR-flavours of features via DL TR-Net pipeline (yellow). All features were used (no features selection methods were applied prior). ML, machine learning; TR, tensor radiomics; DL, deep learning.
Figure 5
Figure 5
Balanced accuracy (left) and f1 score values when using feature selection (right), prior to applying conventional radiomics (single-flavour) (gray) vs. TR (multi-flavours) (green). TR, tensor radiomics.
Figure 6
Figure 6
Significance matrix of five discrete LDA models in predicting treatment response to single agent pembrolizumab in late-stage NSCLC patients using radiomic features. Each model was trained with a unique feature set (image and segmentation flavours). McNemar’s test was applied to test the significance between model performances shown in the matrix (color) to the right. ns, not significant, *, 0.01
Figure 7
Figure 7
Model performance plots for four discrete LDA models. (A) ROC curve plot highlighting model performance with the addition of feature flavour segmentations. TVC perturbations achieved the highest ROC AUC =0.83±0.12, SN: 77.9%, SP: 83.2% at optimal threshold (triangle marker). (B) Precision-recall curve to elucidate model performance for this class imbalanced dataset. Both plots indicate a strong boost to performance of the model by implementing TR feature methods. TPR, true positive rate; FPR, false positive rate; LDA, linear discriminant analysis; ROC, receiver operator characteristic; TVC, combination of image translation (T), segmentation volume adaptation (V) and contour randomization (C); mAP, mean average precision; AUC, area under the cure; SN, sensitivity; SP, specificity; TR, tensor radiomics.
Figure 8
Figure 8
The test-retest repeatability of radiomics features in MR imaging of GBM (ICC used as metric). Proposed TR-generated features (via PCA) are compared to conventional individual flavours of these features. TR, tensor radiomics; BC, bin counts; BW, bin widths; LOG, Laplacian of Gaussian; WL, wavelets; H, high; L, low; MR, magnetic resonance; GBM, glioblastoma; ICC, intra-class correlation; PCA, principal component analysis.
Figure 9
Figure 9
Bar plots of mean and standard deviation for prediction of outcome for nested testing performance. X axis: conventional radiomics (PET-only, CT-only, 15 fused PET-CT images), as well as proposed Fusion-TR, using 3 different classifiers. MLP, multi-layer perceptron; LP, Laplacian pyramid; RP, ratio of low-pass pyramid; DWT, discrete wavelet transform; DTCWT, dual-tree complex wavelet transform; CVT, curvelet transform; NSCT, nonsubsampled contourlet transform; SR, sparse representation; BCF, bilateral cross filter; HSI, hue, saturation, and intensity; PCA, principal component analysis; PET, positron emission tomography; CT, computed tomography; TR, tensor radiomics.

References

    1. Gillies RJ, Anderson AR, Gatenby RA, Morse DL. The biology underlying molecular imaging in oncology: from genome to anatome and back again. Clin Radiol 2010;65:517-21. 10.1016/j.crad.2010.04.005 - DOI - PMC - PubMed
    1. van Timmeren JE, Cester D, Tanadini-Lang S, Alkadhi H, Baessler B. Radiomics in medical imaging-”how-to” guide and critical reflection. Insights Imaging 2020;11:91. 10.1186/s13244-020-00887-2 - DOI - PMC - PubMed
    1. Orlhac F, Nioche C, Klyuzhin I, Rahmim A, Buvat I. Radiomics in PET Imaging:: A Practical Guide for Newcomers. PET Clin 2021;16:597-612. 10.1016/j.cpet.2021.06.007 - DOI - PubMed
    1. Koçak B, Durmaz EŞ, Ateş E, Kılıçkesmez Ö. Radiomics with artificial intelligence: a practical guide for beginners. Diagn Interv Radiol 2019;25:485-95. 10.5152/dir.2019.19321 - DOI - PMC - PubMed
    1. Zwanenburg A, Vallières M, Abdalah MA, Aerts HJWL, Andrearczyk V, Apte A, et al. The Image Biomarker Standardization Initiative: Standardized Quantitative Radiomics for High-Throughput Image-based Phenotyping. Radiology 2020;295:328-38. 10.1148/radiol.2020191145 - DOI - PMC - PubMed