

Intelligent prognosis evaluation system for stage I-III resected non-small-cell lung cancer patients on CT images: a multi-center study
- PMID: 38106558
- PMCID: PMC10725055
- DOI: 10.1016/j.eclinm.2023.102270
Intelligent prognosis evaluation system for stage I-III resected non-small-cell lung cancer patients on CT images: a multi-center study
Abstract
Background: Prognosis is crucial for personalized treatment and surveillance suggestion of the resected non-small-cell lung cancer (NSCLC) patients in stage I-III. Although the tumor-node-metastasis (TNM) staging system is a powerful predictor, it is not perfect enough to accurately distinguish all the patients, especially within the same TNM stage. In this study, we developed an intelligent prognosis evaluation system (IPES) using pre-therapy CT images to assist the traditional TNM staging system for more accurate prognosis prediction of resected NSCLC patients.
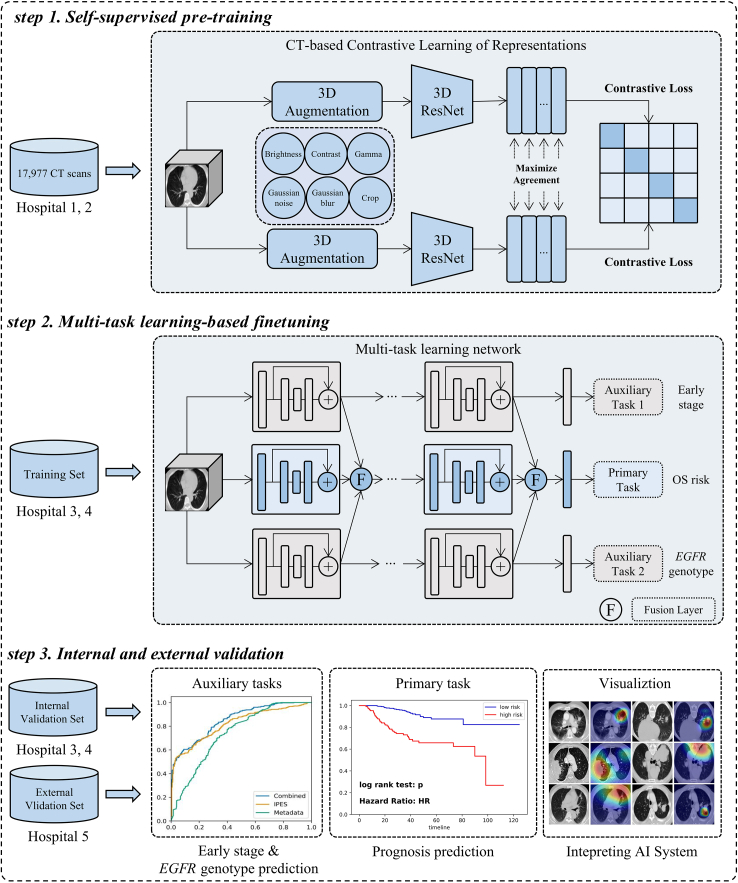
Methods: 20,333 CT images of 6371 patients from June 12, 2009 to March 24, 2022 in West China Hospital of Sichuan University, Mianzhu People's Hospital, Peking University People's Hospital, Chengdu Shangjin Nanfu Hospital and Guangan Peoples' Hospital were included in this retrospective study. We developed the IPES based on self-supervised pre-training and multi-task learning, which aimed to predict an overall survival (OS) risk for each patient. We further evaluated the prognostic accuracy of the IPES and its ability to stratify NSCLC patients with the same TNM stage and with the same EGFR genotype.
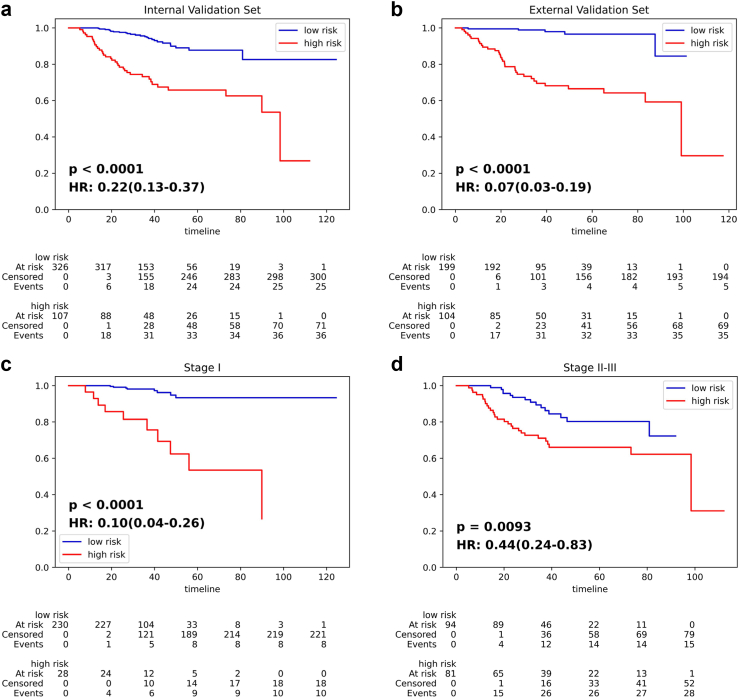
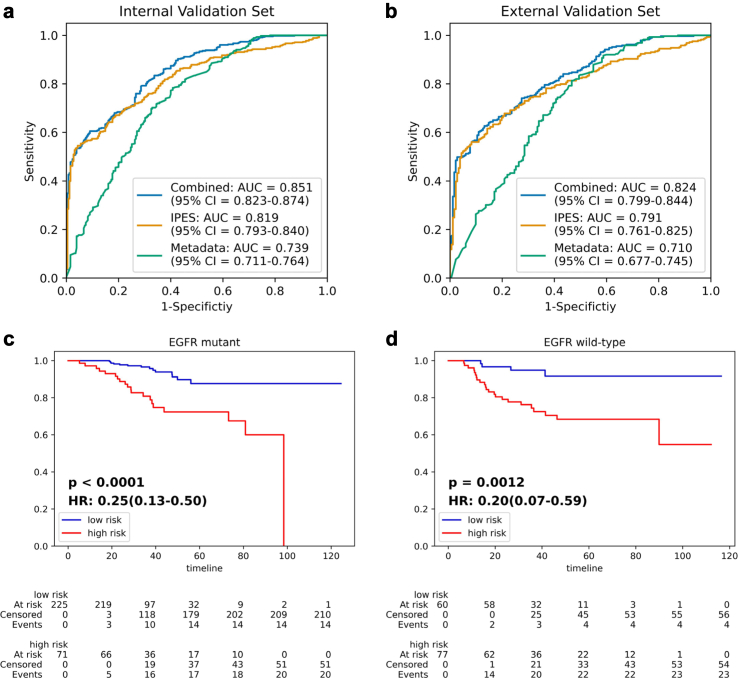
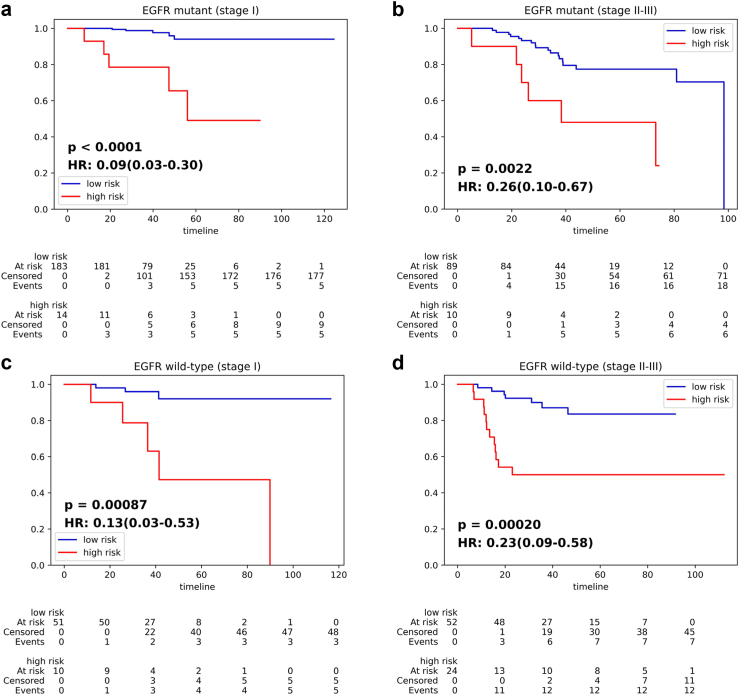
Findings: The IPES was able to predict OS risk for stage I-III resected NSCLC patients in the training set (C-index 0.806; 95% CI: 0.744-0.846), internal validation set (0.783; 95% CI: 0.744-0.825) and external validation set (0.817; 95% CI: 0.786-0.849). In addition, IPES performed well in early-stage (stage I) and EGFR genotype prediction. Furthermore, by adopting IPES-based survival score (IPES-score), resected NSCLC patients in the same stage or with the same EGFR genotype could be divided into low- and high-risk subgroups with good and poor prognosis, respectively (p < 0.05 for all).
Interpretation: The IPES provided a non-invasive way to obtain prognosis-related information from patients. The identification of IPES for resected NSCLC patients with low and high prognostic risk in the same TNM stage or with the same EGFR genotype suggests that IPES have potential to offer more personalized treatment and surveillance suggestion for NSCLC patients.
Funding: This study was funded by the National Natural Science Foundation of China (grant 62272055, 92259303, 92059203), New Cornerstone Science Foundation through the XPLORER PRIZE, Young Elite Scientists Sponsorship Program by CAST (2021QNRC001), Clinical Medicine Plus X - Young Scholars Project, Peking University, the Fundamental Research Funds for the Central Universities (K.C.), Research Unit of Intelligence Diagnosis and Treatment in Early Non-small Cell Lung Cancer, Chinese Academy of Medical Sciences (2021RU002), BUPT Excellent Ph.D. Students Foundation (CX2022104).
Keywords: CT image; Multi-task learning; Prognosis; Resected NSCLC; Self-supervised pre-training.
© 2023 The Author(s).
Conflict of interest statement
The authors have declared no conflicts of interest.
Figures
Similar articles
-
A deep learning-based system for survival benefit prediction of tyrosine kinase inhibitors and immune checkpoint inhibitors in stage IV non-small cell lung cancer patients: A multicenter, prognostic study.EClinicalMedicine. 2022 Jul 1;51:101541. doi: 10.1016/j.eclinm.2022.101541. eCollection 2022 Sep. EClinicalMedicine. 2022. PMID: 35813093 Free PMC article.
-
Development and Validation of an Immune-Based Prognostic Risk Score for Patients With Resected Non-Small Cell Lung Cancer.Front Immunol. 2022 Mar 23;13:835630. doi: 10.3389/fimmu.2022.835630. eCollection 2022. Front Immunol. 2022. PMID: 35401554 Free PMC article.
-
Development and validation of an integrated system for lung cancer screening and post-screening pulmonary nodules management: a proof-of-concept study (ASCEND-LUNG).EClinicalMedicine. 2024 Aug 3;75:102769. doi: 10.1016/j.eclinm.2024.102769. eCollection 2024 Sep. EClinicalMedicine. 2024. PMID: 39165498 Free PMC article.
-
The Impact of Programmed Death-Ligand 1 Expression on the Prognosis of Early Stage Resected Non-Small Cell Lung Cancer: A Meta-Analysis of Literatures.Front Oncol. 2021 Feb 23;11:567978. doi: 10.3389/fonc.2021.567978. eCollection 2021. Front Oncol. 2021. PMID: 33708622 Free PMC article.
-
Pretherapeutic evaluation of patients with upper gastrointestinal tract cancer using endoscopic and laparoscopic ultrasonography.Dan Med J. 2012 Dec;59(12):B4568. Dan Med J. 2012. PMID: 23290296 Review.
Cited by
-
China Protocol for early screening, precise diagnosis, and individualized treatment of lung cancer.Signal Transduct Target Ther. 2025 May 27;10(1):175. doi: 10.1038/s41392-025-02256-1. Signal Transduct Target Ther. 2025. PMID: 40425545 Free PMC article. Review.
-
Survival guided adaptive clustering enhances mortality risk stratification and radiotherapy guidance in early stage uterine sarcoma.Sci Rep. 2025 Jul 25;15(1):27055. doi: 10.1038/s41598-025-13139-4. Sci Rep. 2025. PMID: 40715603 Free PMC article.
-
A multimodal integration pipeline for accurate diagnosis, pathogen identification, and prognosis prediction of pulmonary infections.Innovation (Camb). 2024 May 22;5(4):100648. doi: 10.1016/j.xinn.2024.100648. eCollection 2024 Jul 1. Innovation (Camb). 2024. PMID: 39021525 Free PMC article.
References
-
- Goldstraw P., Chansky K., Crowley J., et al. The IASLC lung cancer staging project proposals for revision of the TNM stage grouping in the forthcoming (eighth) edition of the TNM classification for lung cancer. J Thorac Oncol. 2016;11:39–51. - PubMed
-
- Pignon J.P., Tribodet H., Scagliotti G.V., Douillard J.Y., Chevalier T.L. Lung adjuvant cisplatin evaluation: a pooled analysis by the LACE Collaborative Group. J Clin Oncol. 2008;26:3552–3559. - PubMed
-
- Liu S.Y., Zhang J.T., Zeng K.H., Wu Y.L. Perioperative targeted therapy for oncogene-driven NSCLC. Lung Cancer. 2022;172:160–169. - PubMed
-
- Travis W.D., Brambilla E., Nicholson A.G., et al. The 2015 world health organization classification of lung tumors: impact of genetic, clinical and radiologic advances since the 2004 classification. J Thorac Oncol. 2015;10:1243–1260. - PubMed
LinkOut - more resources
Full Text Sources
Research Materials
Miscellaneous
