. 2023 Dec 15:577:739932.
doi: 10.1016/j.aquaculture.2023.739932.

Hydrogen peroxide as a mitigation against Microcystis sp. bloom

Affiliations

Hydrogen peroxide as a mitigation against Microcystis sp. bloom

Pok Him Ng et al. Aquaculture. .

Erratum in

Abstract

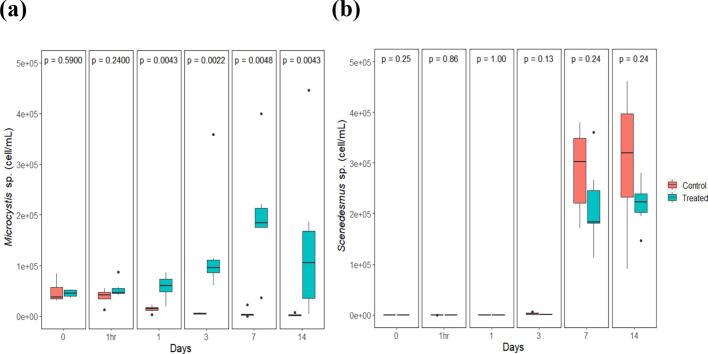
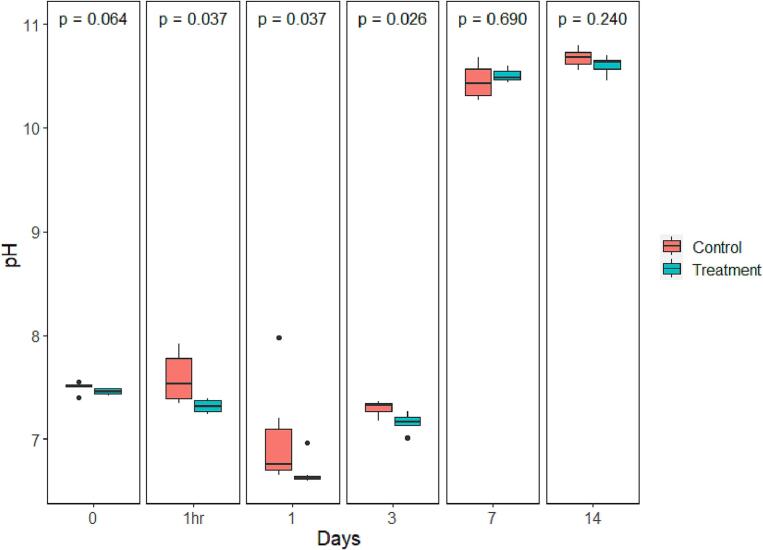
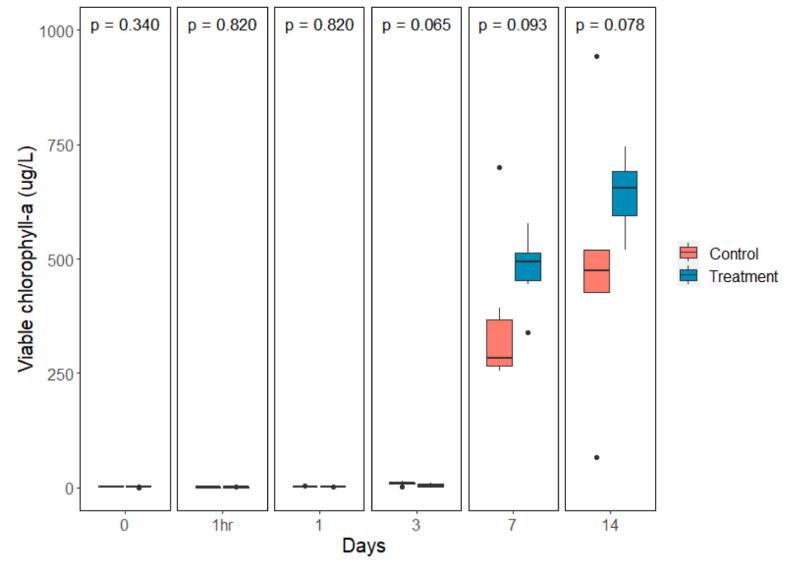
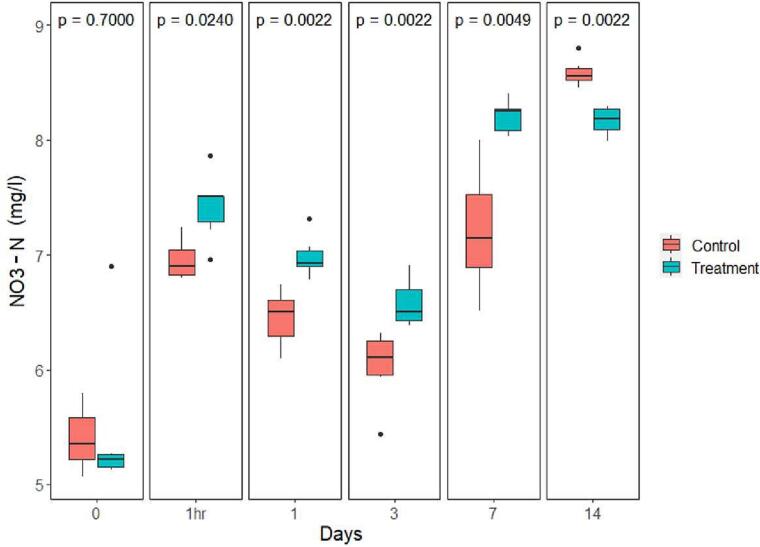
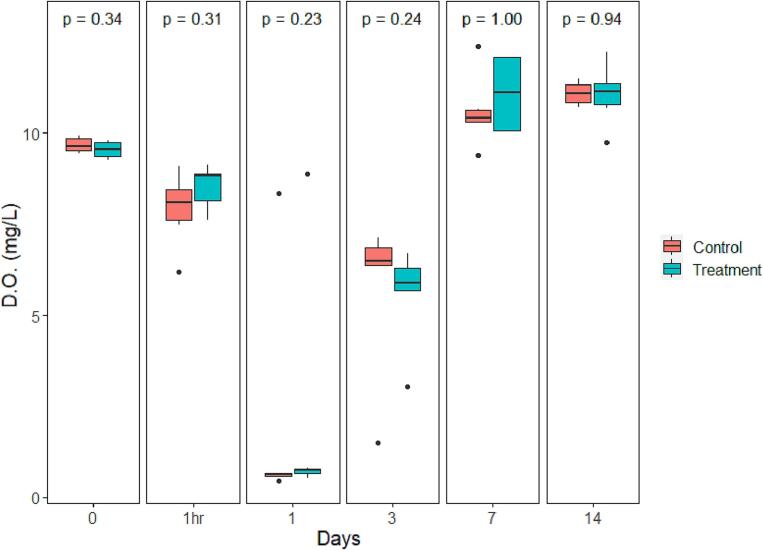
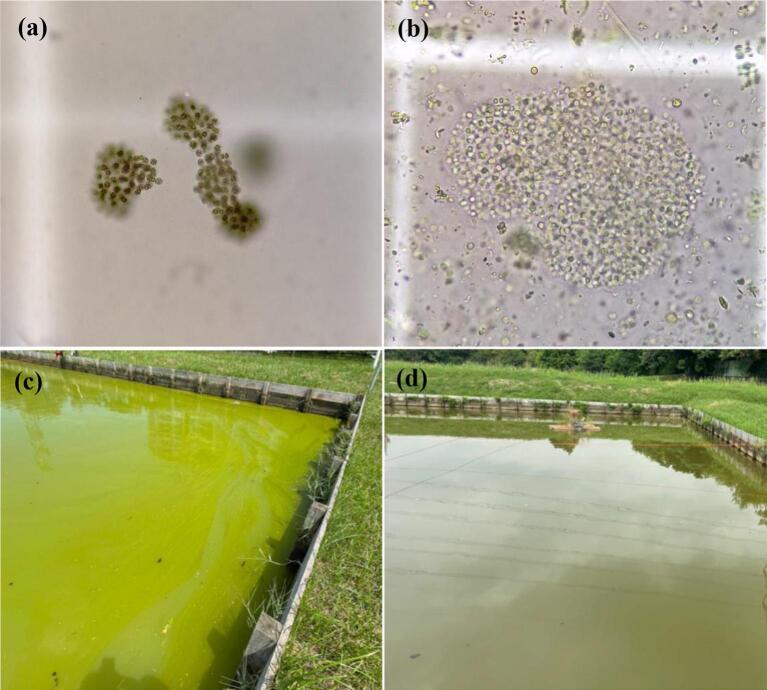
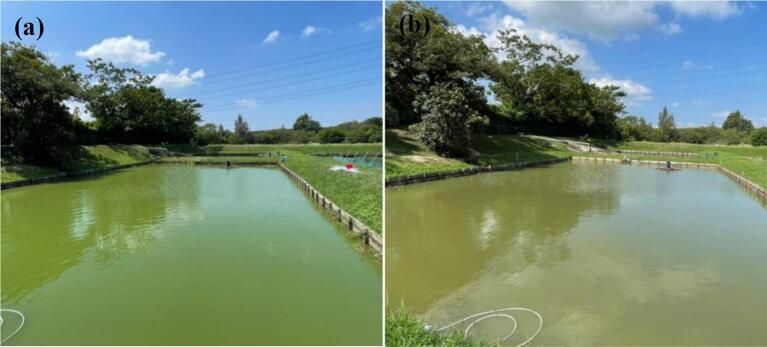
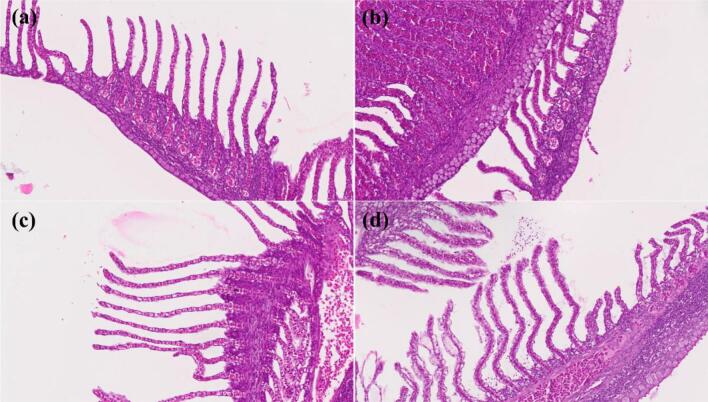
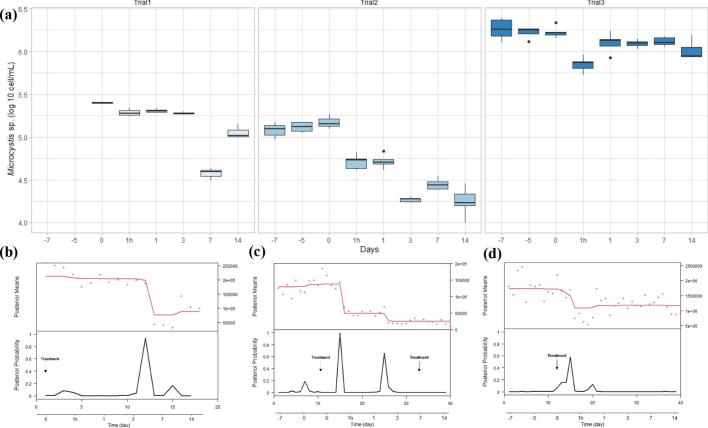
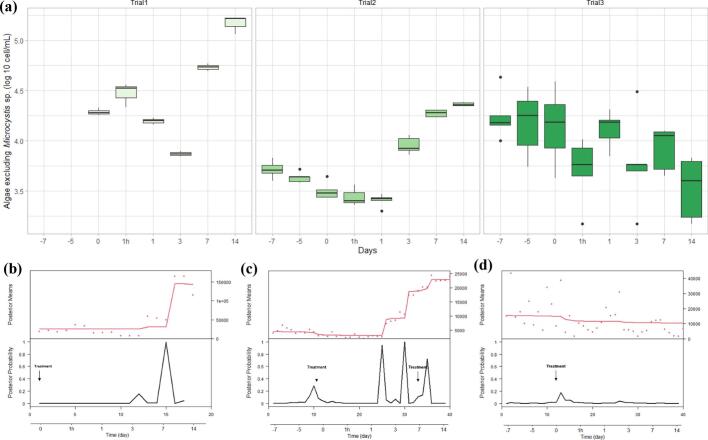
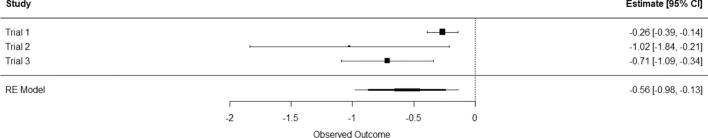
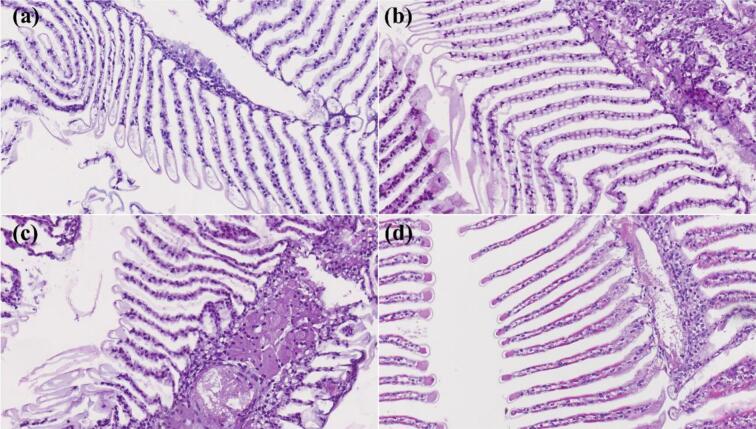
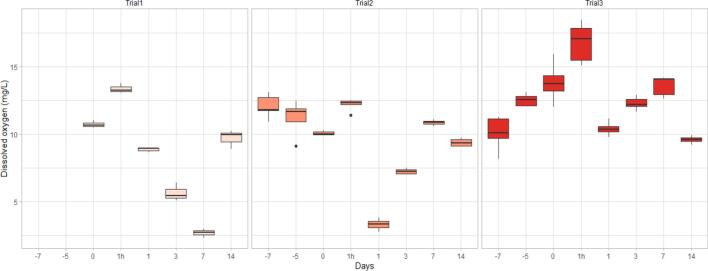
Microcystis sp. is a harmful cyanobacterial species commonly seen in earthen ponds. The overgrowth of these algae can lead to fluctuations in water parameters, including DO and pH. Also, the microcystins produced by these algae are toxic to aquatic animals. This study applied hydrogen peroxide (7 mg/L) to treat Microcystis sp. in a laboratory setting and in three earthen pond trials. In the lab we observed a 64.7% decline in Microcystis sp. And in our earthen pond field experiments we measured, on average, 43% reductions in Microcystis sp. cell counts within one hour. The treatment was found to eliminate specifically Microcystis sp. and did not reduce the cell count of the other algae species in the pond. A shift of the algae community towards the beneficial algae was also found post-treatment. Lastly, during the pond trials, the gill status of Tilapia and Giant tiger prawn were not affected by the H2O2 treatment suggesting this may be a good mitigation strategy for reducing cyanobacteria in pond aquaculture.

Keywords: Aquaculture; Harmful algal bloom; Hydrogen peroxide; Pond water.


Conflict of interest statement

The authors declare the following financial interests/personal relationships which may be considered as potential competing interests: POK HIM NG reports financial support and equipment, drugs, or supplies were provided by Agriculture, Fisheries and Conservation Department (AFCD), Hong Kong SAR, China.

Figures

Fig. 1
Fig. 1
Floating hydrogen peroxide dosing device used for the even distribution of the H2O2 treatment to the targeted pond.
Fig. 2
Fig. 2
(a) Microcystis sp. cell counts over time in the control and treatment groups presented in box plots with median and 25–75 percentiles. The lines represent all the data range except extreme values, which are depicted with dots. P-value associated with the Wilcoxon rank-sum test indicated at the top of the panel. (b) Box plots of Scenedesmus sp. cell counts over time in the control and treatment groups with P-value associated with the Wilcoxon rank- sum test indicated at the top of the panel.
Fig. 3
Fig. 3
pH value comparison between the control and treatment group over time presented in box plots with median and 25–75 percentiles, the lines represent all the data range except extreme values, which are depicted with dots. P- value of comparison test is found at the top of the panel.
Fig. 4
Fig. 4
Viable chlorophyll-a concentration comparison in the control and treatment groups over time presented in box plots with median and 25–75 percentiles, the lines represent all the data range except extreme values, which are depicted with dots. P-value of comparison test is found at the top of the panel.
Fig. 5
Fig. 5
Nitrate-N concentration comparison between the control and treatment group over time presented in box plots with median and 25–75 percentiles, the lines represent all the data range except extreme values, which are depicted with dots. P-value of comparison test is found at the top of the panel.
Fig. 6
Fig. 6
Dissolved oxygen concentration comparison between the control and treatment group over time presented in box plots with median and 25–75 percentiles, the lines represent all the data range except extreme values, which are depicted with dots. P-value of comparison test is found at the top of the panel.
Fig. 7
Fig. 7
The appearance of the (a) Microcystis sp. colony under the light microscope before the treatment and (b) 7 days after the treatment. The appearance of the pond (c) before the treatment and (d) 7 days after the treatment.
Fig. 8
Fig. 8
The appearance of the pond (a) before the treatment and (b) 1 day after the treatment.
Fig. 9
Fig. 9
Jade perch H&E stained slides observed under the light microscope (20×). (a) Day 0, (b) 1 h post treatment, (c) Day 1, (d) Day 14.
Fig. 10
Fig. 10
Log 10 counts of Microcystis sp. presented in box plots with median and 25–75 percentiles, the lines represent all the data range except extreme values, which are depicted with dots. (a) and change point analysis results, in the first (b), second (c) and third (d) pond trial, respectively.
Fig. 11
Fig. 11
Log 10 counts of algae excluding Microcystis sp. presented in box plots with median and 25–75 percentiles, the lines represent all the data range except extreme values, which are depicted with dots. (a) and change point analysis results, in the first (b), second (c) and third (d) pond trial, respectively.
Fig. 12
Fig. 12
Time series GLM summary statistics performed on Microcystis sp., counts with intervention effect at 1 h, day 1 and day 3, and a lag of 1. A forest plot of the coefficients for the GLMs pooling three trial coefficient estimates for the treatment effect provides a global estimate of the reduction in Microcystis sp. counts over the 3 day period after treated with hydrogen peroxide. A negative observed outcome represents the reduction of Microcystis sp., and [1- e^(CI)] x100% shows the degree of reduction.
Fig. 13
Fig. 13
Giant tiger prawn H&E stained slides observed under the light microscope (20×). (a) Day 0, (b) 1 h, (c) Day 1, (d) Day 14.
Fig. 14
Fig. 14
DO changes over time in Trial 1, Trial 2 and Trial 3 presented in box plots with median and 25–75 percentiles, the lines represent all the data range except extreme values, which are depicted with dots.

Similar articles

Cited by

  • The Chemistry of Phytoplankton.
    Liu X, Bian Z, Hu S, Dickinson CF, Benjamin MM, Jia J, Tian Y, Place A, Hanna GS, Luesch H, Croot P, Reddy MM, Thomas OP, Hardiman G, Puglisi MP, Yang M, Zhong Z, Lemasters JJ, Korte JE, Waters AL, Heltzel CE, Williamson RT, Strangman WK, Valeriote F, Tius MA, DiTullio GR, Ferreira D, Alekseyenko A, Wang S, Hamann MT, Wang X. Liu X, et al. Chem Rev. 2024 Dec 11;124(23):13099-13177. doi: 10.1021/acs.chemrev.4c00177. Epub 2024 Nov 21. Chem Rev. 2024. PMID: 39571071 Free PMC article. Review.

References

    1. Al Shehhi M.R., Gherboudj I., Ghedira H. An overview of historical harmful algae blooms outbreaks in the Arabian seas. Mar. Pollut. Bull. 2014;86(1–2):314–324. - PubMed
    1. Anderson D.M. Approaches to monitoring, control and management of harmful algal blooms (HABs) Ocean Coast. Manag. 2009;52(7):342–347. - PMC - PubMed
    1. Arvin E., Pedersen L.-F. Hydrogen peroxide decomposition kinetics in aquaculture water. Aquac. Eng. 2015;64:1–7.
    1. Balaji-Prasath B., Wang Y., Su Y.P., Hamilton D.P., Lin H., Zheng L., Zhang Y. Methods to control harmful algal blooms: a review. Environ. Chem. Lett. 2022:1–20. - PubMed
    1. Belfiore A.P., Buley R.P., Fernandez-Figueroa E.G., Gladfelter M.F., Wilson A.E. Zooplankton as an alternative method for controlling phytoplankton in catfish pond aquaculture. Aquac. Rep. 2021;21

LinkOut - more resources