. 2023 Dec 1:14:1281790.
doi: 10.3389/fneur.2023.1281790. eCollection 2023.

An integrated workflow for 2D and 3D posture analysis during vestibular system testing in mice

Affiliations

An integrated workflow for 2D and 3D posture analysis during vestibular system testing in mice

Yong Wan et al. Front Neurol. .

Abstract

Introduction: Posture extraction from videos is fundamental to many real-world applications, including health screenings. In this study, we extend the utility and specificity of a well-established protocol, the balance beam, for examining balance and active motor coordination in adult mice of both sexes.

Objectives: The primary objective of this study is to design a workflow for analyzing the postures of mice walking on a balance beam.

Methods: We developed new tools and scripts based on the FluoRender architecture, which can interact with DeepLabCut (DLC) through Python code. Notably, twenty input videos were divided into four feature point groups (head, body, tail, and feet), based on camera positions relative to the balance beam (left and right), and viewing angles (90° and 45° from the beam). We determined key feature points on the mouse to track posture in a still video frame. We extracted a standard walk cycle (SWC) by focusing on foot movements, which were computed by a weighted average of the extracted walk cycles. The correlation of each walk cycle to the SWC was used as the weight.

Results: We learned that positions of the camera angles significantly improved the performance of 2D pose estimation (90°) and 3D (45°). Comparing the SWCs from age-matched mice, we found a consistent pattern of supporting feet on the beam. Two feet were consistently on the beam followed by three feet and another three feet in a 2-3-3 pattern. However, this pattern can be mirrored among individual subjects. A subtle phase shift of foot movement was also observed from the SWCs. Furthermore, we compared the SWCs with speed values to reveal anomalies in mouse walk postures. Some anomalies can be explained as the start or finish of the traversal, while others may be correlated to the distractions of the test environment, which will need further investigation.

Conclusion: Our posture analysis workflow improves the classical behavioral testing and analysis, allowing the detection of subtle, but significant differences in vestibular function and motor coordination.

Keywords: AI; ML; balance; coordination; inner ear; multisensory; spatial orientation.


Conflict of interest statement

The authors declare that the research was conducted in the absence of any commercial or financial relationships that could be construed as a potential conflict of interest.

Figures

Figure 1
Figure 1
The workflow to track and analyze videos of mice traversing the balance beam. (A) Integration of DLC into FluoRender to track raw videos. FluoRender’s ruler tools were used to generate example postures on select video frames. These examples were saved into a DLC project for training a DLC model. Crude postures were generated by applying the model to full videos. The ruler editing tools of FluoRender were used to curate the crude postures and achieve precise tracking results. (B) The left and right postures were merged depending on the viewing angles of the video camera setups. For the 45° videos, we reconstructed 3D postures using a computer vision workflow with autocalibration. For the 90° videos, we computed the average postures from left and right postures. Then, we computed the speed values from the postures. We extracted every walk cycle from the speed data and computed a weighted average as the standard walk cycle. The SWC was first used to generate synthetic walk animations. We also compared the SWC with the speed data for each video to detect special events and anomalies in the videos.
Figure 2
Figure 2
Balance beam testing across different adults ages, sexes, and strains. (A) An illustration of balance beam (mouse not drawn to scale) with two cameras pointing to the center of the beam at 45° angles. (B) An illustration of the beam with two cameras facing each other on two sides of the beam. (C) Mean velocity (cm/second) for each adult mouse to traverse the beam between 4 to 5 trials (ages (P)ostnatal day 105 to P409). (D) Summary of mean velocities for males and females in Gad2-G5-tdT and wild type (WT) mice. (E) Summary of mean number of stops along the balance beam for males and females in Gad2-G5-tdT and wild type (WT) mice.
Figure 3
Figure 3
Incorrect tracking from DLC versus manual correction. The crude tracking rows show results from DLC. The manual curation rows show the results after fixing. The brightness of the videos was adjusted in FluoRender to aid feature discerning. Arrows point to the incorrect feature points. (A1,2) A blurry rear right foot caused incorrect tracking for both rear feet. (B1,2) Left and right ear tips were not correctly identified. (C1,2) Background object confused the tracking. (D1,2) Tracking of the tail failed because of the influence from the beam. (E1,2) Left and right rear feet switched positions. (F1,2) The feature points for the tail were not evenly distributed. (G1,2) Incorrect identification of the tail and body from self-occlusion. (H1,2) DLC was unable to track this atypical posture because it was not provided for training.
Figure 4
Figure 4
3D posture reconstruction with cameras positioned at 45°. (A) A still frame from the left-side camera. In addition to the feature points tracking the mouse movements, we drew straight lines in three groups, tracing the beam and edges of the box. (B) A still frame from the right-side camera. The same straight lines were drawn to establish a 3D world coordinate system. (C) The side view of the reconstruction result. Both the beam length and inclination angle were provided to map the reconstructed lengths to their physical values. (D) The top view of the reconstruction result.
Figure 5
Figure 5
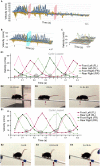
Standard walk cycle extraction. All horizontal axes are time (unit = m/s), which were captured at a 30-fps rate. (A) A graph showing the speed values over time for all XYZ speed components and all feature points. Time points when the mouse was not moving on the beam were cropped in the video analysis portion (pink planes). (B) The optimization process for computing the SWC was initialized by a manually selected cycle, illustrated by the cyan plane. (C) The SWC was plotted with all its XYZ speed components and feature points in a 3D graph. The most prominent peaks were from the movements of the feet in the X direction. (D1) A graph only showing the X speed of the four feet of mouse M. We detected a consistent pattern of supportive legs, at points where multiple curves crossed at near-zero speed (encircled grey regions). (D2-4) The still frames when the mouse was supported by 2 or 3 legs. It was easily observed from the still frames because the 30-fps video capture rate made moving legs blurry. (E1) A graph showing the X speed of the feet of mouse F. The same pattern of supportive legs was observed. However, mouse F tended to move two legs (FR and RL) at the same time. The pattern of supportive legs was also mirrored to that of mouse M. (E2-4) The still frames when mouse F was supported by 2 or 3 legs.
Figure 6
Figure 6
(A) A single frame from the synthetic walk reconstructed from the SWC for mouse M. The SWC is 2D because of the camera angles. Therefore, there is no side movement from the orthographic views (Supplementary Video S1). (B) A single frame from the synthetic walk reconstructed from the SWC for mouse F. The SWC is 3D, representing the averaged postures from all videos that recorded mouse F traversing the beam (Supplementary Video S2).
Figure 7
Figure 7
Comparison of SWC against the speed data. All horizontal axes are time counted as video frames. (A) video frame is one thirtieth of a second. (A–C) The results show three feature points on the mouse head from Supplementary Video S3. We computed the correlation values for each speed component (X and Y for the 90° configuration) and each feature point. The correlation values were normalized using a scale where 0 indicates no movement and 1 indicates a match to the SWC within one cycle. (D) We computed a variance measure (VoC) from all speed components and feature points. This measure is easier to read because it is non-negative and high values indicate large deviations from either the SWC or static state.
Figure 8
Figure 8
Detection of events and anomalies using VoC. (A) The VoC of the head. The first peak is from when mouse M stopped and raised its head. The flat lines surrounding the first peak are from walking postures very close to the SWC. The peaks of the later half are from head movements before entering the box. (B) A peak from the VoC of the feet is from a slip when mouse F just started moving. (C) Mouse F jumped (both rear legs moving at the same time) when approaching the box. (D) Mouse F looked down below the beam, resulting in a high peak of the head VoC. (E1,2) The supportive leg pattern differed from the SWC. We observed brief hesitation of the mouse’s movements. (E3) The compensational movements of the tail, delayed by about two cycles, were observed after the abnormal movements of the legs.

References

    1. Angelaki DE, Cullen KE. Vestibular system: the many facets of a multimodal sense. Annu Rev Neurosci. (2008) 31:125–50. doi: 10.1146/annurev.neuro.31.060407.125555, PMID: - DOI - PubMed
    1. Rastoldo G, Marouane E, El Mahmoudi N, Péricat D, Bourdet A, Timon-David E, et al. . Quantitative evaluation of a new Posturo-locomotor phenotype in a rodent model of acute unilateral Vestibulopathy. Front Neurol. (2020) 11:505. doi: 10.3389/fneur.2020.00505, PMID: - DOI - PMC - PubMed
    1. Aljovic A, Zhao S, Chahin M, de la Rosa C, Van Steenbergen V, Kerschensteiner M, et al. . A deep learning-based toolbox for automated limb motion analysis (ALMA) in murine models of neurological disorders. Commun Biol. (2022) 5:131. doi: 10.1038/s42003-022-03077-6, PMID: - DOI - PMC - PubMed
    1. Arac A, Zhao P, Dobkin BH, Carmichael ST, Golshani P. DeepBehavior: a deep learning toolbox for automated analysis of animal and human behavior imaging data. Front Syst Neurosci. (2019) 13:20. doi: 10.3389/fnsys.2019.00020, PMID: - DOI - PMC - PubMed
    1. Cao Z., Simon T., Wei S.-E., Sheikh Y. (2017). Realtime multi-person 2D pose estimation using part affinity fields. arXiv:1611.08050v2. - PubMed

LinkOut - more resources