

escheR: unified multi-dimensional visualizations with Gestalt principles
- PMID: 38107654
- PMCID: PMC10723033
- DOI: 10.1093/bioadv/vbad179
escheR: unified multi-dimensional visualizations with Gestalt principles
Abstract
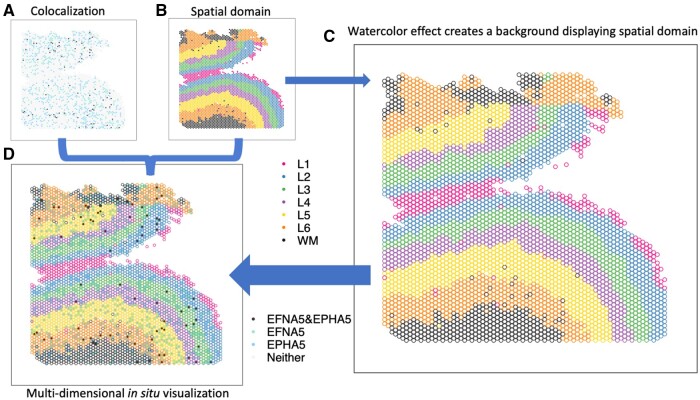
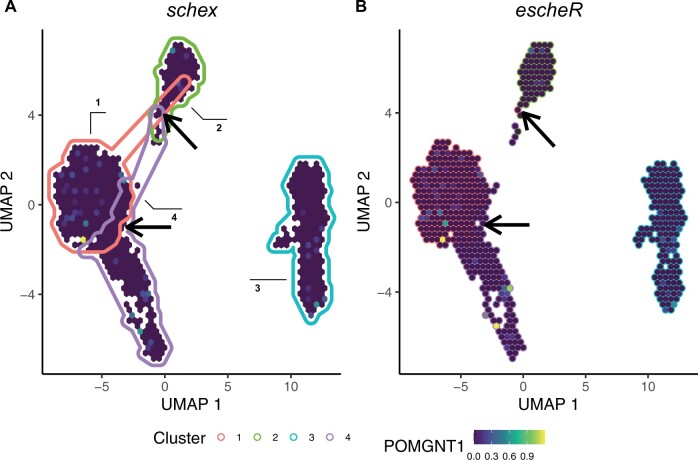
Summary: The creation of effective visualizations is a fundamental component of data analysis. In biomedical research, new challenges are emerging to visualize multi-dimensional data in a 2D space, but current data visualization tools have limited capabilities. To address this problem, we leverage Gestalt principles to improve the design and interpretability of multi-dimensional data in 2D data visualizations, layering aesthetics to display multiple variables. The proposed visualization can be applied to spatially-resolved transcriptomics data, but also broadly to data visualized in 2D space, such as embedding visualizations. We provide an open source R package escheR, which is built off of the state-of-the-art ggplot2 visualization framework and can be seamlessly integrated into genomics toolboxes and workflows.
Availability and implementation: The open source R package escheR is freely available on Bioconductor (https://bioconductor.org/packages/escheR).
© The Author(s) 2023. Published by Oxford University Press.
Conflict of interest statement
None declared.
Figures
Update of
-
escheR: Unified multi-dimensional visualizations with Gestalt principles.bioRxiv [Preprint]. 2023 Jun 8:2023.03.18.533302. doi: 10.1101/2023.03.18.533302. bioRxiv. 2023. Update in: Bioinform Adv. 2023 Dec 06;3(1):vbad179. doi: 10.1093/bioadv/vbad179. PMID: 36993732 Free PMC article. Updated. Preprint.
References
-
- Freytag S, Lister R.. schex avoids overplotting for large single-cell RNA-sequencing datasets. Bioinformatics 2020;36:2291–2. - PubMed
-
- Hansen KD, Risso D, Hicks SC. TENxPBMCData: PBMC data from 10X genomics. R Package Version 1.20.0. 2022. https://bioconductor.org/packages/TENxPBMCData (15 October 2023, date last accessed).
Grants and funding
LinkOut - more resources
Full Text Sources
