. 2023 Dec 1;64(15):21.
doi: 10.1167/iovs.64.15.21.

Oral Metformin Inhibits Choroidal Neovascularization by Modulating the Gut-Retina Axis

Affiliations

Oral Metformin Inhibits Choroidal Neovascularization by Modulating the Gut-Retina Axis

Jason Y Zhang et al. Invest Ophthalmol Vis Sci. .

Abstract

Purpose: Emerging data indicate that metformin may prevent the development of age-related macular degeneration (AMD). Whereas the underlying mechanisms of metformin's anti-aging properties remain undetermined, one proposed avenue is the gut microbiome. Using the laser-induced choroidal neovascularization (CNV) model, we investigate the effects of oral metformin on CNV, retinal pigment epithelium (RPE)/choroid transcriptome, and gut microbiota.

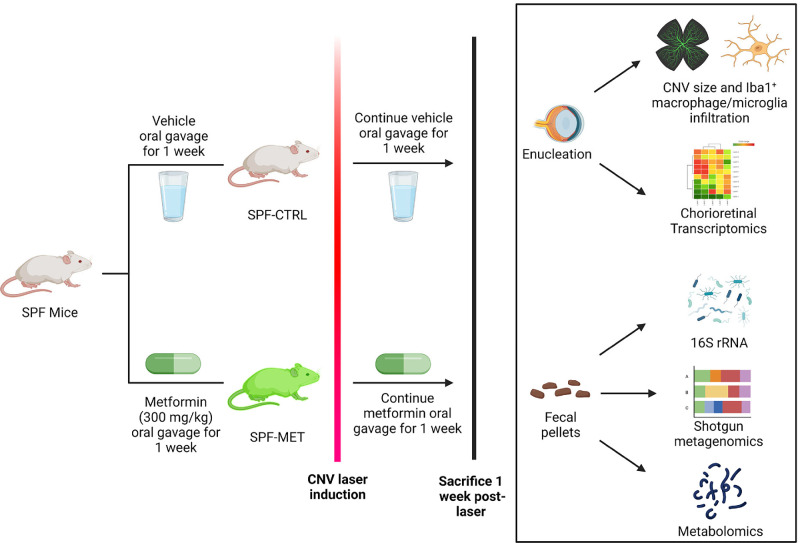
Methods: Specific pathogen free (SPF) male mice were treated via daily oral gavage of metformin 300 mg/kg or vehicle. Male mice were selected to minimize sex-specific differences to laser induction and response to metformin. Laser-induced CNV size and macrophage/microglial infiltration were assessed by isolectin and Iba1 immunostaining. High-throughput RNA-seq of the RPE/choroid was performed using Illumina. Fecal pellets were analyzed for gut microbiota composition/pathways with 16S rRNA sequencing/shotgun metagenomics, as well as microbial-derived metabolites, including small-chain fatty acids and bile acids. Investigation was repeated in metformin-treated germ-free (GF) mice and antibiotic-treated/GF mice receiving fecal microbiota transplantation (FMT) from metformin-treated SPF mice.

Results: Metformin treatment reduced CNV size (P < 0.01) and decreased Iba1+ macrophage/microglial infiltration (P < 0.005). One hundred forty-five differentially expressed genes were identified in the metformin-treated group (P < 0.05) with a downregulation in pro-angiogenic genes Tie1, Pgf, and Gata2. Furthermore, metformin altered the gut microbiome in favor of Bifidobacterium and Akkermansia, with a significant increase in fecal levels of butyrate, succinate, and cholic acid. Metformin did not suppress CNV in GF mice but colonization of microbiome-depleted mice with metformin-derived FMT suppressed CNV.

Conclusions: These data suggest that oral metformin suppresses CNV, the hallmark lesion of advanced neovascular AMD, via gut microbiome modulation.


Conflict of interest statement

Disclosure: J.Y. Zhang, None; J. Xiao, None; B. Xie, None; H. Barba, None; M. Boachie-Mensah, None; R.N. Shah, None; U. Nadeem, None; M. Spedale, None; N. Dylla, None; H. Lin, None; A.M. Sidebottom, None; M. D'Souza, None; B. Theriault, None; D. Sulakhe, None; E.B. Chang, None; D. Skondra, None

Figures

Figure 1.
Figure 1.
Schematic of SPF-metformin experimental design. Specific pathogen-free (SPF) mice were administered either vehicle (control) or metformin (300 mg/kg) via oral gavage daily for 1-week pre-laser induction and daily for 1-week post-laser induction.
Figure 2.
Figure 2.
Metformin suppresses CNV size, Iba1+ macrophage/microglial infiltration, and alters RPE/choroid transcriptome. (A) Metformin treatment decreases CNV size and Iba1+ macrophage/microglia infiltration around CNV but not Iba1+ macrophage/microglia signal within CNV. **P < 0.005; error bars indicate SEM; n = 6 per group (SPF-CTRL and SPF-MET). (B) Representative RPE/choroid flatmounts stained with lectin and Iba1 in control vs. metformin-treated mice. +: Iba1+ macrophage/microglia; scale bars: 80 µm. (C) Heatmap of the gene expression matrix for differentially expressed genes (DEGs) in the RPE/choroid between control and metformin treated groups (values normalized by sample). One hundred forty-five (145) DEGs (139 downregulated and 6 upregulated) were identified in the metformin-treated group. (D) Network of significantly enriched transcription factors and their target genes from RPE/choroid DEG analysis. Significantly altered transcription factors included forkhead box C2 (FOXC2), transcriptional regulator ERG, and Notch. (E) Dot plot of top 10 enriched functional terms from RPE/choroid DEG analysis. Top biological processes and molecular functions included angiogenesis regulation, notch binding, and TLR4 binding. Dot size indicates the number of DEGs within the functional category, and dot color reflects adjusted P value significance.
Figure 3.
Figure 3.
Metformin alters gut microbiome composition. (A) Principal coordinate analysis (PCoA) at the OTU level. The two-dimensional PCoA plot shows the beta diversity of the metformin and control samples at three time points (T0, T1, and T2). Metformin-treated mice (blue ellipse) gathered together and separately from those in the control group (red ellipse) at both week 1 (T1) and week 2 (T2). (B) Representative stacked bars of relative bacterial order abundance in gut microbiota of control vs. metformin-treated mice prior to treatment (T0), after 1 week of treatment (T1), and after 2 weeks of treatment (T2); n = 6 (control), n = 6 (metformin). Clostridiales order of Firmicutes phylum decreased most significantly in the metformin group by T2, whereas the Verrucomicrobiales order increased. (C) Boxplots of centered log ratio (CLR) abundances for select differentially detected taxa between metformin T0 and metformin T2 groups, including Verucomicrobiales and Bacillales. The highlighted FDR value for each subplot is estimated by Limma linear model. (D) Heatmap of differentially detected genera (FDR < 0.1) across all samples in two contrast groups: (1) Metformin treated samples at time 0 vs. 2; (2) Control samples versus metformin treated samples at time 2. The abundance values are normalized by sample. Phylum and family level information for genera are shown.
Figure 4.
Figure 4.
Metformin-associated alterations in microbiome composition are tied to transcriptomic and functional changes. (A) Network illustrating significant (P < 0.05) microbiome genera co-abundances within the metformin treated group as determined by Pearson's correlation. Metformin treatment for 2 weeks promoted an increased number of positive connections among microbial genera, especially those within Bacteroidetes, Verrucomicrobia, Actinobacteria, and Firmicutes phyla. Network edges indicate positive (red) and negative (blue) correlations. Network nodes are colored by phylum origin. (B) Network illustrating significant (P < 0.05) Pearson's correlation between RPE/choroid RNA-seq gene expression and 16S microbiome genus level abundance at T2 in matched mice. Genes Ccl11 and Rspo3 (highlighted in red) are involved in angiogenesis and correlate with hub genus Akkermansia. (C) LEfSe rank plot of differentially abundant pathways in the gut microbiomes of mice treated with metformin for 2 weeks (metformin T2, n = 4) versus the same mice prior to treatment (metformin T0, n = 4) and control mice after 2 weeks (control T2, n = 4). Twenty-seven (27) abundant pathways were significantly altered, including enrichment in pyruvate and lipid metabolism and downregulation in CoA biosynthesis and amino acid metabolism.
Figure 5.
Figure 5.
Metformin alters fecal levels of short-chain fatty acids, bile acids, and other metabolites. Levels of short-chain fatty acids (SCFAs), branched-chain fatty acids, amino acids, bile acids, and phenolic metabolites were measured in fecal samples of mice at baseline (Met0), after 1 week of metformin treatment (Met1), after 2 weeks of metformin treatment (Met2), and for age-matched controls of Met2 (Cntrl2). (A) Elevated levels of fecal butyrate were detected in Met2 compared to Met0. (B) Fecal propionate was increased in Met2 compared to Cntrl2. (C–E) Quantitative boxplots comparing Met0 to Met2 revealed elevations of fecal (C) cholic acid, (D) deoxycholic acid, and (E) isodeoxycholic acid in Met2 compared to Met0. (F–H) In contrast, metformin treatment decreased fecal levels of (F) lithocholic acid, (G) alloisolithocholic acid, and (H) 3-oxo-lithocholic acid. Statistical testing was performed using the Wilcoxon signed-rank tests, with P values adjusted by false discovery rate using the Benjamini-Hochberg method.
Figure 6.
Figure 6.
Schematic of GF-metformin and fecal microbiota transplantation (FMT) experiments. (A) Germ-free (GF) mice were given metformin or vehicle via oral gavage 1 week prior to laser induction. (B) Fecal microbiota transplantation (FMT) was performed using feces collected from donors treated with either metformin or vehicle for 2 weeks. (C) GF and antibiotic (AB)-treated mice received FMT for 1 week followed by CNV laser induction and euthanization 1-week post-laser.
Figure 7.
Figure 7.
Metformin's inhibitory effects on CNV are mediated by the gut microbiome. (A, B) GF mice treated with metformin showed no difference in CNV and Iba1+ macrophages/microglia infiltration compared to vehicle-treated counterparts. However, FMT from metformin-treated SPF mice (FMT-MET) reduced CNV size and Iba1+ macrophages/microglia infiltration in (C, D) antibiotic-treated and (E, F) GF mice.
Figure 8.
Figure 8.
FMT from metformin-treated SPF mice changes microbiome composition in antibiotic-depleted mice (Abx). (A) Principal coordinate analysis (PCoA) at the OTU level for antibiotic-treated mice receiving FMT shows moderate separation after two treatments (post-FMT2, n = 11). (B) Representative stacked bars of relative bacterial order abundance in gut microbiota show a decrease in Clostridiales and upward trend in Bacteroidales and Verrucomicrobiales with metformin FMT. (C) Boxplots of CLR abundances for select differentially detected taxa. FMT from metformin-treated SPF mice resulted in a significant decrease in order Clostridiales (logFC = −0.95) alongside multiple genera under Clostridia, including Murimonas (logFC = −2.76), Papillibacter (logFC = −2.08), and Ruminococcus (logFC = −6.03). Genus Clostridium_XVIII of class Erysipelotrichia also decreased (logFC = −2.17). (D) Heatmap of differentially detected microbiome genera (FDR < 0.1). Abundance values are normalized by sample. Phylum and order level information for genera are shown.
Figure 9.
Figure 9.
FMT from metformin-treated SPF mice changes microbiome composition in germ-free (GF) mice. (A) Principal coordinate analysis (PCoA) at the OTU level for GF mice receiving FMT shows less separation after two treatments (post-FMT2, n = 6) compared to antibiotic-treated mice. (B) Representative stacked bars of relative bacterial order abundance in gut microbiota show a decrease in Clostridiales and upward trend in Bacteroidales, Bifidobacteriales, and Lactobacillales with metformin FMT. (C) Boxplots of CLR abundances for select differentially detected taxa. FMT from metformin-treated SPF mice resulted in a significant decrease in genera Butyrivibrio (logFC = −5.82), Murimonas (logFC = −6.58), and Anaerobacterium (logFC = −5.53) from class Clostridia. Other changes included a decrease in family Enterococcaceae (logFC = −4.96) of class Bacilli and phylum Firmicutes (logFC = −0.86). (D) Heatmap of differentially detected microbiome genera (FDR < 0.1). Abundance values are normalized by sample. Phylum and order level information for genera are shown.

References

    1. Wong WL, Su X, Li X, et al.. Global prevalence of age-related macular degeneration and disease burden projection for 2020 and 2040: a systematic review and meta-analysis. Lancet Glob Health. 2014; 2(2): e106–e116. - PubMed
    1. Pennington KL, DeAngelis MM.. Epidemiology of age-related macular degeneration (AMD): associations with cardiovascular disease phenotypes and lipid factors. Eye Vision (London, England). 2016; 3: 34. - PMC - PubMed
    1. Barzilai N, Crandall JP, Kritchevsky SB, Espeland MA.. Metformin as a tool to target aging. Cell Metab. 2016; 23(6): 1060–1065. - PMC - PubMed
    1. Blitzer AL, Ham SA, Colby KA, Skondra D.. Association of metformin use with age-related macular degeneration: a case-control study. JAMA Ophthalmol. Published online January 21, 2021, doi: 10.1001/jamaophthalmol.2020.6331. - DOI - PMC - PubMed
    1. Romdhoniyyah DF, Harding SP, Cheyne CP, Beare NAV.. Metformin: a potential role in age-related macular degeneration: a systematic review and meta-analysis. Ophthalmol Ther. 2021; 10(2): 245–260. - PMC - PubMed

Publication types

Substances