. 2024 Feb 16;30(4):904-917.
doi: 10.1158/1078-0432.CCR-23-0195.

Short-Chain Fatty Acid Production by Gut Microbiota Predicts Treatment Response in Multiple Myeloma

Affiliations

Short-Chain Fatty Acid Production by Gut Microbiota Predicts Treatment Response in Multiple Myeloma

Alba Rodríguez-García et al. Clin Cancer Res. .

Abstract

Purpose: The gut microbiota plays important roles in health and disease. We questioned whether the gut microbiota and related metabolites are altered in monoclonal gammopathies and evaluated their potential role in multiple myeloma and its response to treatment.

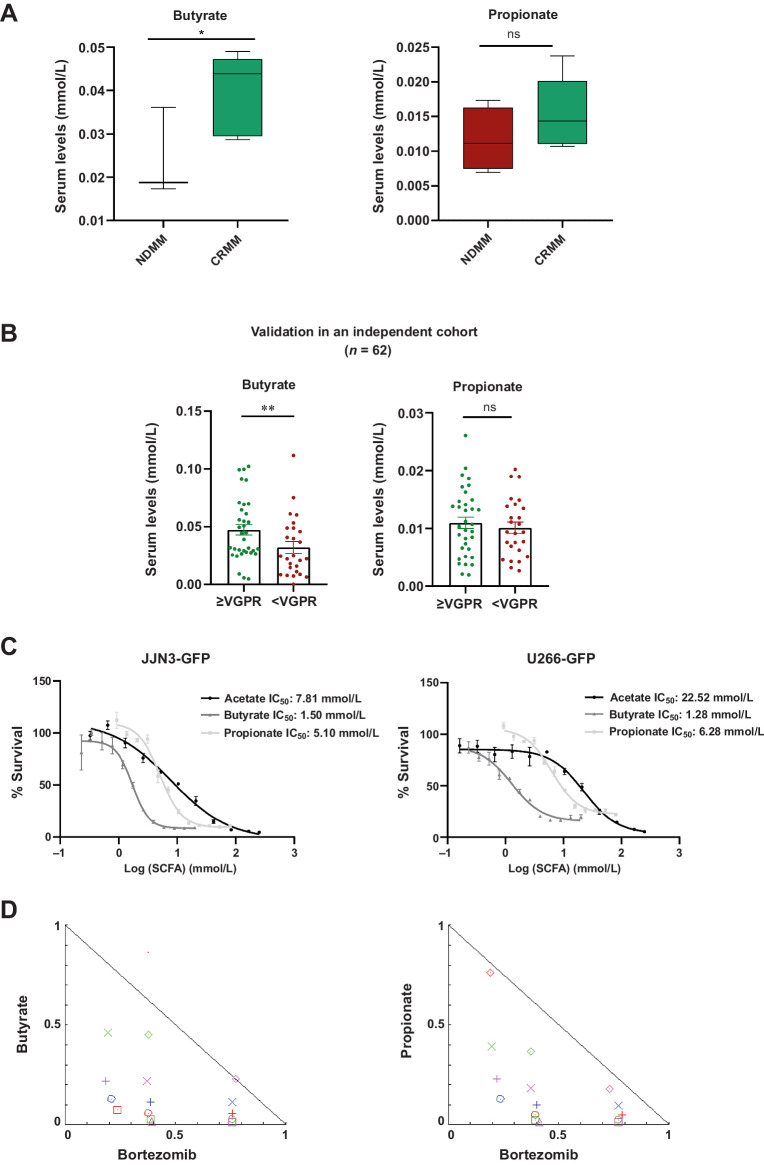
Experimental design: We used 16S rRNA sequencing to characterize and compare the gut microbiota of patients with monoclonal gammopathy of undetermined significance (n = 11), smoldering multiple myeloma (n = 9), newly diagnosed multiple myeloma (n = 11), relapsed/refractory multiple myeloma (n = 6), or with complete remission (n = 9). Short-chain fatty acids (SCFA) were quantified in serum and tested in cell lines. Relevant metabolites were validated in a second cohort of 62 patients.

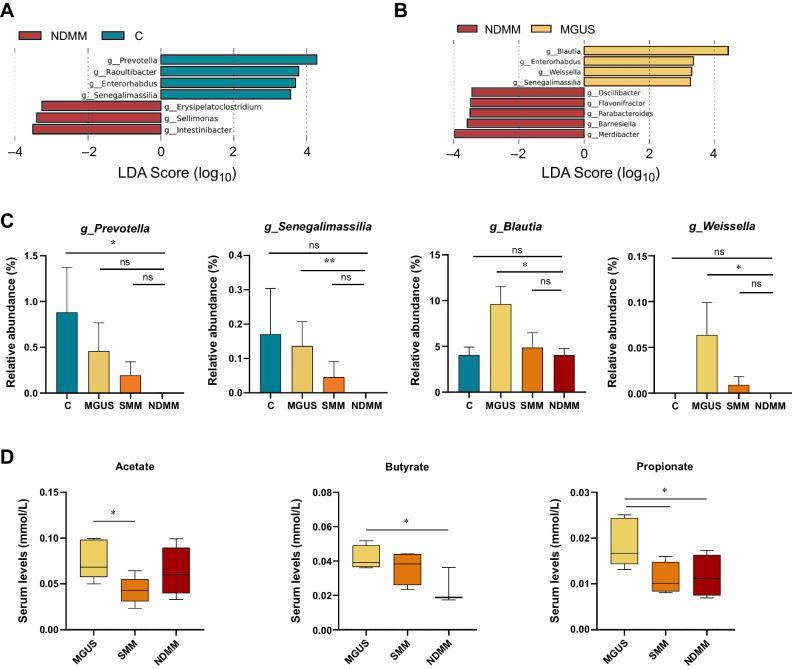
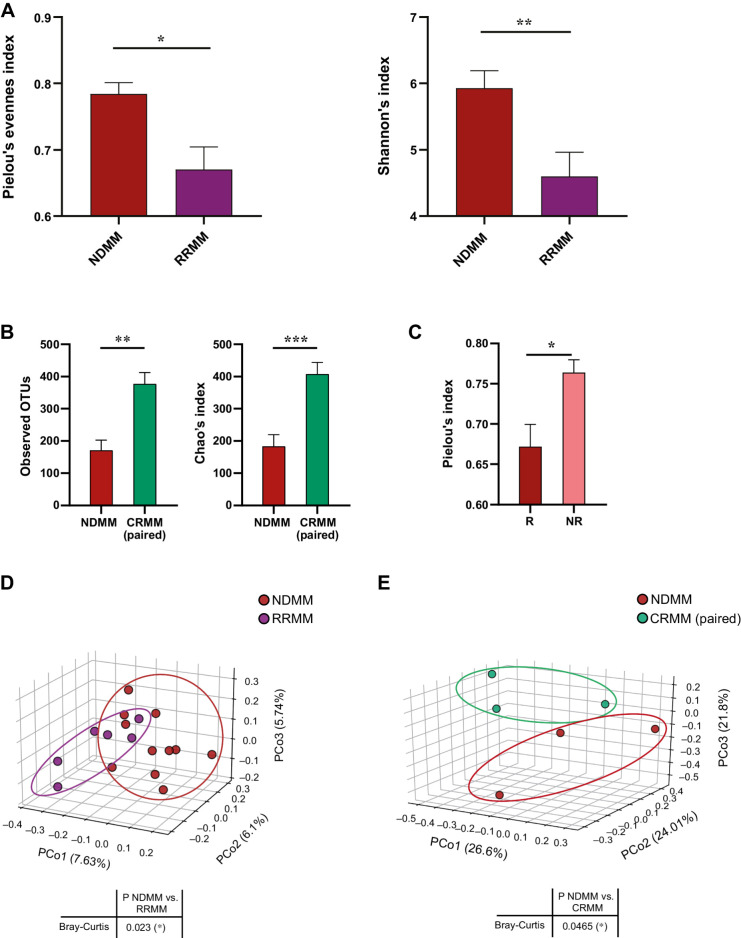
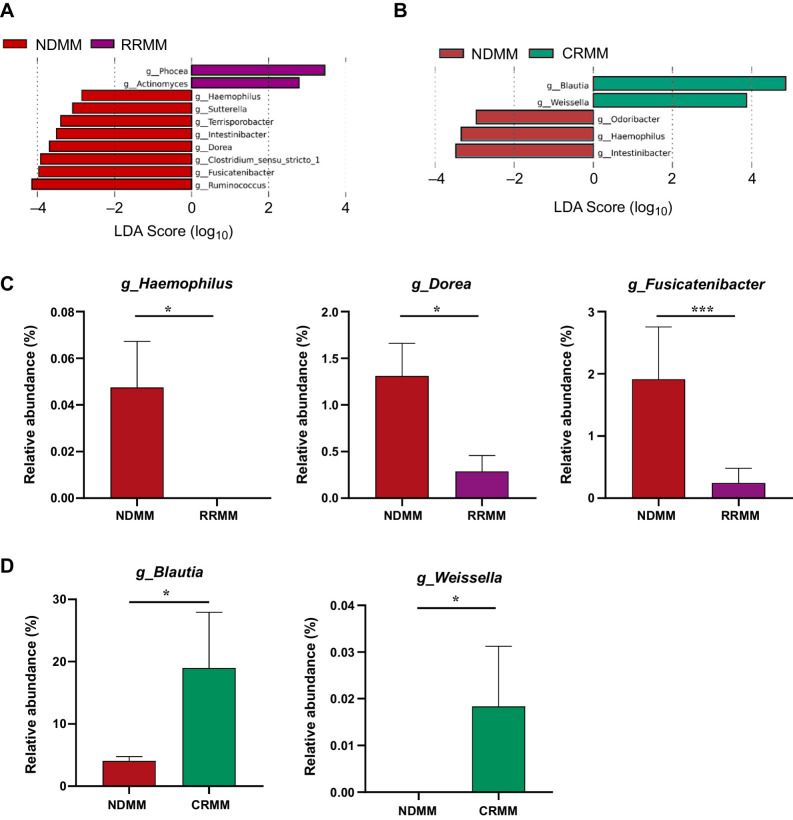
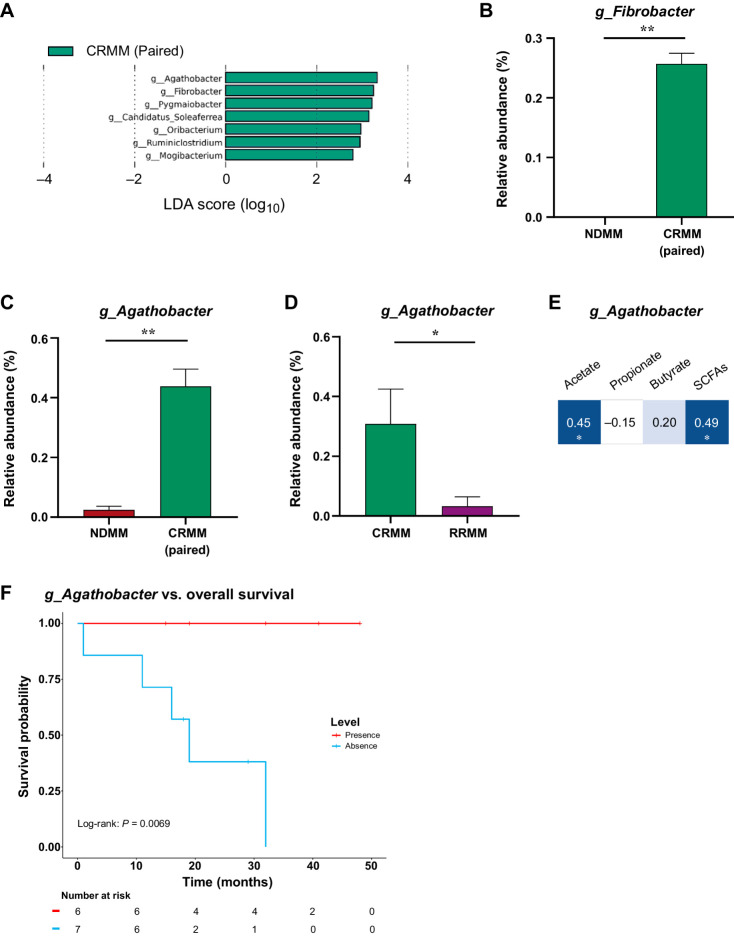
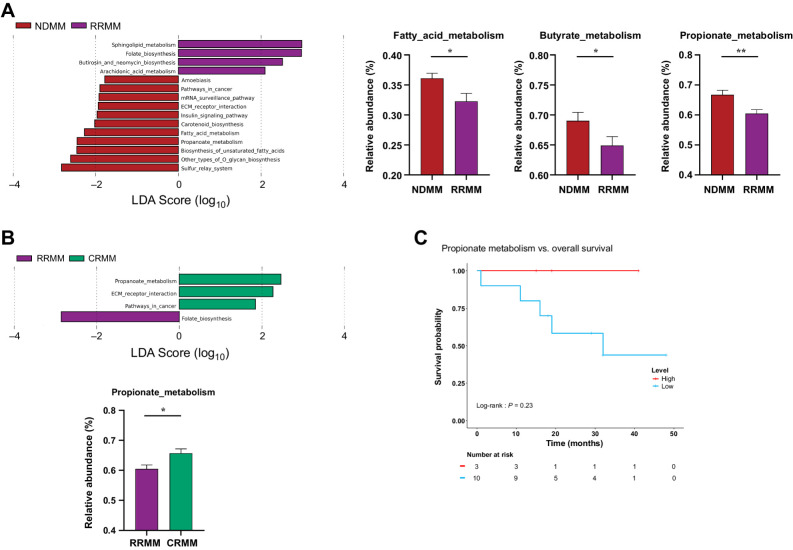
Results: Significant differences in alpha- and beta diversity were present across the groups and both were lower in patients with relapse/refractory disease and higher in patients with complete remission after treatment. Differences were found in the abundance of several microbiota taxa across disease progression and in response to treatment. Bacteria involved in SCFA production, including Prevotella, Blautia, Weissella, and Agathobacter, were more represented in the premalignant or complete remission samples, and patients with higher levels of Agathobacter showed better overall survival. Serum levels of butyrate and propionate decreased across disease progression and butyrate was positively associated with a better response. Both metabolites had antiproliferative effects in multiple myeloma cell lines.

Conclusions: We demonstrate that SCFAs metabolites and the gut microbiota associated with their production might have beneficial effects in disease evolution and response to treatment, underscoring its therapeutic potential and value as a predictor.


Figures

Figure 1. Gut microbiota associated with the progression of the disease. Taxonomic biomarkers identified by LEfSe analysis between control subjects (C) and multiple myeloma at diagnosis (NDMM; A) and between in patients with monoclonal gammopathy of undetermined significance (MGUS) and NDMM (B). C, Relative abundance (%) of SCFA-producing genera in C and in MGUS, smoldering multiple myeloma (SMM), and NDMM. The results are represented by mean ± SEM. *, P < 0.05; **, P < 0.01; ns, nonsignificant. D, Acetate, propionate and butyrate levels (mmol/L) in serum in MGUS, SMM, and NDMM groups. The results are represented by boxes and whiskers (minimum to maximum). *, P < 0.05.
Figure 1.
Gut microbiota associated with the progression of the disease. Taxonomic biomarkers identified by LEfSe analysis between control subjects (C) and multiple myeloma at diagnosis (NDMM; A) and between in patients with monoclonal gammopathy of undetermined significance (MGUS) and NDMM (B). C, Relative abundance (%) of SCFA-producing genera in C and in MGUS, smoldering multiple myeloma (SMM), and NDMM. The results are represented by mean ± SEM. *, P < 0.05; **, P < 0.01; ns, nonsignificant. D, Acetate, propionate and butyrate levels (mmol/L) in serum in MGUS, SMM, and NDMM groups. The results are represented by boxes and whiskers (minimum to maximum). *, P < 0.05.
Figure 2. The diversity of the gut microbiota in the response to the disease. A and B, Alpha diversity represented by (A) Pielou's and Shannon's indices in newly diagnosed multiple myeloma (NDMM) and multiple myeloma at relapse or refractory (RRMM); B, observed OTUs and Chao's index in paired samples at diagnosis (NDMM) and at complete remission (CRMM). C, Comparison of alpha diversity between patients who relapse (R) or not (NR). The results are represented by mean ± SEM. *, P < 0.05. D and E, Beta diversity represented by principal coordinate analysis plot of Bray-Curtis dissimilarity of (D) NDMM and RRMM and (E) NDMM and CRMM in paired samples. Principal coordinate 1 (PCo1), 2 (PCo2), and 3 (PCoa3) values for each sample are plotted with the percentage of explained variance shown in parentheses.
Figure 2.
The diversity of the gut microbiota in the response to the disease. A and B, Alpha diversity represented by (A) Pielou's and Shannon's indices in newly diagnosed multiple myeloma (NDMM) and multiple myeloma at relapse or refractory (RRMM); B, observed OTUs and Chao's index in paired samples at diagnosis (NDMM) and at complete remission (CRMM). C, Comparison of alpha diversity between patients who relapse (R) or not (NR). The results are represented by mean ± SEM. *, P < 0.05. D and E, Beta diversity represented by principal coordinate analysis plot of Bray-Curtis dissimilarity of (D) NDMM and RRMM and (E) NDMM and CRMM in paired samples. Principal coordinate 1 (PCo1), 2 (PCo2), and 3 (PCoa3) values for each sample are plotted with the percentage of explained variance shown in parentheses.
Figure 3. Gut microbiota associated with relapse and response to the disease. A and B, Taxonomic biomarkers identified by LEfSe analysis between multiple myeloma at diagnosis (NDMM) and (A) at relapse/refractory (RRMM) and (B) at complete remission (CRMM). C, Relative abundance (%) of the genus Haemophilus, Fusicatenibacter, and Dorea in NDMM compared with RRMM. D, Relative abundance (%) of the genus Blautia and Weisella in NDMM compared with CRMM. The results are represented by mean ± SEM. *, P < 0.05.
Figure 3.
Gut microbiota associated with relapse and response to the disease. A and B, Taxonomic biomarkers identified by LEfSe analysis between multiple myeloma at diagnosis (NDMM) and (A) at relapse/refractory (RRMM) and (B) at complete remission (CRMM). C, Relative abundance (%) of the genus Haemophilus, Fusicatenibacter, and Dorea in NDMM compared with RRMM. D, Relative abundance (%) of the genus Blautia and Weisella in NDMM compared with CRMM. The results are represented by mean ± SEM. *, P < 0.05.
Figure 4. Gut microbiota associated with the survival of the disease. A, Taxonomic biomarkers identified by LEfSe analysis between multiple myeloma at diagnosis (NDMM) and at complete remission (CRMM) in paired samples. B–D, Relative abundance (%) of the genus (B) Fibrobacter and (C) Agathobacter in paired samples and (D) Agathobacter in CRMM and RRMM. The results are represented by mean ± SEM. *, P < 0.05. E, Correlation between Agathobacter and SCFAs. Blue color represents a positive correlation (Pearson correlation) and the intensity is proportional to the correlation coefficients. Significant correlation is indicated by * (P < 0.05). F, Kaplan–Meier curve representation of survival probability in patients after receiving treatment (CRMM and RRMM) with presence (red) or absence (blue) levels of Agathobacter.
Figure 4.
Gut microbiota associated with the survival of the disease. A, Taxonomic biomarkers identified by LEfSe analysis between multiple myeloma at diagnosis (NDMM) and at complete remission (CRMM) in paired samples. B–D, Relative abundance (%) of the genus (B) Fibrobacter and (C) Agathobacter in paired samples and (D) Agathobacter in CRMM and RRMM. The results are represented by mean ± SEM. *, P < 0.05. E, Correlation between Agathobacter and SCFAs. Blue color represents a positive correlation (Pearson correlation) and the intensity is proportional to the correlation coefficients. Significant correlation is indicated by * (P < 0.05). F, Kaplan–Meier curve representation of survival probability in patients after receiving treatment (CRMM and RRMM) with presence (red) or absence (blue) levels of Agathobacter.
Figure 5. Gut metagenome metabolic pathways. A and B, Linear discriminant analysis (LDA) effect size (LEfSE) analysis showing discriminative Kyoto Encyclopedia of Genes and Genomes (KEGG) metabolic pathways among (A) NDMM and multiple myeloma at relapse or refractory (RRMM); B, RRMM compared with multiple myeloma at complete remission (CRMM). C, Kaplan–Meier curve representation of survival probability in patients after receiving treatment (CRMM and RRMM) with high (red) or low (blue) levels of the propionate metabolism pathway. All KEGG pathways showed statistically significant changes (P < 0.05), with an LDA score threshold set to 2.5. Relative abundance of metabolic pathways related to SCFAs is represented by mean ± SEM. *, P < 0.05; **, P < 0.01.
Figure 5.
Gut metagenome metabolic pathways. A and B, Linear discriminant analysis (LDA) effect size (LEfSE) analysis showing discriminative Kyoto Encyclopedia of Genes and Genomes (KEGG) metabolic pathways among (A) NDMM and multiple myeloma at relapse or refractory (RRMM); B, RRMM compared with multiple myeloma at complete remission (CRMM). C, Kaplan–Meier curve representation of survival probability in patients after receiving treatment (CRMM and RRMM) with high (red) or low (blue) levels of the propionate metabolism pathway. All KEGG pathways showed statistically significant changes (P < 0.05), with an LDA score threshold set to 2.5. Relative abundance of metabolic pathways related to SCFAs is represented by mean ± SEM. *, P < 0.05; **, P < 0.01.
Figure 6. The SCFA levels in the response to treatment and their antiproliferative effects in multiple myeloma cell lines. A, Butyrate levels and propionate (mmol/L) in serum in patients with NDMM compared with patients at complete remission (CRMM). B, Propionate and butyrate levels (mmol/L) in serum at the time of diagnosis in a cohort from the randomized clinical trial NCT02575144 according to the achievement of a response equal or better than very good partial response (≥VGPR) or not (<VGPR). The results are represented by box and whiskers (minimum to maximum) and by mean ± SEM. *, P < 0.05. C, Dose–response curves of SCFAs in JJN3-GFP and U266-GFP MM cell lines. The IC50 value is shown for acetate, butyrate, and propionate. D, Normalized isobolograms for butyrate and propionate in combination with bortezomib, respectively in the JJN3-GFP cell line.
Figure 6.
The SCFA levels in the response to treatment and their antiproliferative effects in multiple myeloma cell lines. A, Butyrate levels and propionate (mmol/L) in serum in patients with NDMM compared with patients at complete remission (CRMM). B, Propionate and butyrate levels (mmol/L) in serum at the time of diagnosis in a cohort from the randomized clinical trial NCT02575144 according to the achievement of a response equal or better than very good partial response (≥VGPR) or not (<VGPR). The results are represented by box and whiskers (minimum to maximum) and by mean ± SEM. *, P < 0.05. C, Dose–response curves of SCFAs in JJN3-GFP and U266-GFP MM cell lines. The IC50 value is shown for acetate, butyrate, and propionate. D, Normalized isobolograms for butyrate and propionate in combination with bortezomib, respectively in the JJN3-GFP cell line.

Similar articles

Cited by

References

    1. Kumar S, Paiva B, Anderson KC, Durie B, Landgren O, Moreau P, et al. . International myeloma working group consensus criteria for response and minimal residual disease assessment in multiple myeloma. Lancet Oncol 2016;17:e328–46. - PubMed
    1. Landgren O, Kyle RA, Pfeiffer RM, Katzmann JA, Caporaso NE, Hayes RB, et al. . Monoclonal gammopathy of undetermined significance (MGUS) consistently precedes multiple myeloma: a prospective study. Blood 2009;113:5412–7. - PMC - PubMed
    1. van de Donk NWCJ, Pawlyn C, Yong KL. Multiple myeloma. Lancet 2021;397:410–27. - PubMed
    1. Bosseboeuf A, Feron D, Tallet A, Rossi C, Charlier C, Garderet L, et al. . Monoclonal IgG in MGUS and multiple myeloma targets infectious pathogens. JCI Insight 2017;2:e95367. - PMC - PubMed
    1. Bosseboeuf A, Mennesson N, Allain-Maillet S, Tallet A, Piver E, Decaux O, et al. . Characteristics of MGUS and multiple myeloma according to the target of monoclonal immunoglobulins, glucosylsphingosine, or Epstein-Barr virus EBNA-1. Cancers 2020;12:1254. - PMC - PubMed

Publication types