Review
. 2023 Dec 18:12:e82469.
doi: 10.7554/eLife.82469.

Estimating the contribution of subclinical tuberculosis disease to transmission: An individual patient data analysis from prevalence surveys

Affiliations
Review

Estimating the contribution of subclinical tuberculosis disease to transmission: An individual patient data analysis from prevalence surveys

Jon C Emery et al. Elife. .

Abstract

Background: Individuals with bacteriologically confirmed pulmonary tuberculosis (TB) disease who do not report symptoms (subclinical TB) represent around half of all prevalent cases of TB, yet their contribution to Mycobacterium tuberculosis (Mtb) transmission is unknown, especially compared to individuals who report symptoms at the time of diagnosis (clinical TB). Relative infectiousness can be approximated by cumulative infections in household contacts, but such data are rare.

Methods: We reviewed the literature to identify studies where surveys of Mtb infection were linked to population surveys of TB disease. We collated individual-level data on representative populations for analysis and used literature on the relative durations of subclinical and clinical TB to estimate relative infectiousness through a cumulative hazard model, accounting for sputum-smear status. Relative prevalence of subclinical and clinical disease in high-burden settings was used to estimate the contribution of subclinical TB to global Mtb transmission.

Results: We collated data on 414 index cases and 789 household contacts from three prevalence surveys (Bangladesh, the Philippines, and Viet Nam) and one case-finding trial in Viet Nam. The odds ratio for infection in a household with a clinical versus subclinical index case (irrespective of sputum smear status) was 1.2 (0.6-2.3, 95% confidence interval). Adjusting for duration of disease, we found a per-unit-time infectiousness of subclinical TB relative to clinical TB of 1.93 (0.62-6.18, 95% prediction interval [PrI]). Fourteen countries across Asia and Africa provided data on relative prevalence of subclinical and clinical TB, suggesting an estimated 68% (27-92%, 95% PrI) of global transmission is from subclinical TB.

Conclusions: Our results suggest that subclinical TB contributes substantially to transmission and needs to be diagnosed and treated for effective progress towards TB elimination.

Funding: JCE, KCH, ASR, NS, and RH have received funding from the European Research Council (ERC) under the Horizon 2020 research and innovation programme (ERC Starting Grant No. 757699) KCH is also supported by UK FCDO (Leaving no-one behind: transforming gendered pathways to health for TB). This research has been partially funded by UK aid from the UK government (to KCH); however, the views expressed do not necessarily reflect the UK government's official policies. PJD was supported by a fellowship from the UK Medical Research Council (MR/P022081/1); this UK-funded award is part of the EDCTP2 programme supported by the European Union. RGW is funded by the Wellcome Trust (218261/Z/19/Z), NIH (1R01AI147321-01), EDTCP (RIA208D-2505B), UK MRC (CCF17-7779 via SET Bloomsbury), ESRC (ES/P008011/1), BMGF (OPP1084276, OPP1135288 and INV-001754), and the WHO (2020/985800-0).

Keywords: Mtb transmission; asymptomatic transmission; asymptomatic tuberculosis; epidemiology; global health; household Mtb infection surveys; human; infectious disease; mathematical modelling; microbiology; subclinical transmission.


Conflict of interest statement

JE, SB, BF, FG, KH, SH, IL, Fv, HN, HN, MQ, AR, ET, RW, KZ, FC, RH No competing interests declared, PD has received consultancy fees from WHO (TB burden estimation) and participates as chair of SAB for NIHR grant on TBI screening. The author has no other competing interests to declare, GM acts as President of the International Union Against TB & Lung Disease. The author has no other competing interests to declare, IO has received grants from National TB Program Cambodia, WHO and DFAT (Australia) and has received consulting fees from WHO Myanmar Office. The author is on the Board of the Directors, UNION IUATLD and WHO’s Global Task Force on TB Impact Measurement. The author has no other competing interests to declare, NS received a grant from the Bill and Melinda Gates Foundation and owns stock/stock options in Sanofi Aventis Pharma LTD. The author has no other competing interests to declare

Figures

Figure 1.
Figure 1.. Odds ratios for infection in members of a household with a clinical versus a subclinical index case (irrespective of sputum smear-status) (A) and in members of a household with a sputum smear-positive versus a smear-negative index case (irrespective of symptoms) (B).
Illustrated are central estimates and 95% confidence intervals for each study separately and the results of a mixed-effects meta-analysis. Results for sputum smear status are omitted for Bangladesh as the survey considered only sputum smear-positive individuals.
Figure 2.
Figure 2.. The estimated infectiousness of subclinical tuberculosis (TB) per unit time relative to clinical TB (A) and sputum smear-negative TB relative to smear-positive TB (B).
Illustrated are the median and 95% confidence intervals for each study separately and the median and 95% prediction interval results from mixed-effects meta-analyses across studies with an associated measure of heterogeneity (I2).
Figure 3.
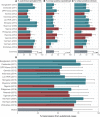
Figure 3.. The proportion of prevalent tuberculosis (TB) that is subclinical (A), the proportion of subclinical TB that is smear-positive (B), and the proportion of clinical TB that is smear-positive (C) using data from prevalence surveys in Africa (red) and Asia (teal).
Illustrated are median and 95% confidence intervals for each study separately and the median and 95% prediction intervals from mixed-effects meta-analyses across studies with an associated measure of heterogeneity (I2). Also shown is the estimated proportion of transmission from subclinical TB at the time of and in the location of each of the prevalence surveys in Africa and Asia (D). Illustrated is the median and 95% prediction intervals for each study separately as well as the global value. DPR = Democratic People’s Republic; PDR = People’s Democratic Republic.
Appendix 1—figure 1.
Appendix 1—figure 1.. Competing risk model (A) with transition rates from Richards et al., 2021 used to estimate the durations of subclinical and clinical tuberculosis (TB) (B).
Appendix 1—figure 2.
Appendix 1—figure 2.. Model fits for each model.
Shown are prevalence of infection in members of households with different index case types (background, subclinical and smear-negative, subclinical and smear-positive, clinical and smear-negative, clinical and smear-positive). Error bars show median and 95% credible intervals. Shaded regions show posterior median and 95% posterior intervals. +ve = positive, -ve = negative.
Appendix 1—figure 3.
Appendix 1—figure 3.. Trace plots for each model.
Appendix 1—figure 4.
Appendix 1—figure 4.. Correlation plots for each model.
Appendix 1—figure 5.
Appendix 1—figure 5.. Autocorrelation plots for each model.
Appendix 1—figure 6.
Appendix 1—figure 6.. Affected results for sensitivity analysis 1.
Figure details for A, B and C are as per Figures 2A, B, 3D in the main text, respectively.
Appendix 1—figure 7.
Appendix 1—figure 7.. Affected results for sensitivity analysis 2.
Figure details for A, B and C are as per Figures 2A, B, 3D in the main text, respectively.
Appendix 1—figure 8.
Appendix 1—figure 8.. Affected results for sensitivity analysis 3.
Figure details for A, B and C are as per Figures 2A, B, 3D in the main text, respectively.
Appendix 1—figure 9.
Appendix 1—figure 9.. Affected results for sensitivity analysis 4.
Figure details for A, B and C are as per Figures 2A, B, 3D in the main text, respectively.
Appendix 1—figure 10.
Appendix 1—figure 10.. Affected results for sensitivity analysis 5.
Figure details for A, B and C are as per Figures 2A, B, 3D in the main text, respectively.

Update of

  • doi: 10.1101/2022.06.09.22276188

References

    1. Alene KA, Wangdi K, Colquhoun S, Chani K, Islam T, Rahevar K, Morishita F, Byrne A, Clark J, Viney K. Tuberculosis related disability: a systematic review and meta-analysis. BMC Medicine. 2021;19:203. doi: 10.1186/s12916-021-02063-9. - DOI - PMC - PubMed
    1. Allwood B, van der Zalm M, Makanda G, Mortimer K, Steering Committee of the First International Post-Tuberculosis Symposium The long shadow post-tuberculosis. The Lancet. Infectious Diseases. 2019;19:1170–1171. doi: 10.1016/S1473-3099(19)30564-X. - DOI - PubMed
    1. Arinaminpathy N, Dowdy D. Understanding the incremental value of novel diagnostic tests for tuberculosis. Nature. 2015;528:S60–S67. doi: 10.1038/nature16045. - DOI - PubMed
    1. Asadi S, Wexler AS, Cappa CD, Barreda S, Bouvier NM, Ristenpart WD. Aerosol emission and superemission during human speech increase with voice loudness. Scientific Reports. 2019;9:2348. doi: 10.1038/s41598-019-38808-z. - DOI - PMC - PubMed
    1. Baik Y, Nalutaaya A, Kitonsa PJ, Dowdy DW, Katamba A, Kendall EA. Infection status of contacts is not associated with severity of TB in the index case. The International Journal of Tuberculosis and Lung Disease. 2021;25:237–240. doi: 10.5588/ijtld.20.0700. - DOI - PMC - PubMed