. 2023 Dec 26;120(52):e2310221120.
doi: 10.1073/pnas.2310221120. Epub 2023 Dec 18.

Hyperactive Rac stimulates cannibalism of living target cells and enhances CAR-M-mediated cancer cell killing

Affiliations

Hyperactive Rac stimulates cannibalism of living target cells and enhances CAR-M-mediated cancer cell killing

Abhinava K Mishra et al. Proc Natl Acad Sci U S A. .

Abstract

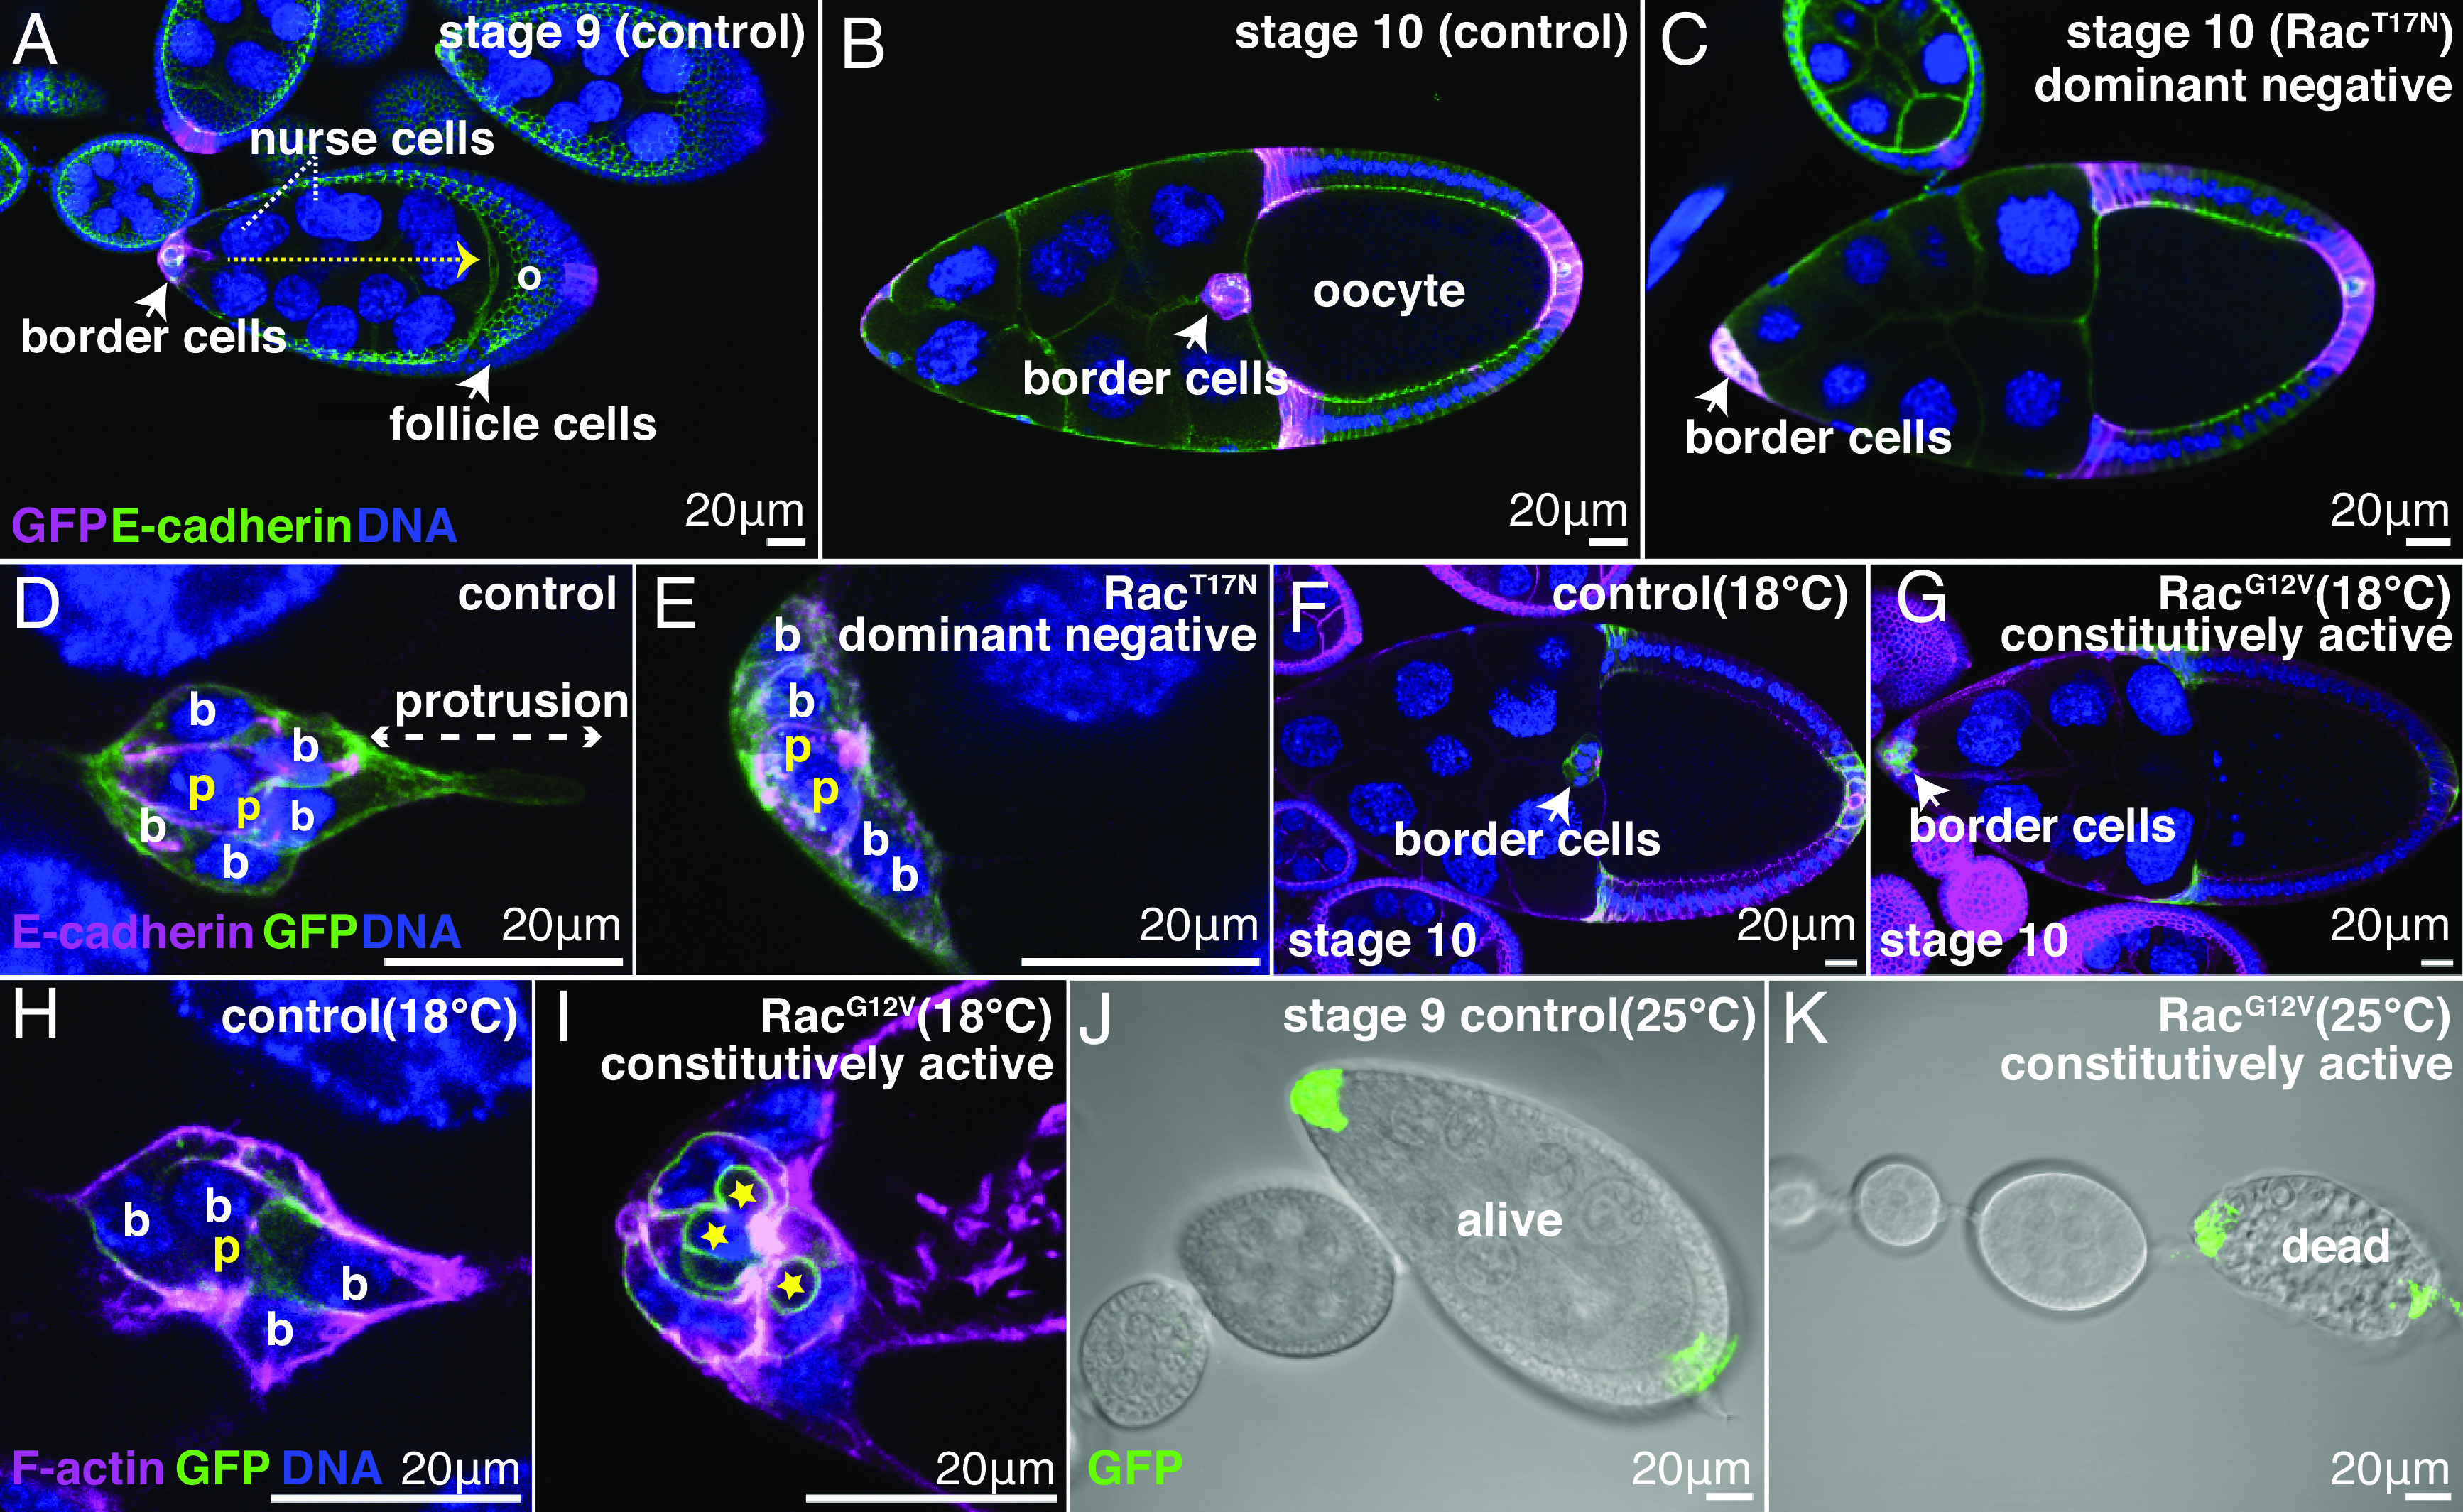
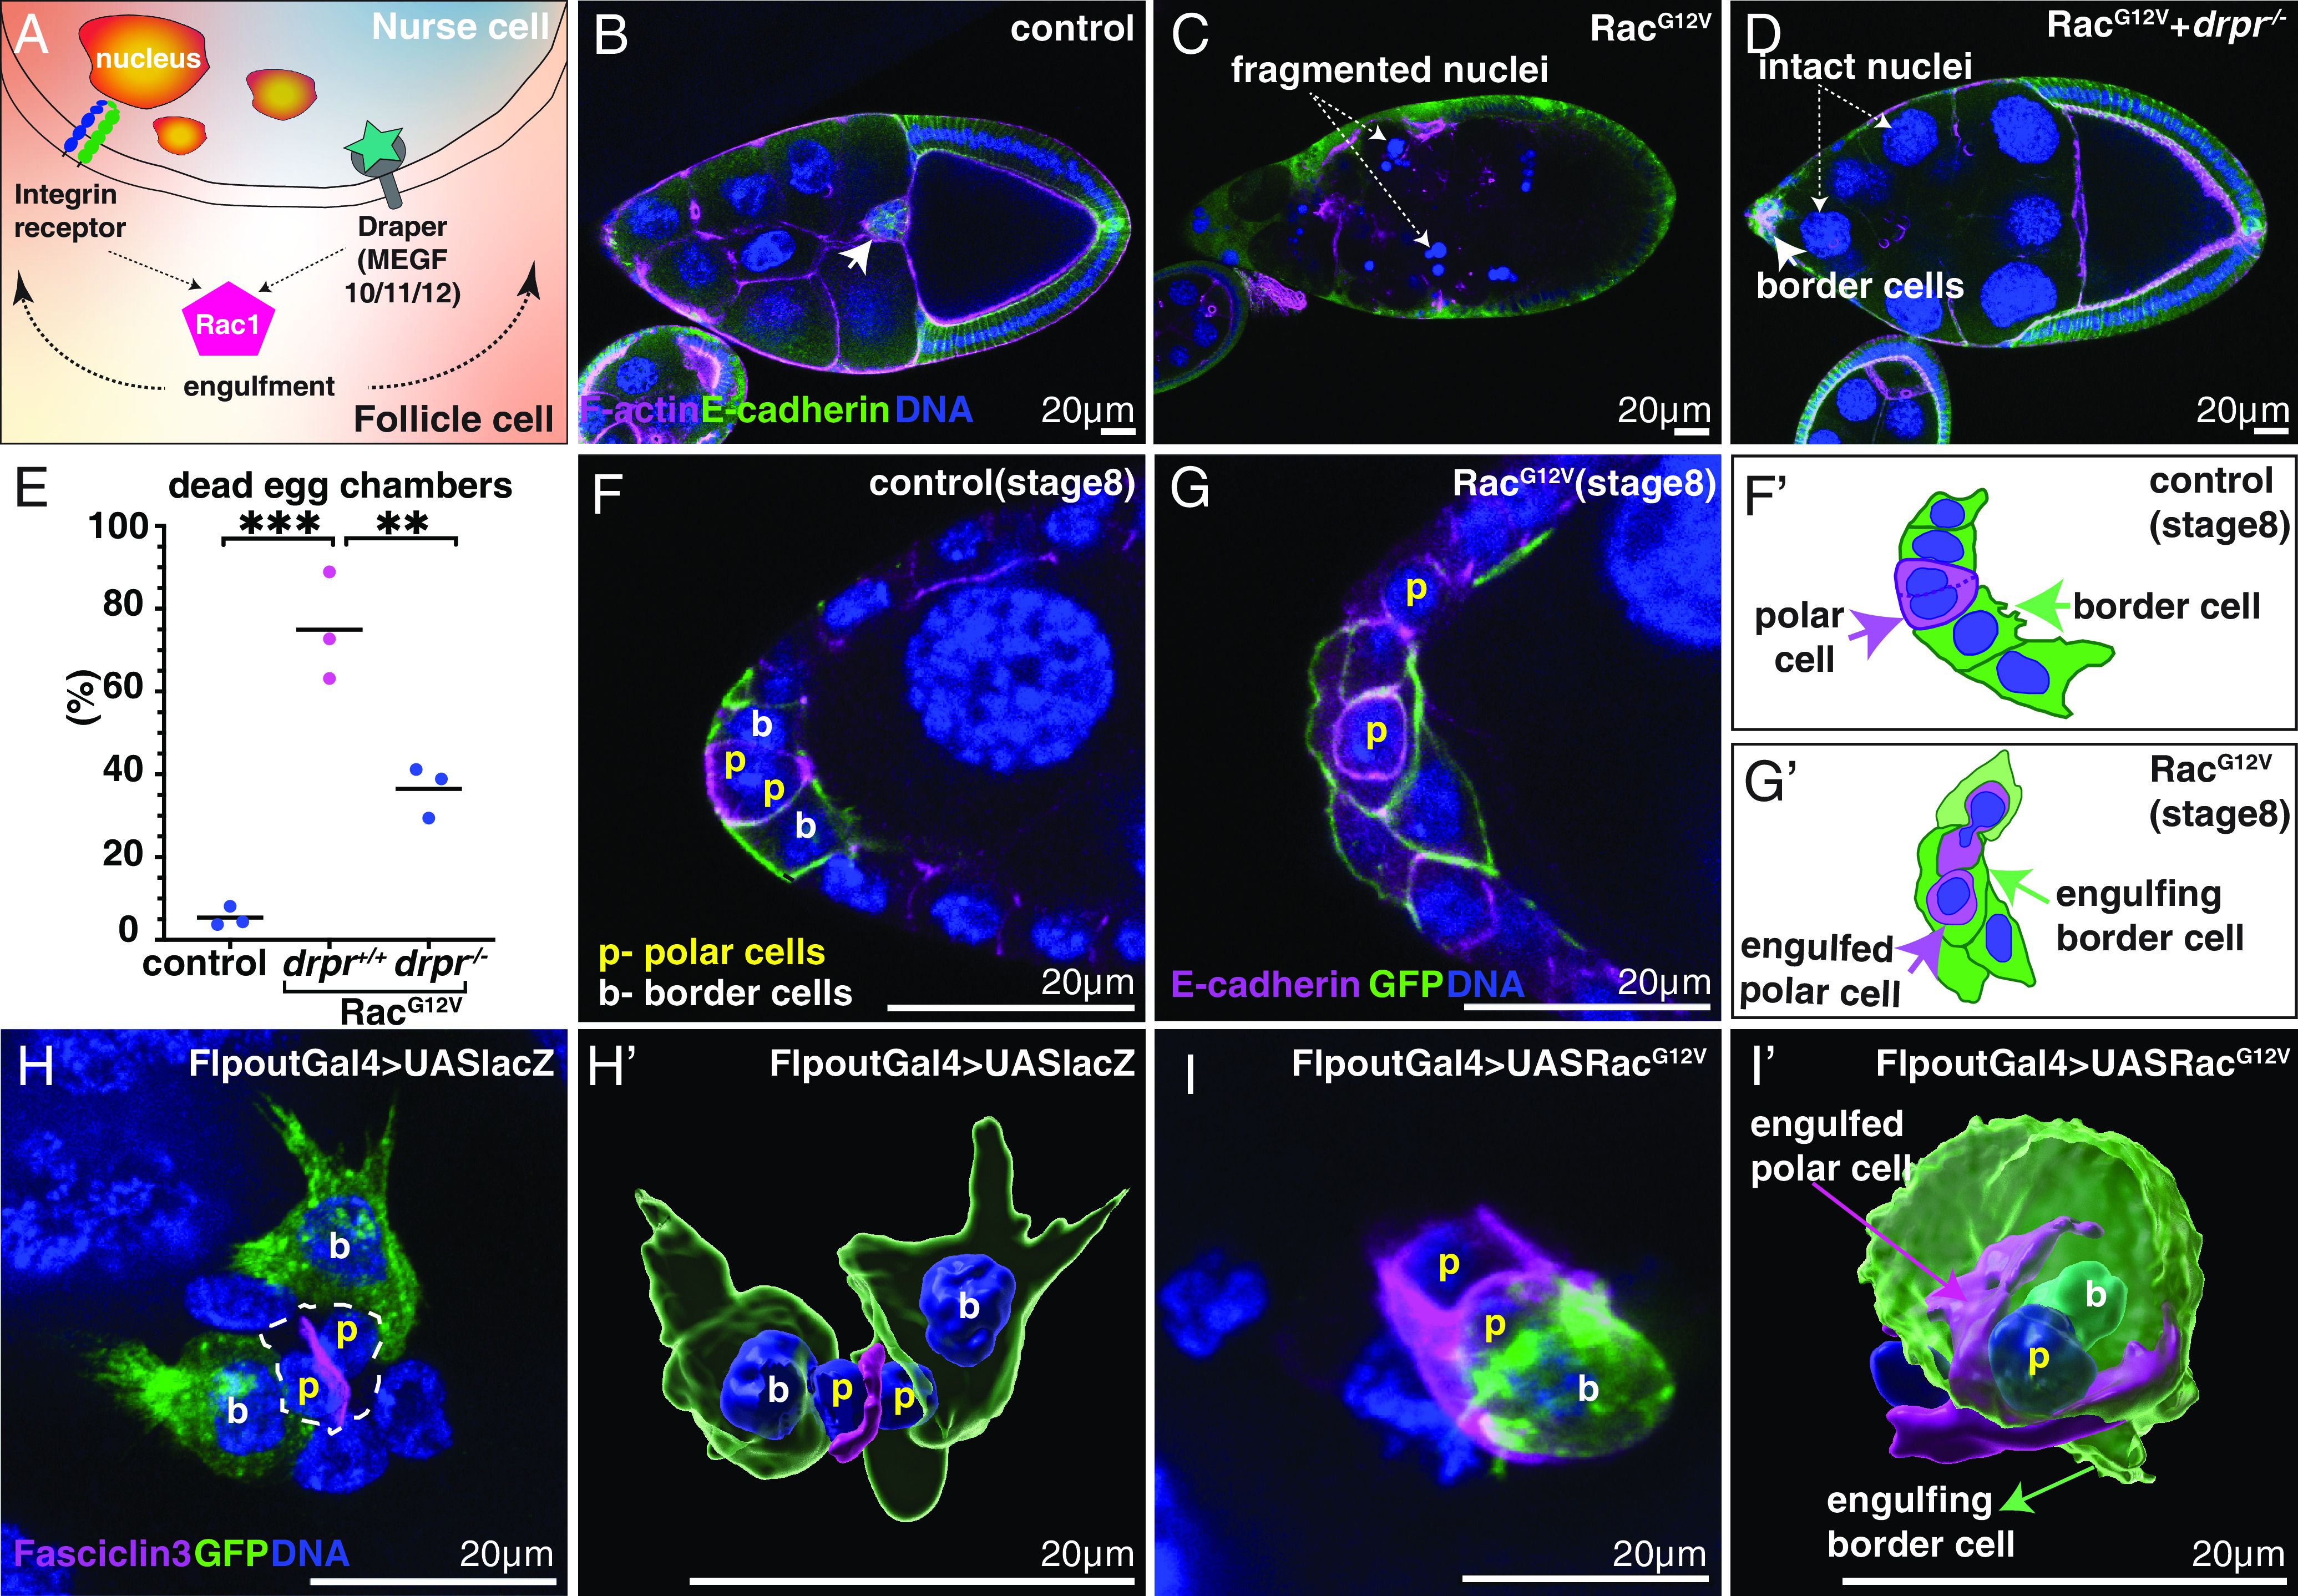
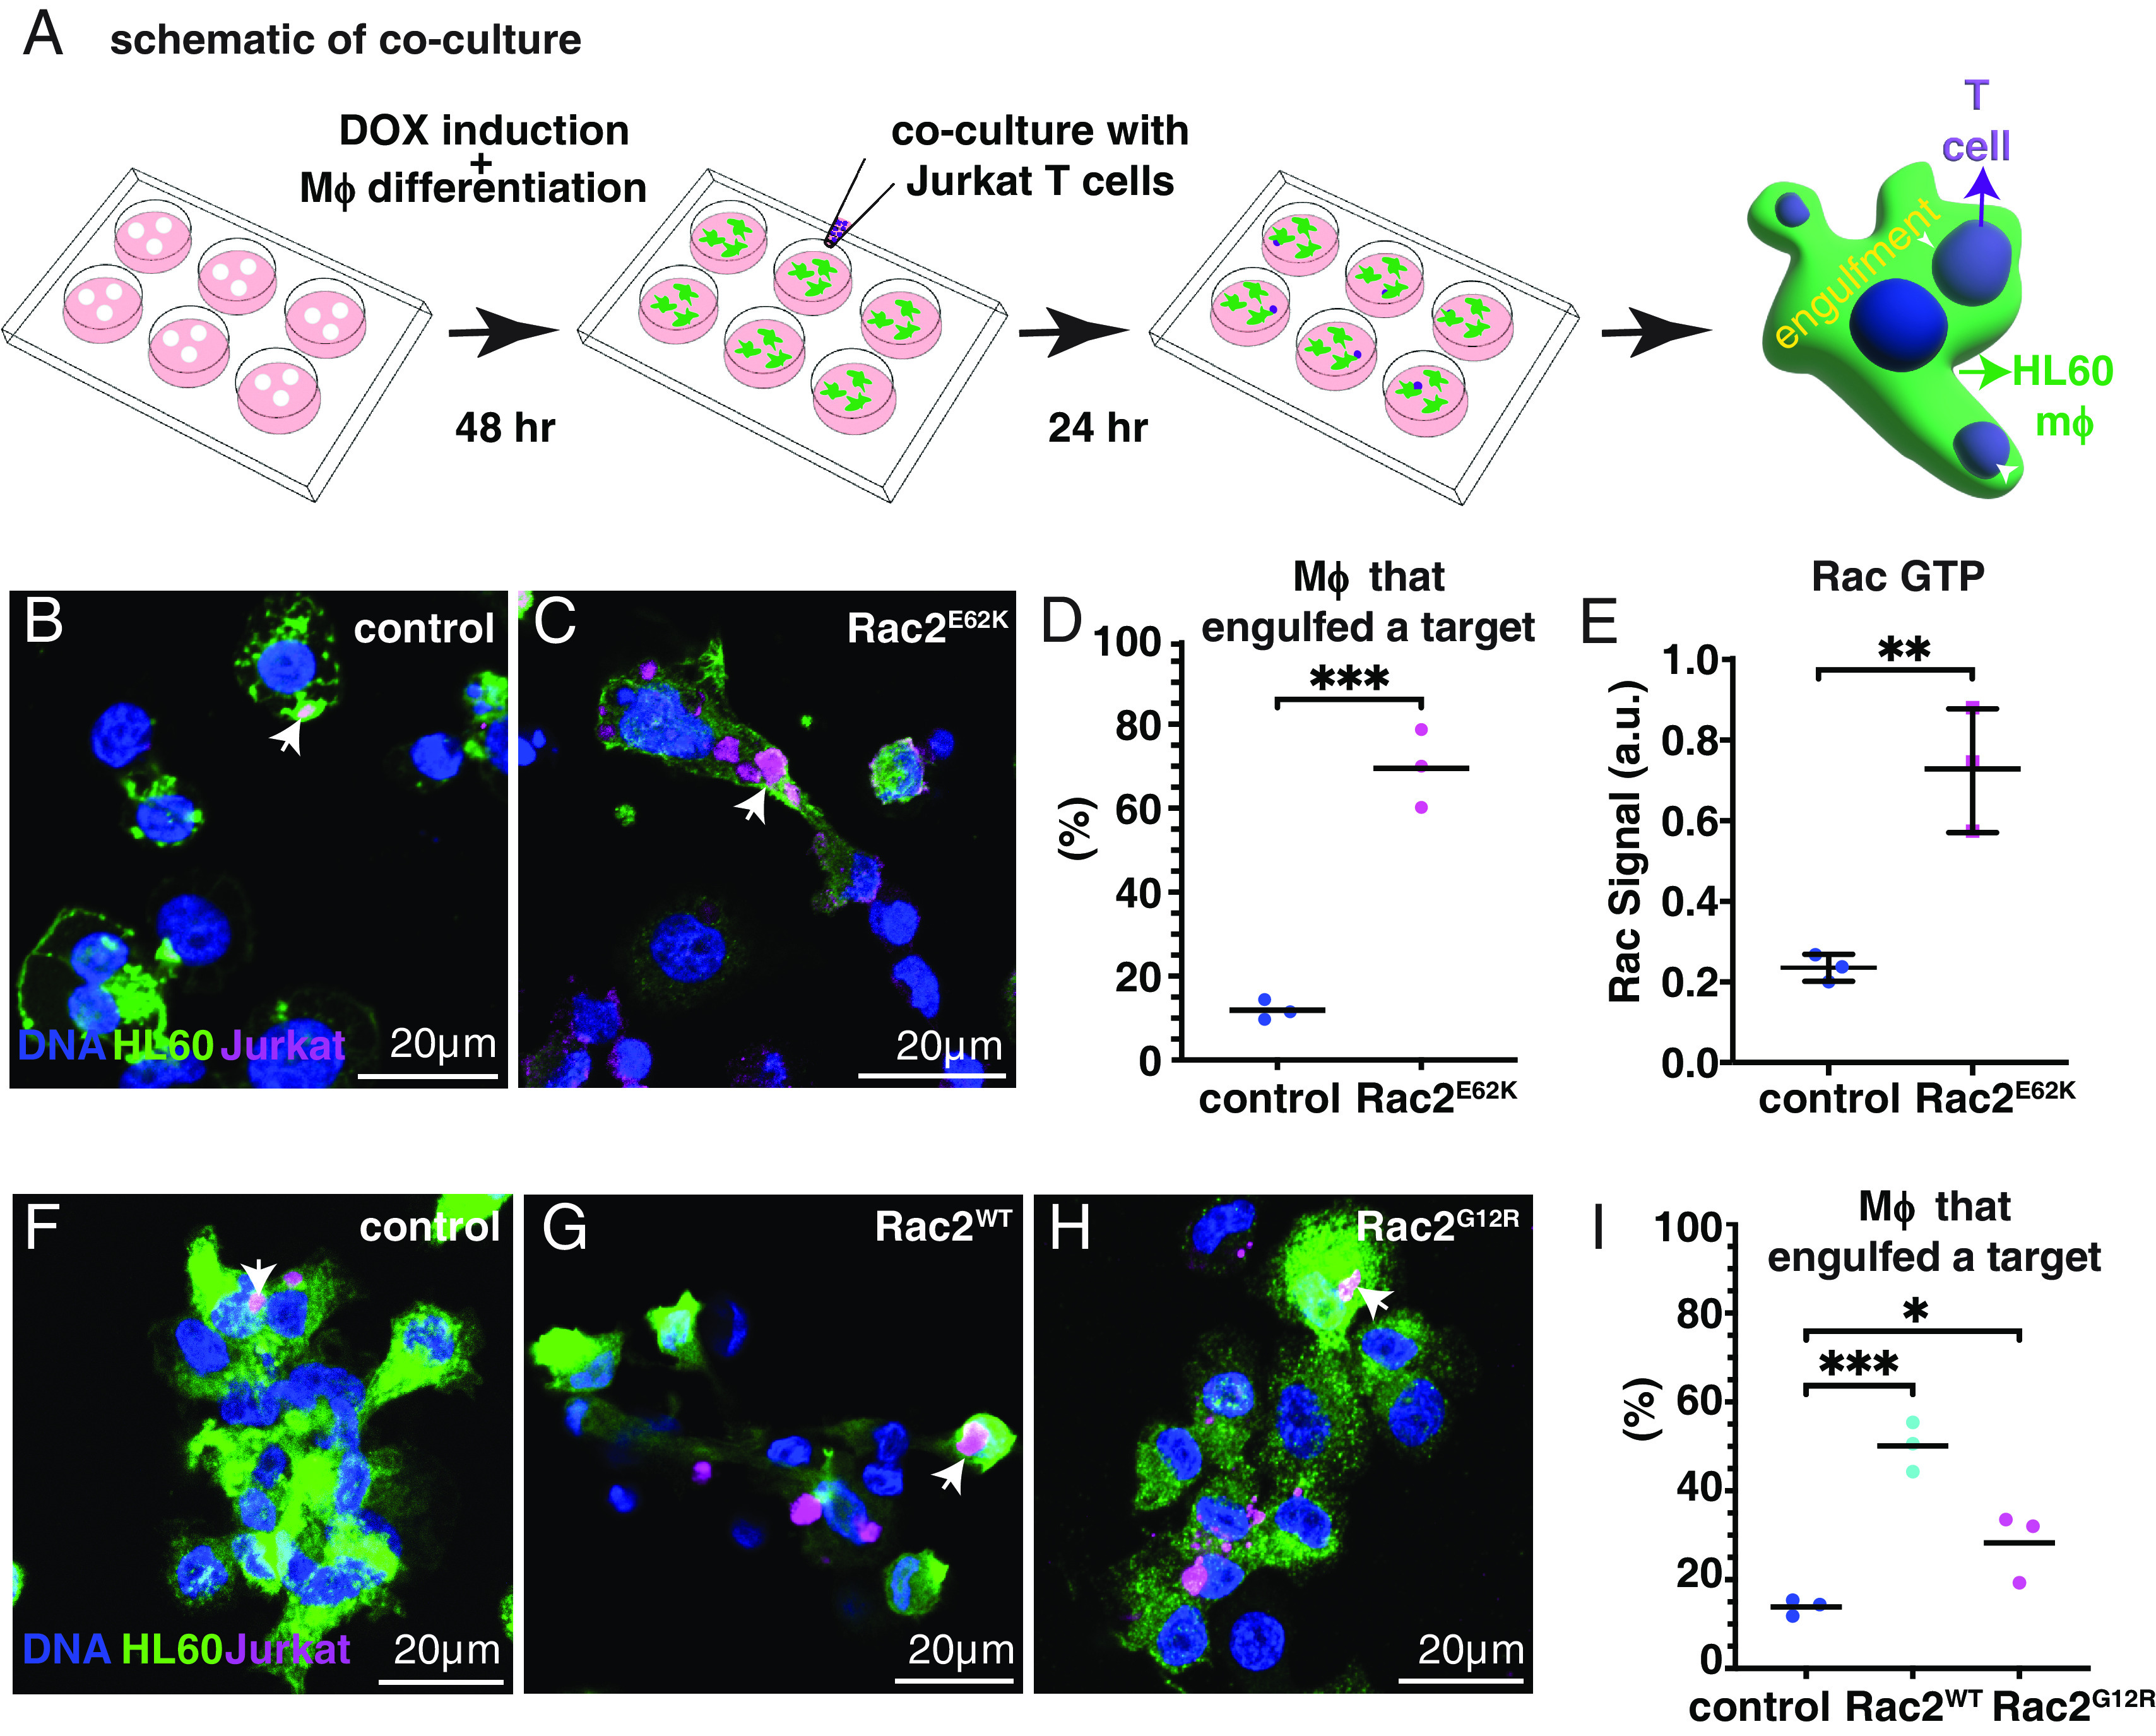
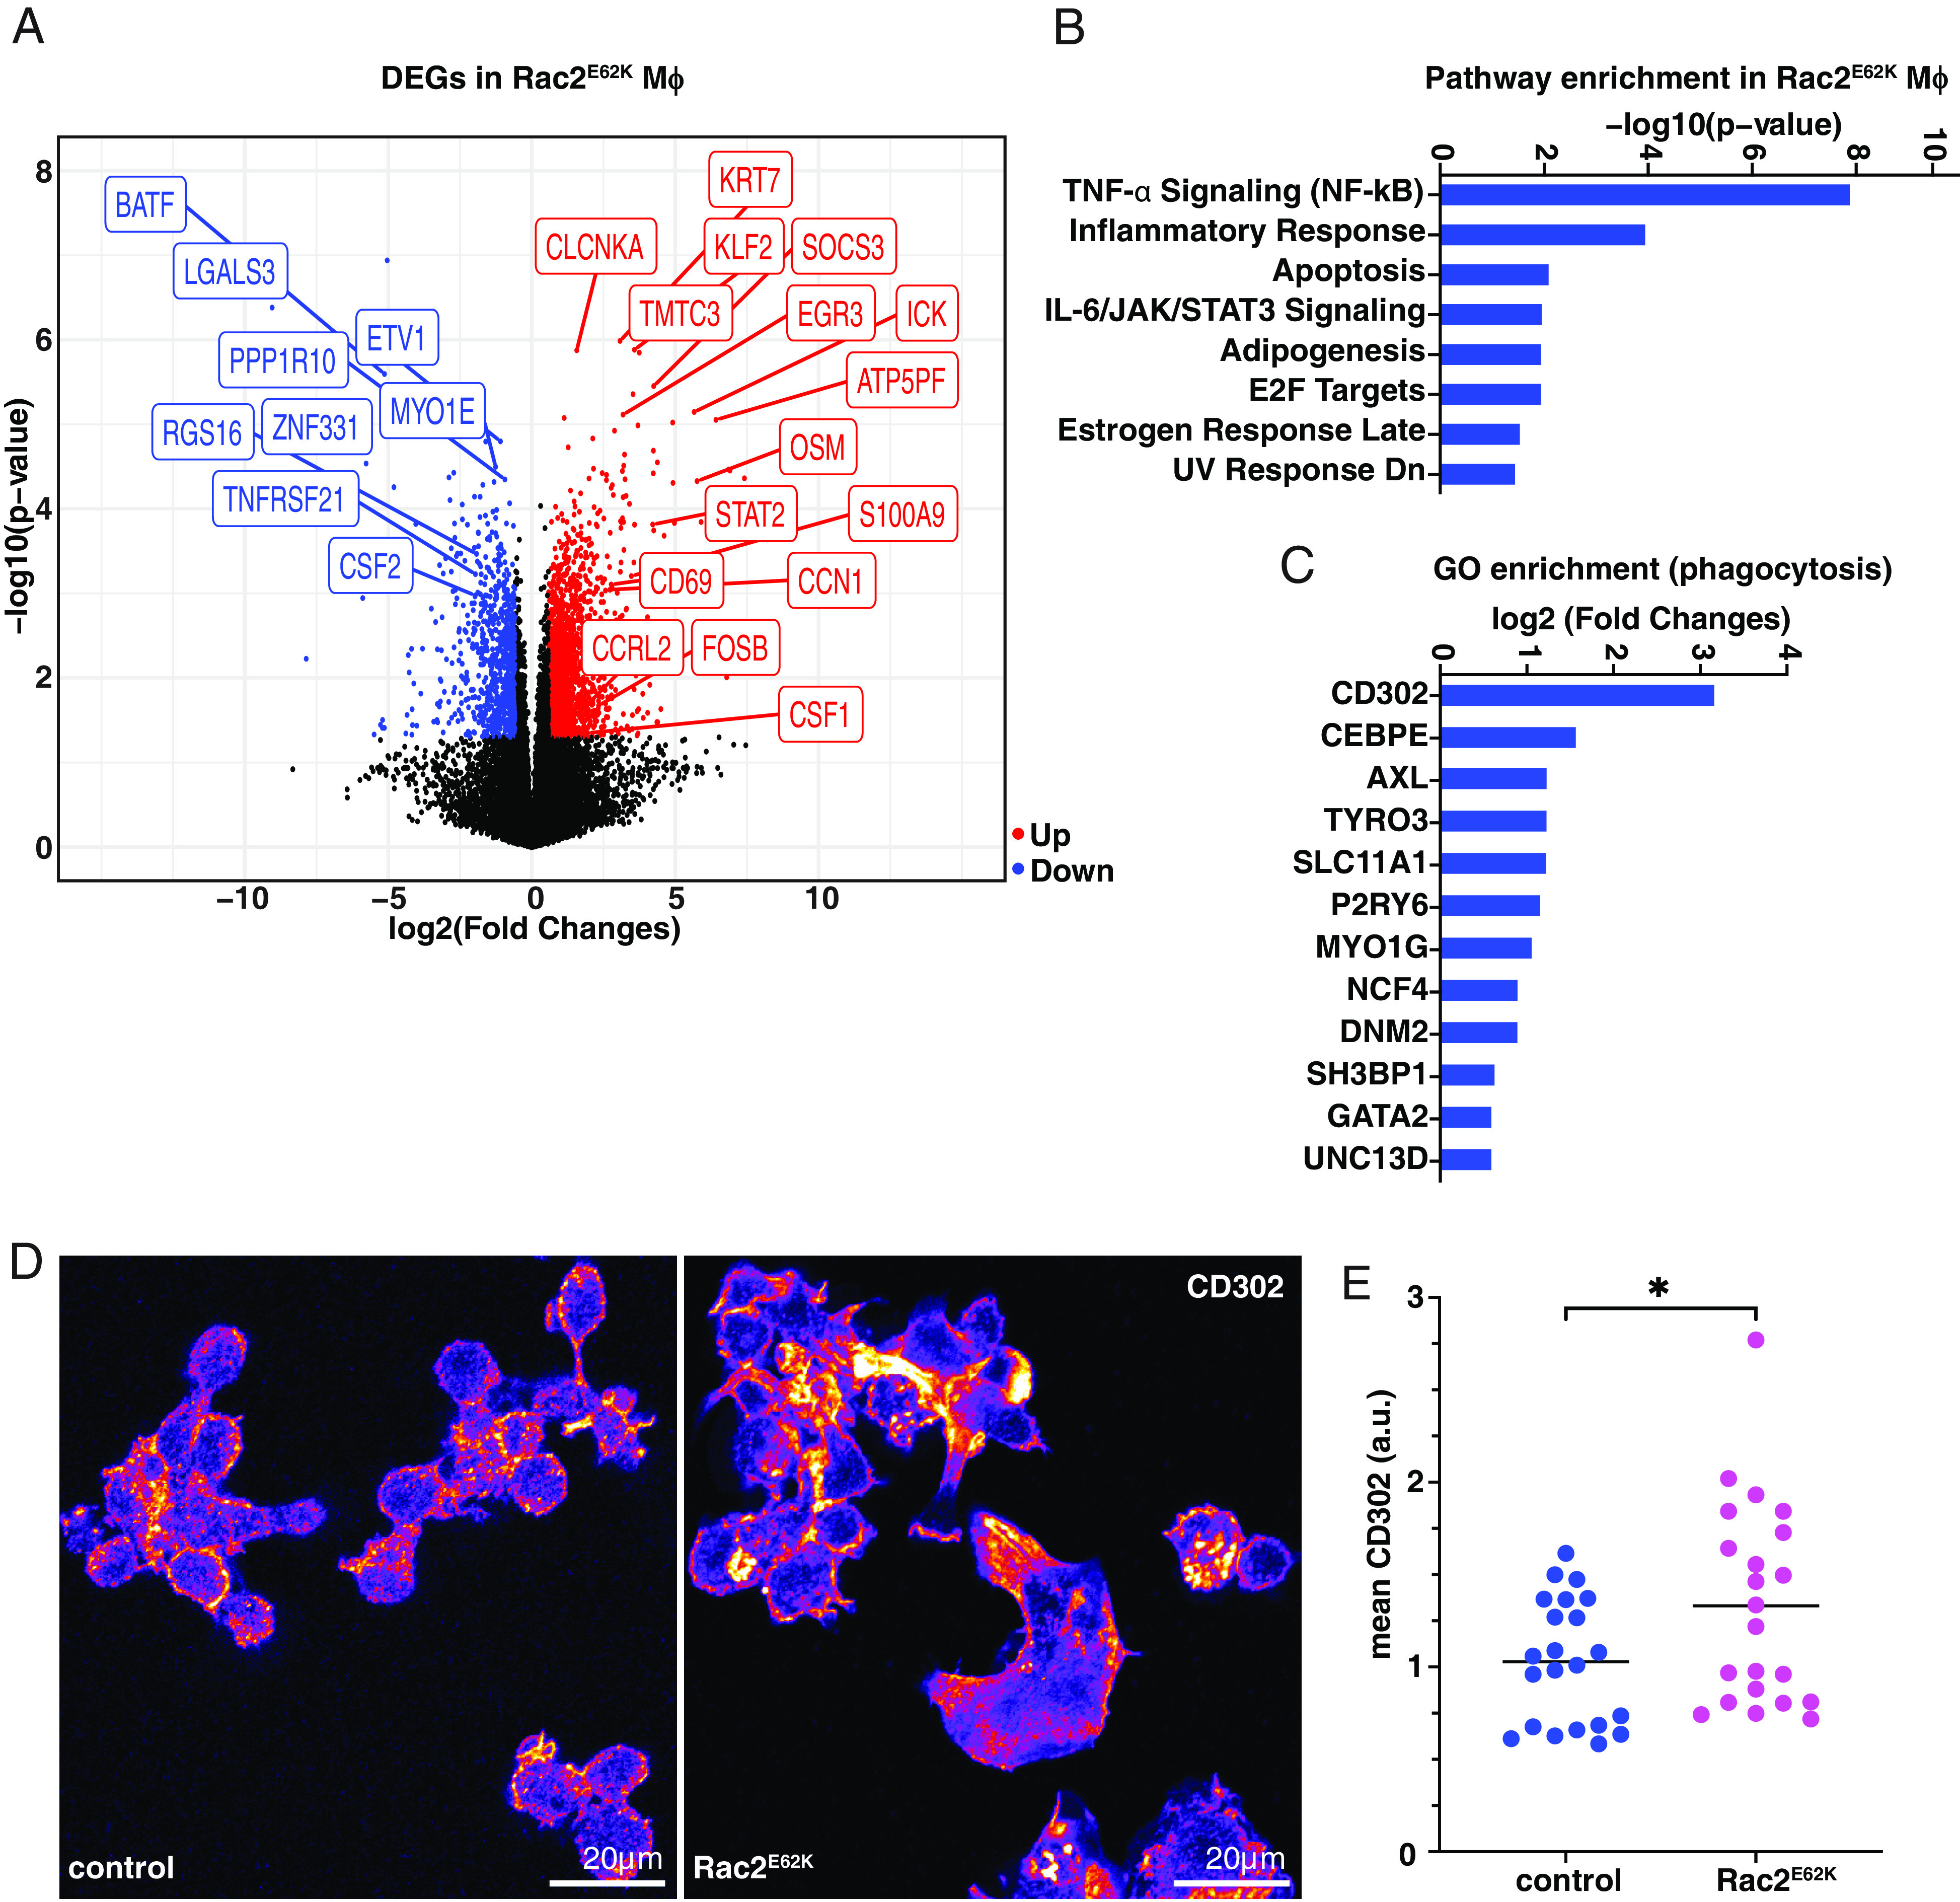
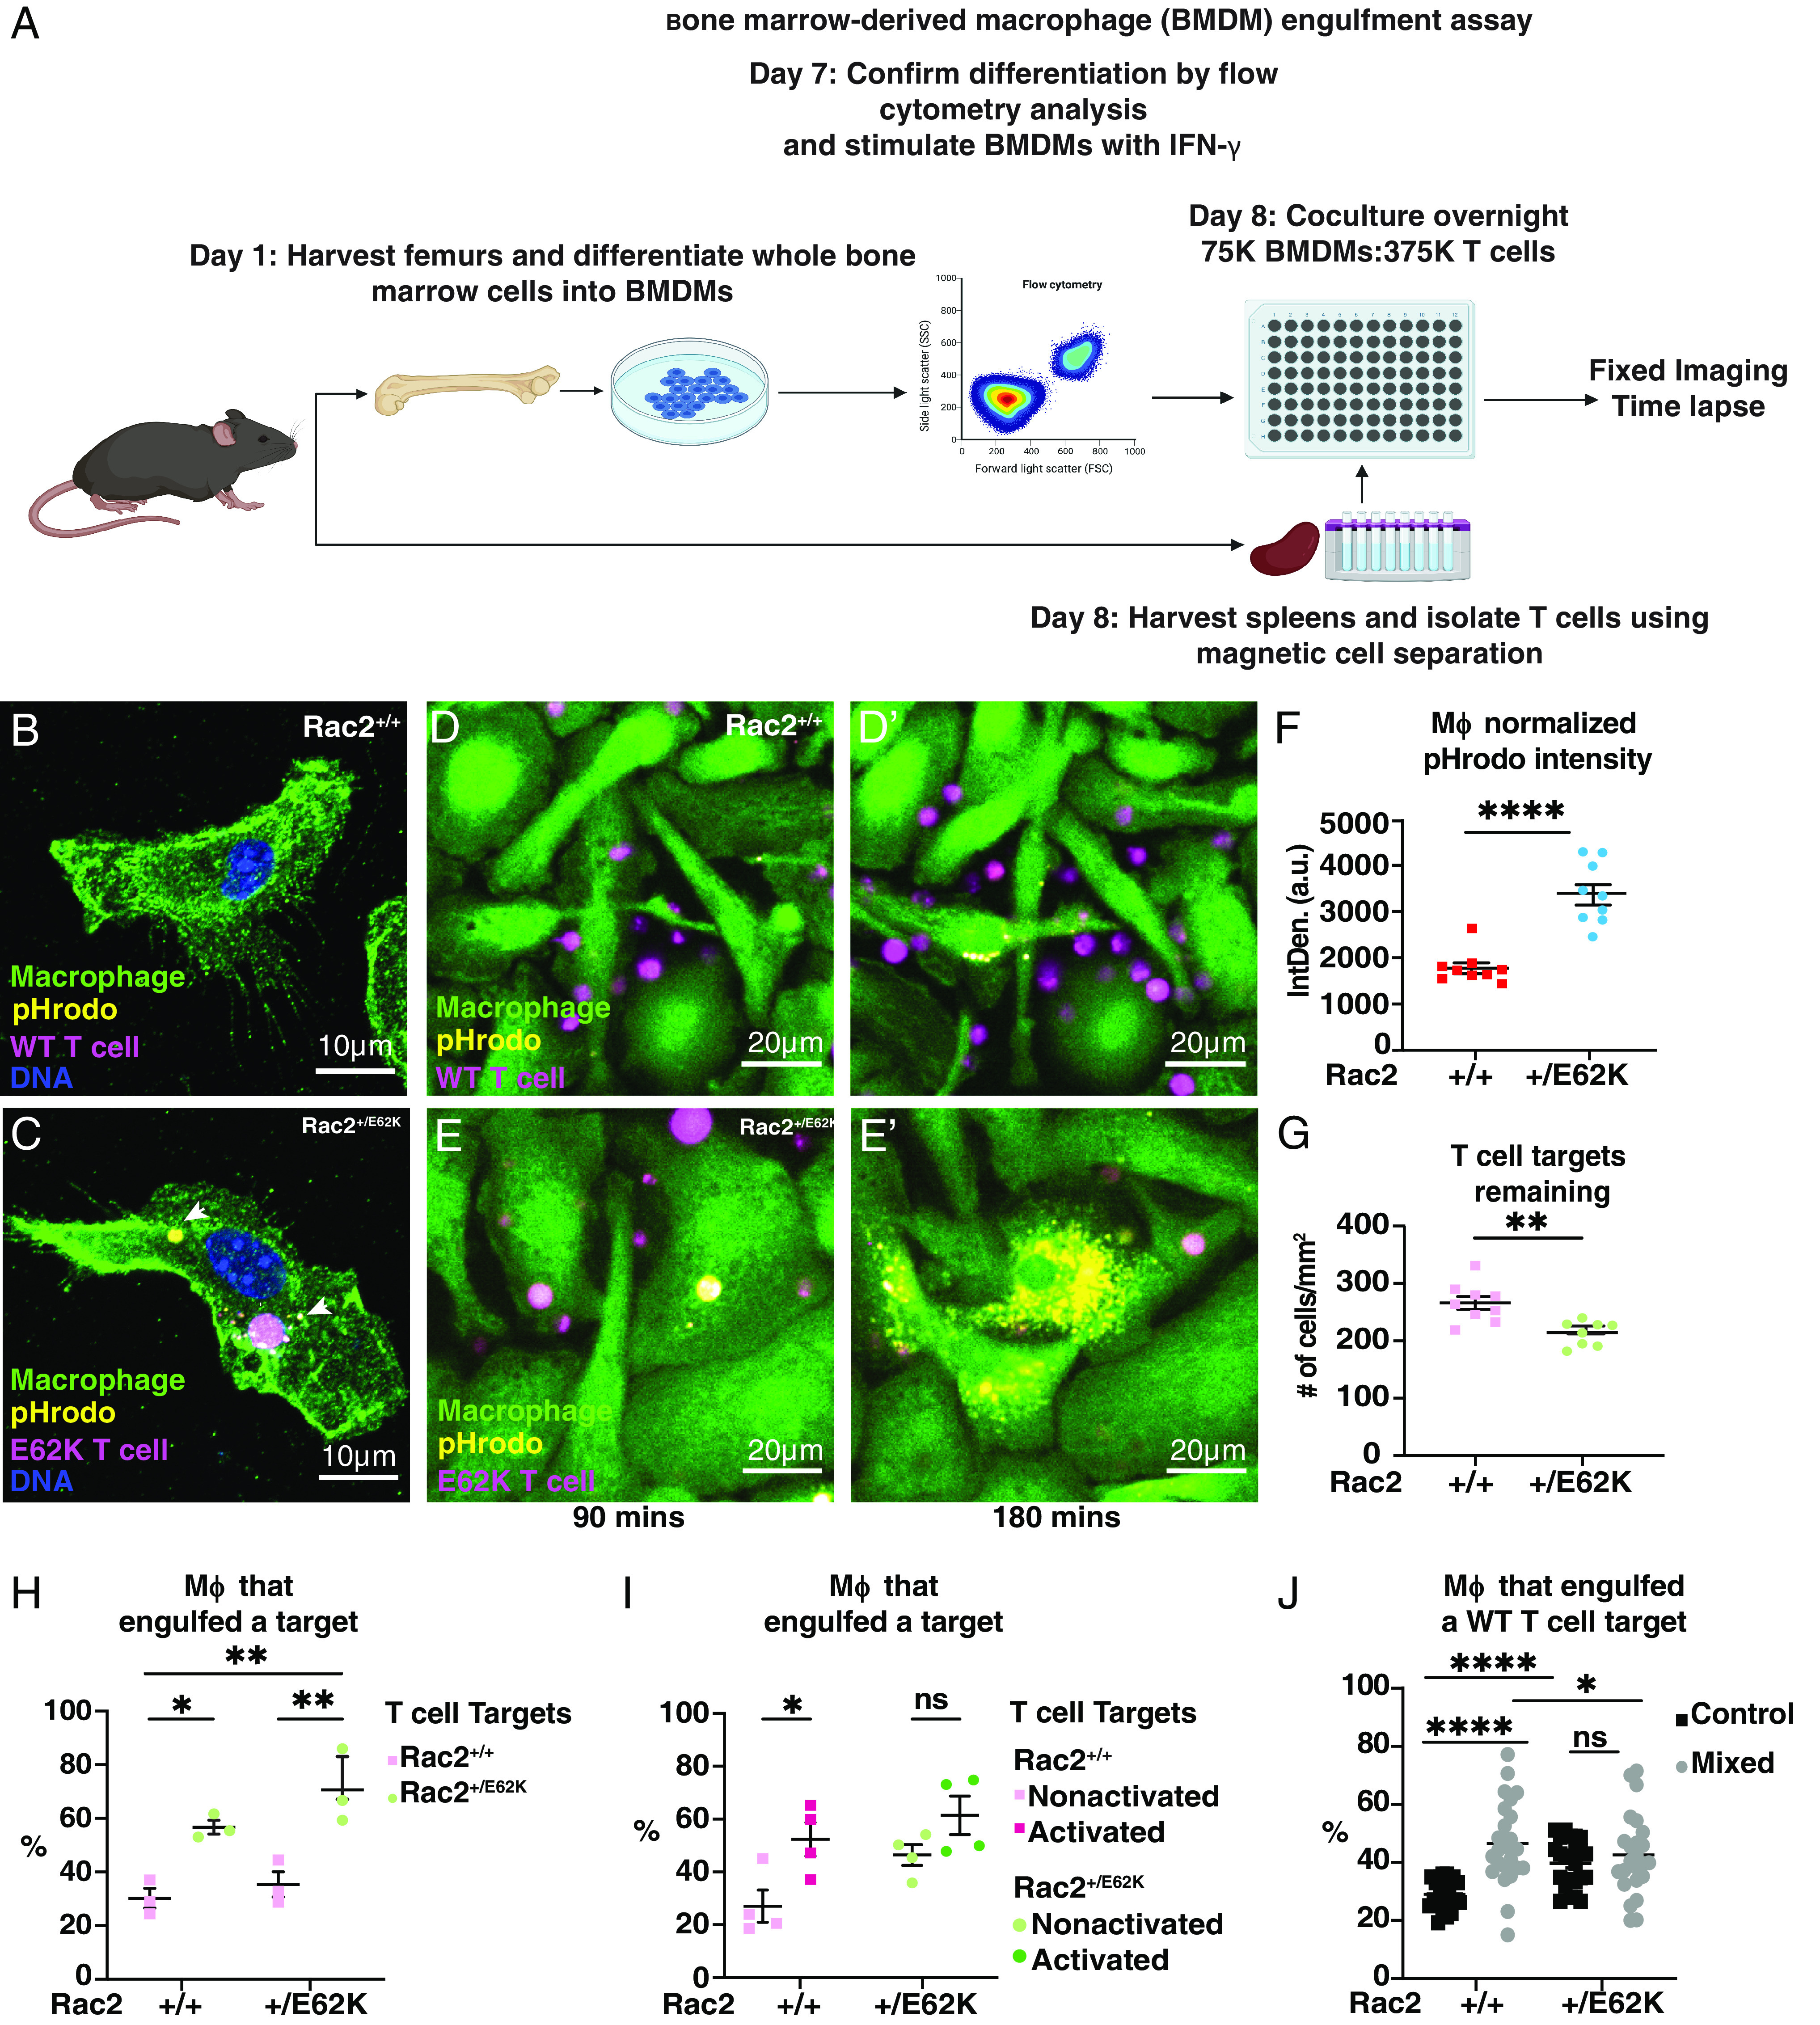
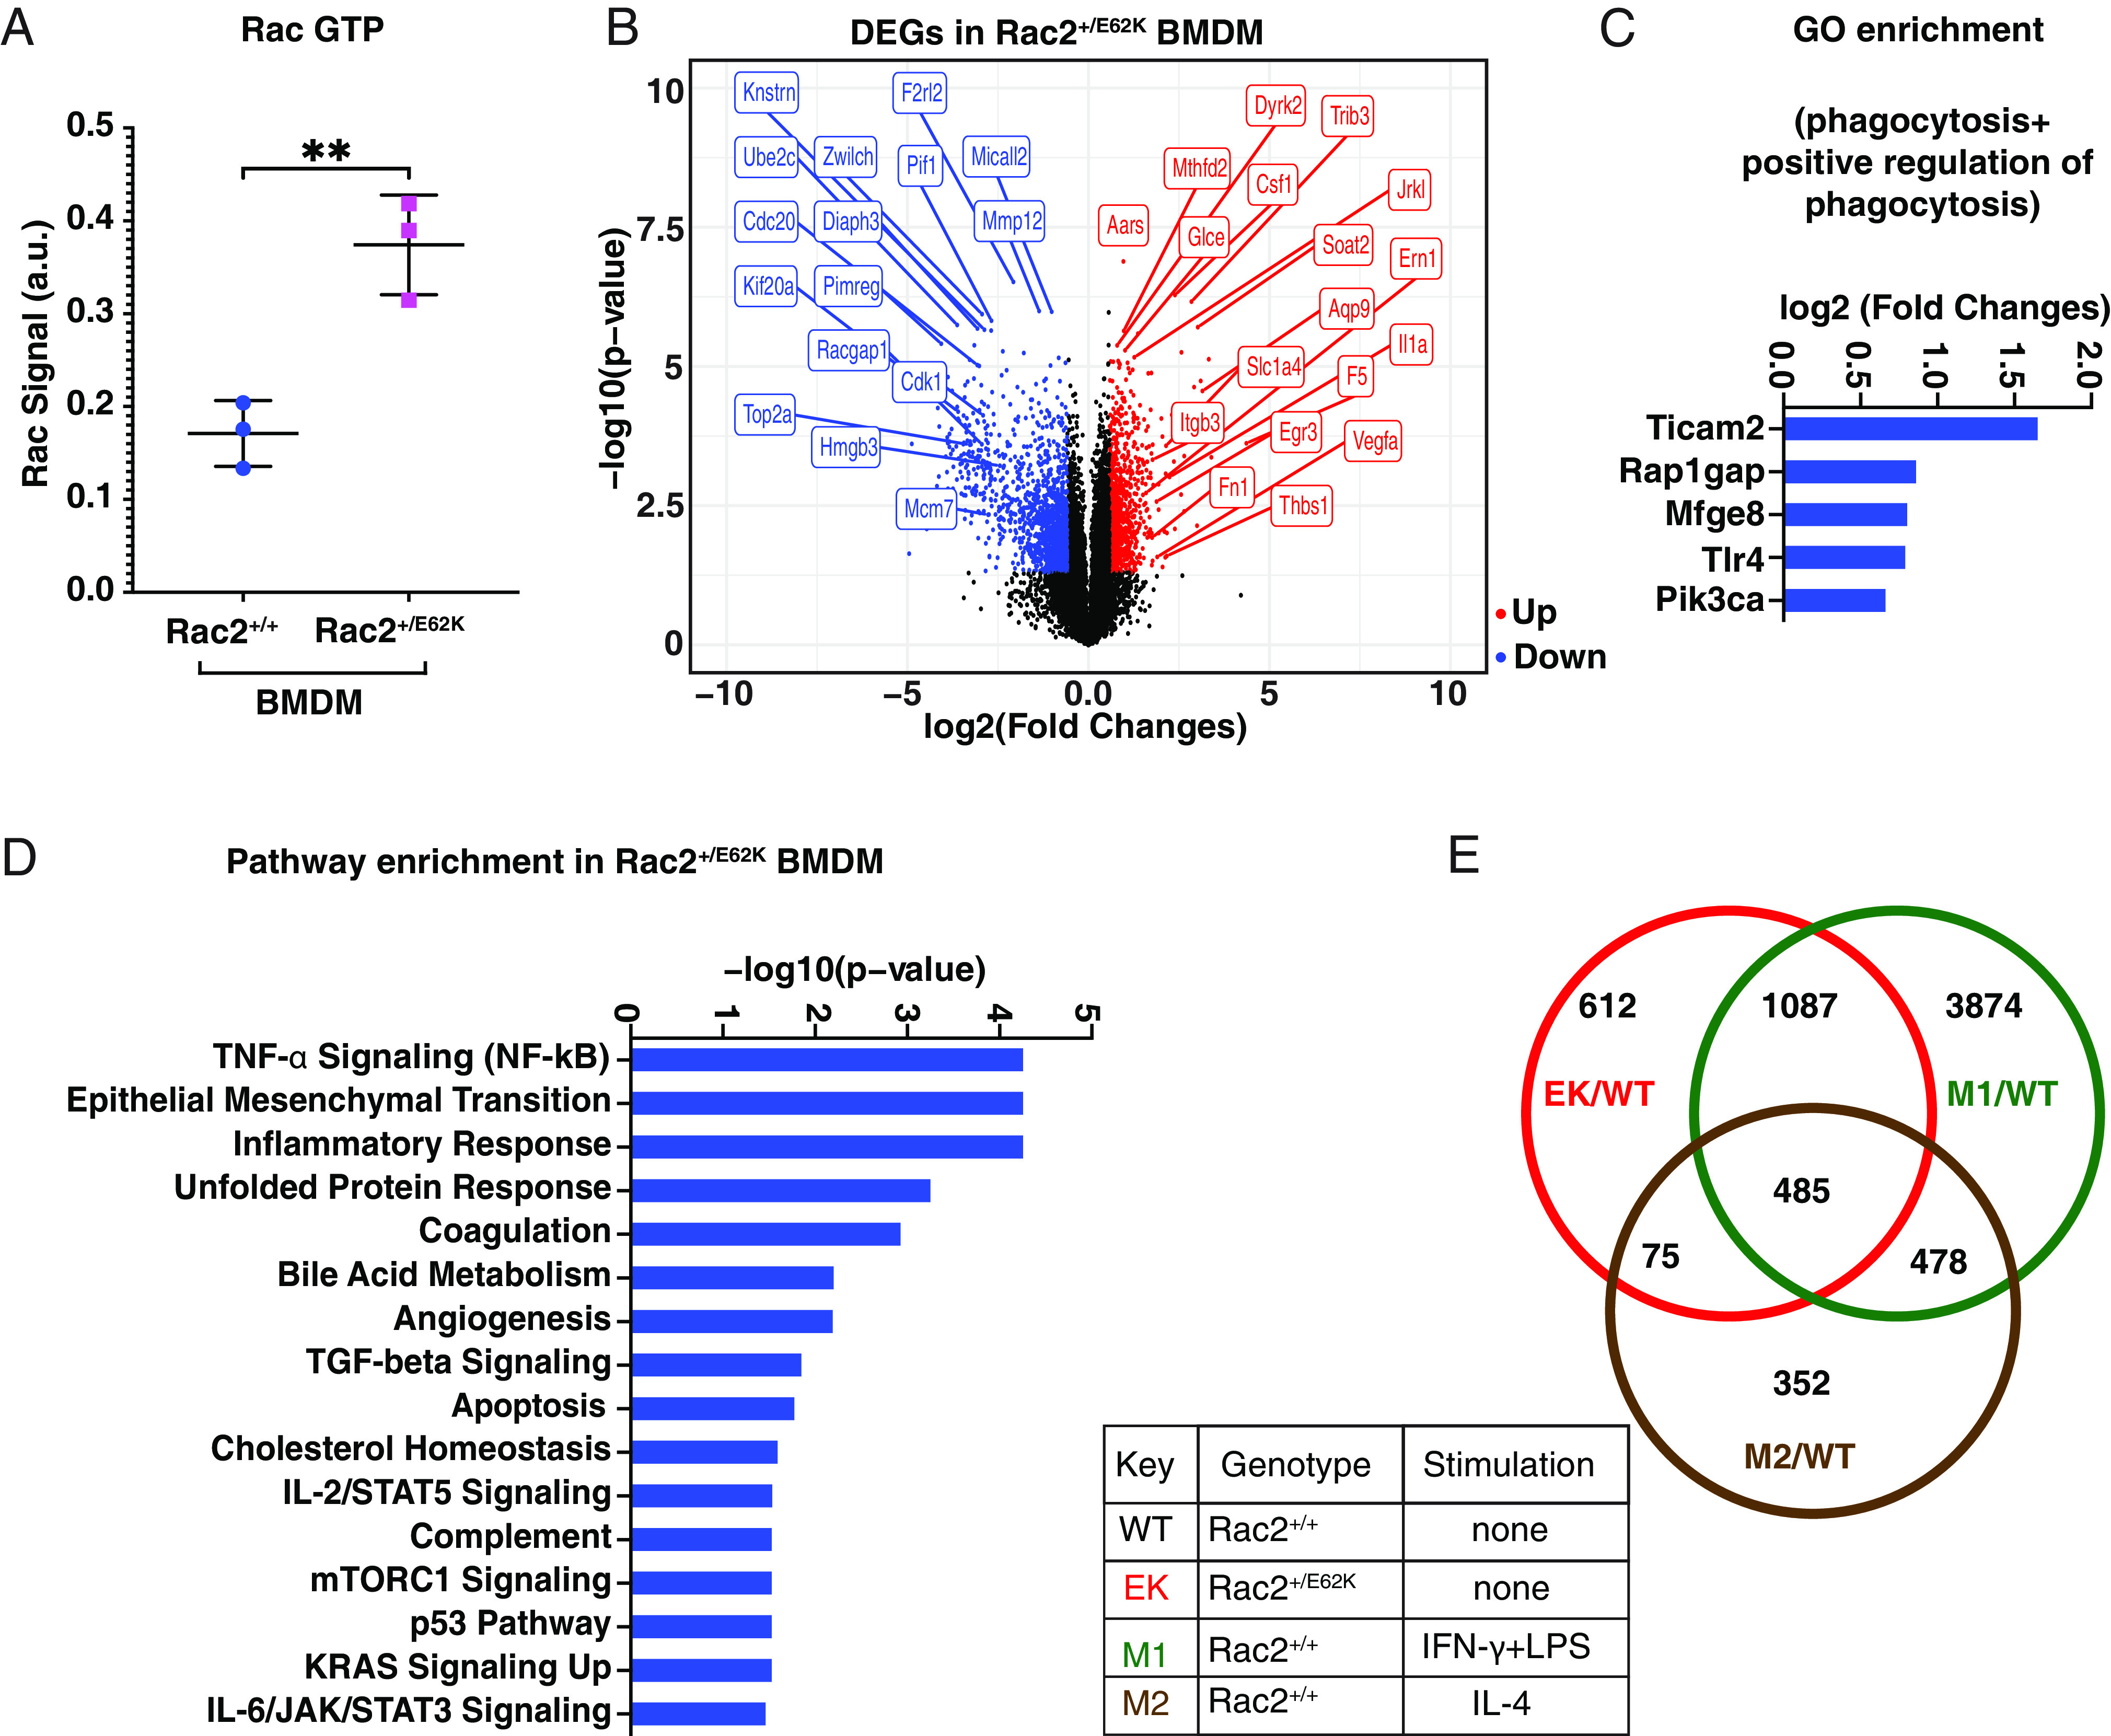
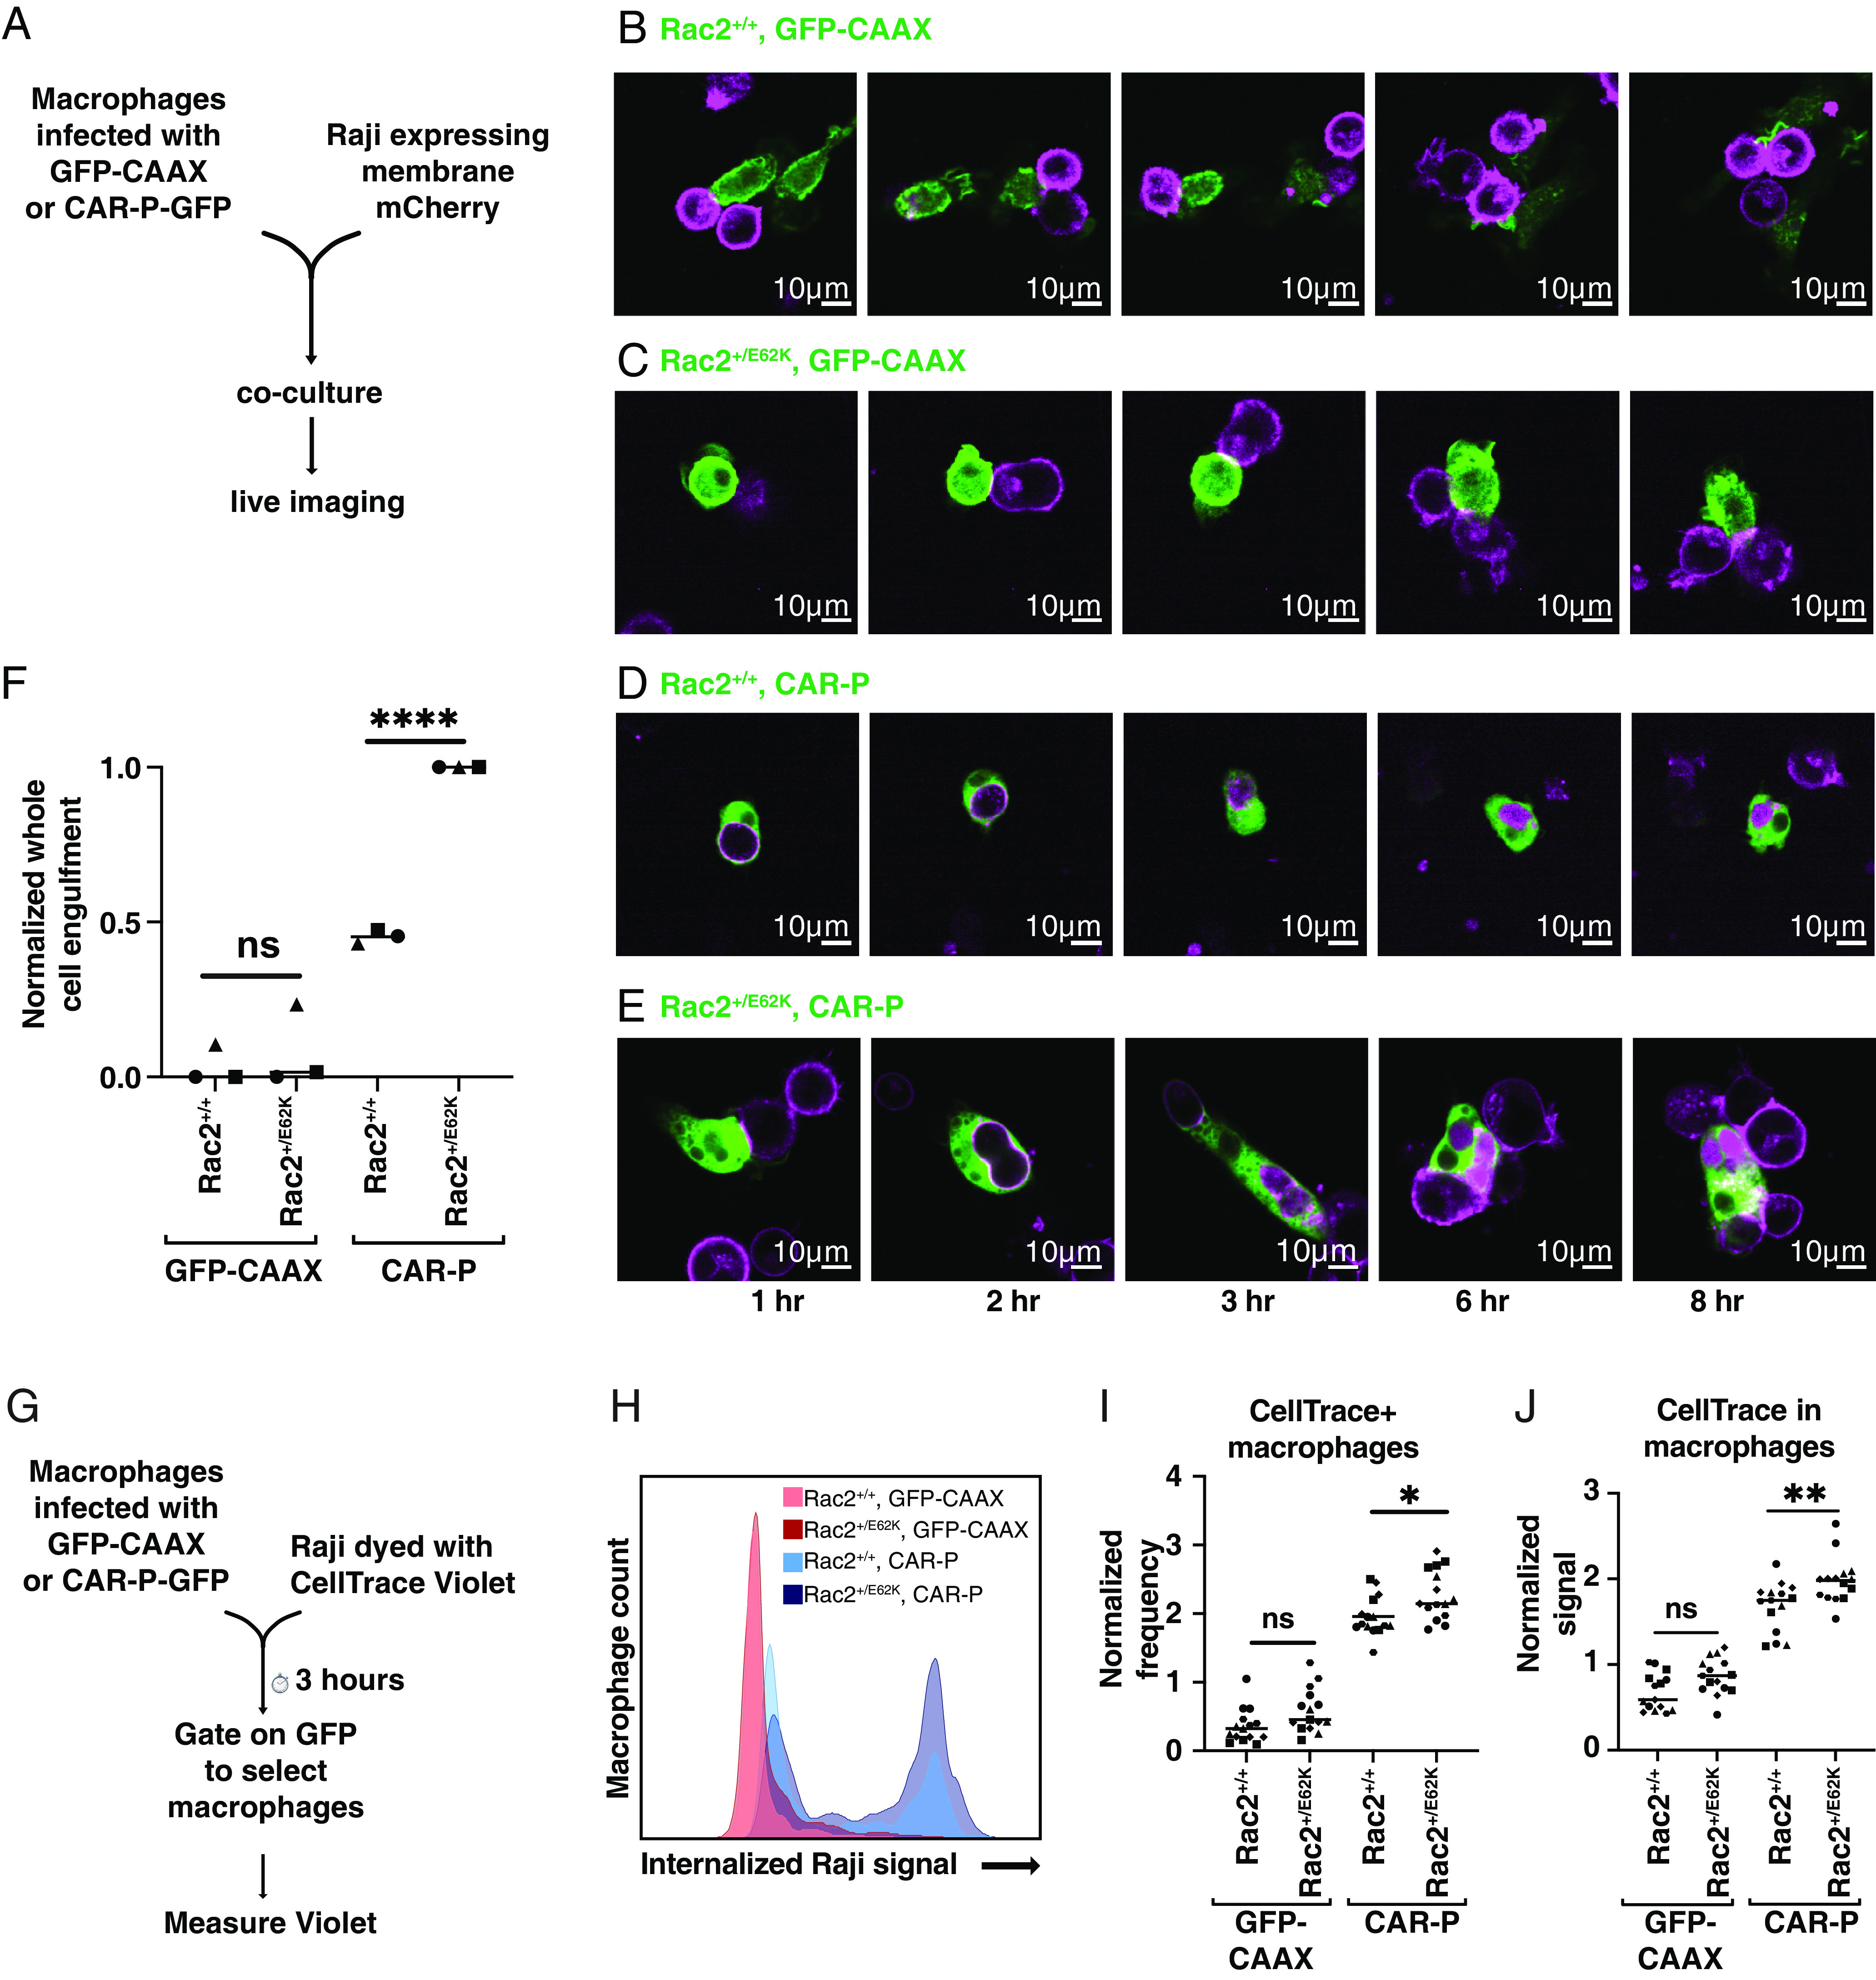
The 21kD GTPase Rac is an evolutionarily ancient regulator of cell shape and behavior. Rac2 is predominantly expressed in hematopoietic cells where it is essential for survival and motility. The hyperactivating mutation Rac2E62K also causes human immunodeficiency, although the mechanism remains unexplained. Here, we report that in Drosophila, hyperactivating Rac stimulates ovarian cells to cannibalize neighboring cells, destroying the tissue. We then show that hyperactive Rac2E62K stimulates human HL60-derived macrophage-like cells to engulf and kill living T cell leukemia cells. Primary mouse Rac2+/E62K bone-marrow-derived macrophages also cannibalize primary Rac2+/E62K T cells due to a combination of macrophage hyperactivity and T cell hypersensitivity to engulfment. Additionally, Rac2+/E62K macrophages non-autonomously stimulate wild-type macrophages to engulf T cells. Rac2E62K also enhances engulfment of target cancer cells by chimeric antigen receptor-expressing macrophages (CAR-M) in a CAR-dependent manner. We propose that Rac-mediated cell cannibalism may contribute to Rac2+/E62K human immunodeficiency and enhance CAR-M cancer immunotherapy.

Keywords: Drosophila; Rac GTPase; lymphopenia; macrophage; phagocytosis.


Conflict of interest statement

Competing interests statement:The University of California, Santa Barbara has filed a patent application on the basis of these findings.

Figures

Fig. 1.
Fig. 1.
Constitutively active Rac (RacG12V) in a subset of follicle cells causes wholesale tissue destruction. slbo-Gal4; UAS-PLCδ1-PH-GFP egg chambers of the indicated stages and genotypes. (AI) Confocal micrographs of (A) UAS-lacZ control showing border cell migration path (dotted arrow). Oocyte (o). (B) Stage 10 UAS-lacZ control showing completed migration. (C) Stage 10, UAS-Rac1T17Nshowing failed migration. (D) Control UAS-lacZ cluster. Border cells (b) surround and carry non-motile polar cells (p). The lead border cell protrudes, initiating migration. (E) UAS- Rac1T17N clusters lack protrusions. (F) Completed migration in control, UAS-lacZ. (G) Failed border cell migration in UAS-RacG12V. (H) Normal cluster morphology of UAS-lacZ control, (I) Abnormal cluster morphology in UAS-Rac1G12V. Phalloidin labels F-actin (magenta in H and I). (J and K) DIC imaging of (J) normal egg chamber morphology in a UAS-lacZ control and (K) dead UAS-Rac1G12Vegg chamber. Anterior is on the Left.
Fig. 2.
Fig. 2.
Constitutively active Rac (RacG12V) causes germline (nurse cells and oocyte) death and polar cell engulfment. (A) Schematic showing Draper-receptor-mediated engulfment of nurse cells by follicle cells. (BG) Confocal micrographs of slbo-Gal4 egg chambers labeled with the indicated markers. Anterior is Left. (B) UAS-lacZ control exhibits normal morphology and completed border cell migration at stage 10. (C) Dying UAS-Rac1G12V egg chamber. (D) The homozygous drpr mutation rescues normal egg chamber morphology but not border cell migration (arrow) in UAS- Rac1G12V. (E) Quantification of dead egg chambers with or without UAS-RacG12V in the wildtype or drpr mutants. All data were analyzed by one-way ANOVA with Tukey’s multiple comparisons test. ** indicates P < 0.005 and ***P < 0.0005. N = 87 (control), 53 (RacG12V) and 66 (RacG12V; drpr−/−) egg chambers from three independent experiments (dots). (F and G) Stage 8 slbo-Gal4; UAS-PLCδ1-PH-GFP egg chambers showing (F) border cells (b) adjacent to polar cells (p) and (G) UAS- Rac1G12V border cells engulf polar cells (p). (F’ and G’) Schematic drawings of F and G. (H) Clonal expression of either UAS-lacZ (control, H and H’) or UAS-Rac1G12V (I and I’) in the GFP-positive subset of border cells (green). Fasciclin 3 (magenta in HI’) is restricted to the interface between two polar cells in controls (H and H’) whereas border cells expressing RacG12V (I and I’) engulf polar cells, delocalizing Fasciclin 3. H’ and I’ are 3D Imaris surface renderings of H and I.
Fig. 3.
Fig. 3.
Constitutively active Rac2E62K in HL60-derived macrophage-like cells enhances engulfment and killing of leukemic Jurkat T cells. (A) Schematic of experimental design. (BI) HL60-derived macrophage-like cells expressing Lck-GFP (green) and the indicated Rac2 variant co-cultured with mCherry-labeled (magenta) Jurkat T cells. DNA (labeled with Hoechst, blue) (B) control (Lck-GFP without Rac2 variant) (C) Lck-GFP with Rac2E62K (D) Quantification of N = 614 (control) and 220 (RacE62K) cells from three independent experiments (dots). (E) GTP-bound (active) Rac measured from differentiated HL60 macrophage lysates using the G-LISA Rac 1,2,3 Activation Assay Kit (Cytoskeleton, Inc.). Each dot is an average of two technical replicates. Statistics: Unpaired t test. **P < 0.005 and ***P < 0.0005. (F) Control (Lck-GFP alone), (G) Rac2WT, (H) Rac2G12R, (I) Quantification of engulfment. N = 1,140 (control), 223 (RacWT), and 653 (RacG12R) samples from three independent experiments (dots). Engulfment data (FH) were analyzed by one-way ANOVA with Tukey’s multiple comparisons test. * indicates P < 0.05 and ***P < 0.0005.
Fig. 4.
Fig. 4.
Effect of Rac2E62K on gene expression in HL60-derived macrophage-like cells. (A) Volcano plot representation of DEGs. Red dots (upregulated ≥1.5X), blue dots (downregulated ≥1.5X), and black dots (mRNAs changed <1.5X and insignificant p-value) in Rac2E62K-expressing cells. Data were mapped, analyzed, and extracted from the Subio Platform [v1.24 (Subio, Inc., Japan)] and plotted in R. Select DEGs are labeled. (B) Pathway enrichment analysis was performed in Enrichr (Ma’ayan laboratory) on upregulated genes with a fold change (FC) >3 and the Molecular Signatures Database (MSigDB) Hallmark 2020 output data were plotted. (C) GO term “phagocytosis” in DEGs and upregulated genes with FC > 1.5 and P-value < 0.05. (D) CD302 expression in (control) HL60-LckGFP or Rac2E62K-Lck-GFP macrophages. (E) Mean CD302 fluorescence in control and Rac2E62K-expressing macrophages. Statistics: Unpaired t test, * indicates P < 0.05.
Fig. 5.
Fig. 5.
Rac2E62K enhances phagocytosis of T cells by macrophages and sensitizes T cells to engulfment. (A) Schematic of the phagocytosis assay. Rac2+/+ (WT) and Rac2+/E62K BMDMs were incubated overnight with T cells labeled with CellTrace Far Red and pHrodo Red (B and C). Representative confocal images of BMDMs. (DE’) 10-h time-lapse imaging of macrophage (green) and T cell (magenta) coculture. pHrodo (yellow). Images correspond to Movies S4 and S5. (F) pHrodo intensity as measured by integrated density (a.u.) and normalized to the number of macrophages in the field of view. Each point represents a measurement from one field of view. (G) Total number of T cell targets remaining at the end of a 10-h engulfment time-lapse experiment. Each point represents a measurement from one field of view. (H) Percentage of macrophages that engulfed at least one T cell target. Each point represents the average from two wells. (I) Percentage of macrophages that engulfed at least one T cell target (activated or non-activated). Each point represents the average from two wells. (J) Percentage of macrophages that engulfed at least one WT T cell in control or mixed macrophage conditions. Each point represents a technical replicate. n = 3 biological replicates for experiments (HJ). *, **, and **** indicate P < 0.05, 0.005, and 0.00005 respectively by either an unpaired t test or a two-way ANOVA followed by Sidak’s multiple comparison test. Error bars indicate mean ± SEM.
Fig. 6.
Fig. 6.
Effect of Rac2+/E62K on Rac activity and gene expression in primary BMDMs. (A) GTP-bound (active) Rac was measured from Rac2+/+ and Rac2+/E62K BMDM lysates using the G-LISA Rac 1,2,3 Activation Assay Kit (Cytoskeleton, Inc.). Data were analyzed by unpaired t test. ** indicates P < 0.005. (B) Volcano plot representation of differential expression analysis of genes in Rac2+/+ and Rac2+/E62K macrophages. Data was mapped, analyzed, and extracted from the Subio Platform (v1.24) and plotted in R. Red dots (upregulated genes), blue dots (downregulated genes) and black dots (insignificant genes). Select DEGs are labeled. (C) GO term phagocytosis and positive regulation of phagocytosis in DEGs and upregulated genes with (FC > 1.5) and P-value < 0.05. (D) Pathway enrichment analysis on DEGs was performed in Enrichr (Ma’ayan laboratory) on upregulated genes with (FC > 3) and the Molecular Signatures Database (MSigDB) Hallmark 2020 output data were plotted. (E) DEGs in groups EK/WT, M1/WT, and M2/WT were co-analyzed to assess the inflammatory profile of Rac2+/E62K BMDMs.
Fig. 7.
Fig. 7.
Rac2+/E62K enhances whole cell phagocytosis of cancer cells by CAR macrophages. (A) Schematic of the experiment in (BF). Rac2+/+ and Rac2+/E62K BMDMs were infected with lentivirus encoding membrane-tethered GFP (GFP-CAAX) or a CAR that recognizes the B cell surface antigen CD19 and signals through the Fc Receptor intracellular signaling domain. (BE) To distinguish between trogocytosis or whole cell phagocytosis, control GFP-CAAX (B and C) or CAR-GFP (D and E) BMDMs (green) were mixed with mCherry-CAAX-Raji B cell lymphoma cells (magenta) and imaged via spinning disc confocal. Images correspond to Movies S6–S9. (F) Graph indicates the number of whole Raji cells eaten per macrophage in 8 h, normalized to the maximum observed on that day. *,**, and **** indicate P < 0.05, 0.005, and 0.00005 respectively by an ordinary one-way ANOVA followed by Sidak’s multiple comparison test. In graphs, each point represents data from one well and wells collected on the same day share a symbol. The line indicates the mean of each condition. (G) A schematic of the flow cytometry phagocytosis assay in (H and I). (H) Histogram shows representative flow cytometry data of CellTrace Violet signal within macrophage (GFP+) population. (I) Graph depicts the fraction of macrophages that were CellTrace+, normalized to the average of the day. (J) Graph depicts the mean CellTrace Violet intensity of GFP+ macrophages, normalized to the daily average.

References

    1. Ridley A. J., Paterson H. F., Johnston C. L., Diekmann D., Hall A., The small GTP-binding protein rac regulates growth factor-induced membrane ruffling. Cell 70, 401–410 (1992). - PubMed
    1. Boureux A., Vignal E., Faure S., Fort P., Evolution of the Rho family of ras-like GTPases in eukaryotes. Mol. Biol. Evol. 24, 203–216 (2007). - PMC - PubMed
    1. Wang X., He L., Wu Y. I., Hahn K. M., Montell D. J., Light-mediated activation reveals a key role for Rac in collective guidance of cell movement in vivo. Nat. Cell Biol. 12, 591–597 (2010). - PMC - PubMed
    1. Murphy A. M., Montell D. J., Cell type-specific roles for Cdc42, Rac, and RhoL in Drosophila oogenesis. J. Cell Biol. 133, 617–630 (1996). - PMC - PubMed
    1. Ridley A. J., Rho GTPase signalling in cell migration. Curr. Opin. Cell Biol. 36, 103–112 (2015). - PMC - PubMed

Substances