

CoSIA: an R Bioconductor package for CrOss Species Investigation and Analysis
- PMID: 38109675
- PMCID: PMC10749757
- DOI: 10.1093/bioinformatics/btad759
CoSIA: an R Bioconductor package for CrOss Species Investigation and Analysis
Abstract
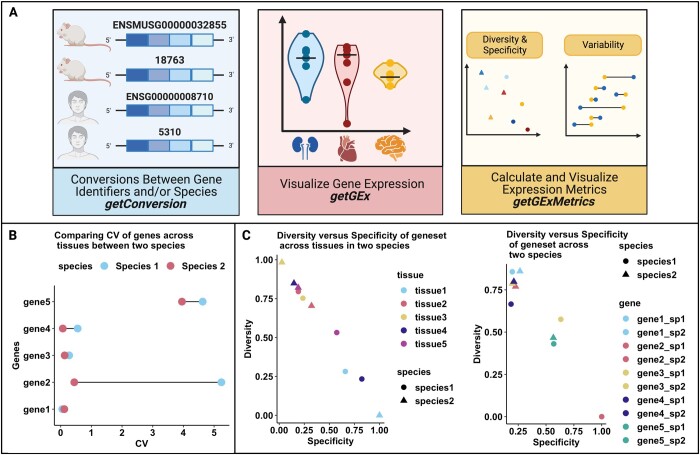
Summary: High-throughput sequencing technologies have enabled cross-species comparative transcriptomic studies; however, there are numerous challenges for these studies due to biological and technical factors. We developed CoSIA (Cross-Species Investigation and Analysis), a Bioconductor R package and Shiny app that provides an alternative framework for cross-species transcriptomic comparison of non-diseased wild-type RNA sequencing gene expression data from Bgee across tissues and species (human, mouse, rat, zebrafish, fly, and nematode) through visualization of variability, diversity, and specificity metrics.
Availability and implementation: https://github.com/lasseignelab/CoSIA.
© The Author(s) 2023. Published by Oxford University Press.
Conflict of interest statement
None declared.
Figures
Update of
-
CoSIA: an R Bioconductor package for CrOss Species Investigation and Analysis.bioRxiv [Preprint]. 2023 Jul 20:2023.04.21.537877. doi: 10.1101/2023.04.21.537877. bioRxiv. 2023. Update in: Bioinformatics. 2023 Dec 1;39(12):btad759. doi: 10.1093/bioinformatics/btad759. PMID: 37163017 Free PMC article. Updated. Preprint.
References
Publication types
MeSH terms
Grants and funding
LinkOut - more resources
Full Text Sources
Molecular Biology Databases
