. 2023 Dec 18;13(1):188.
doi: 10.1038/s41408-023-00962-z.

Targeting S100A9 protein affects mTOR-ER stress signaling and increases venetoclax sensitivity in Acute Myeloid Leukemia

Affiliations

Targeting S100A9 protein affects mTOR-ER stress signaling and increases venetoclax sensitivity in Acute Myeloid Leukemia

Rong Fan et al. Blood Cancer J. .

Abstract

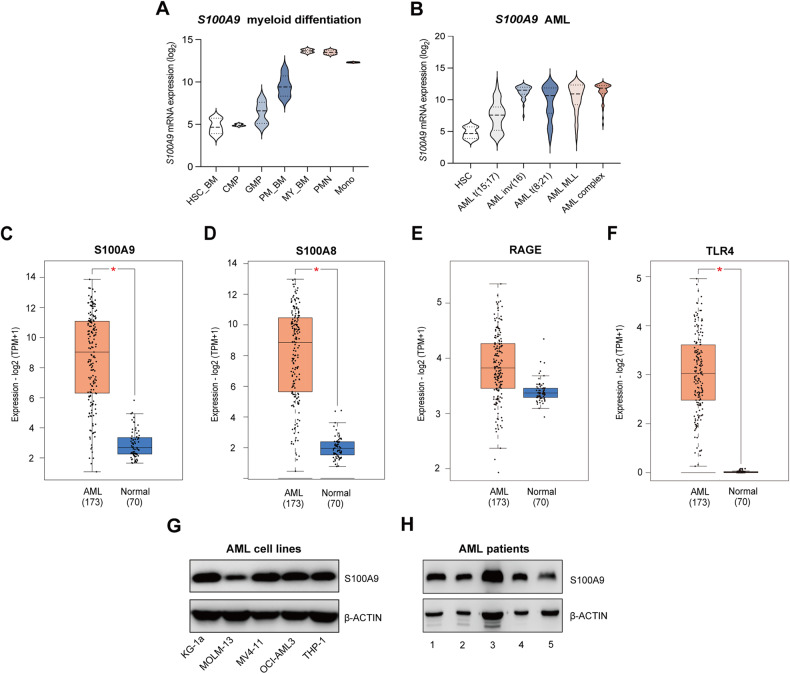
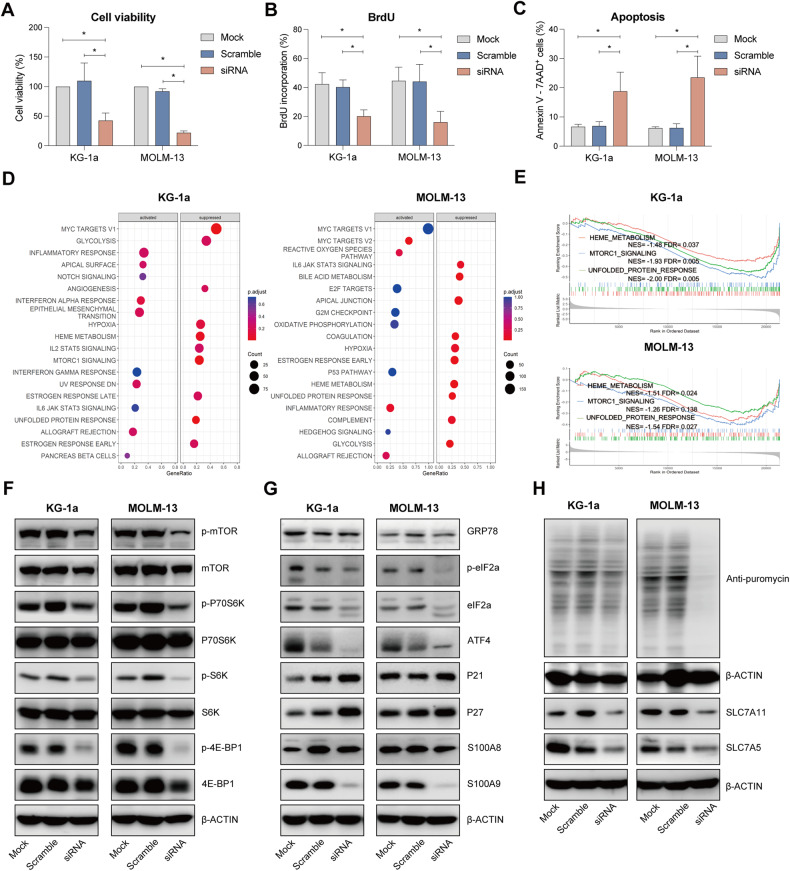
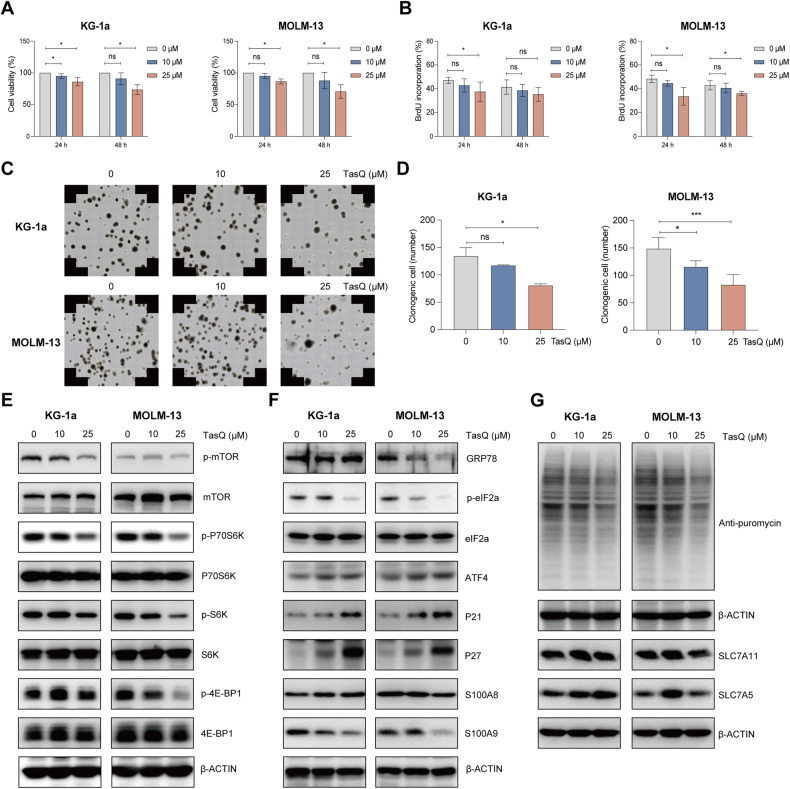
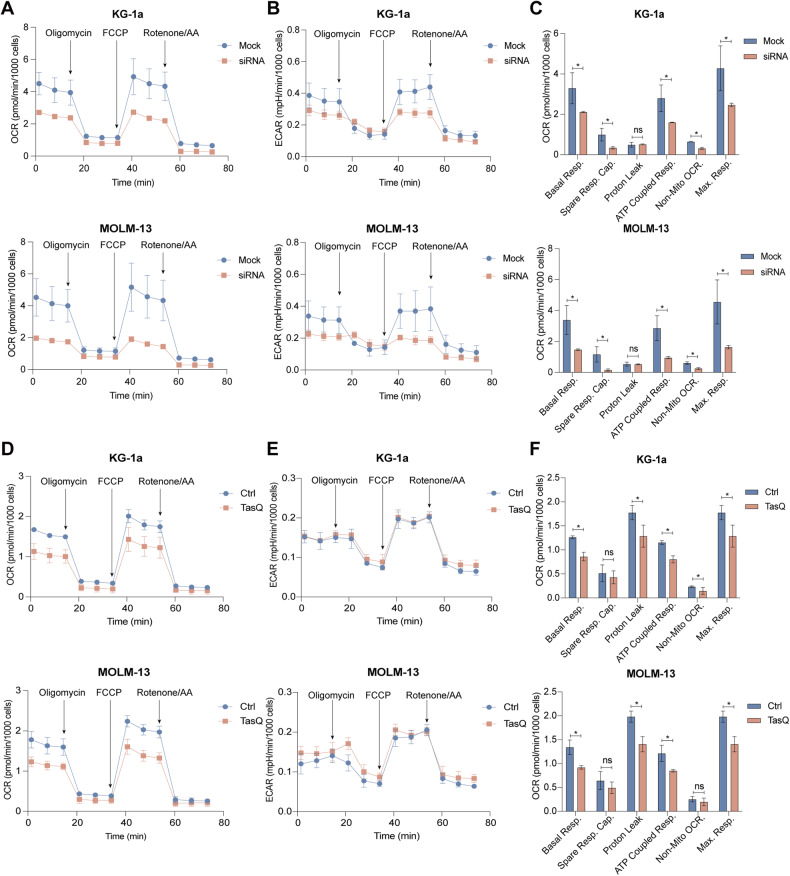
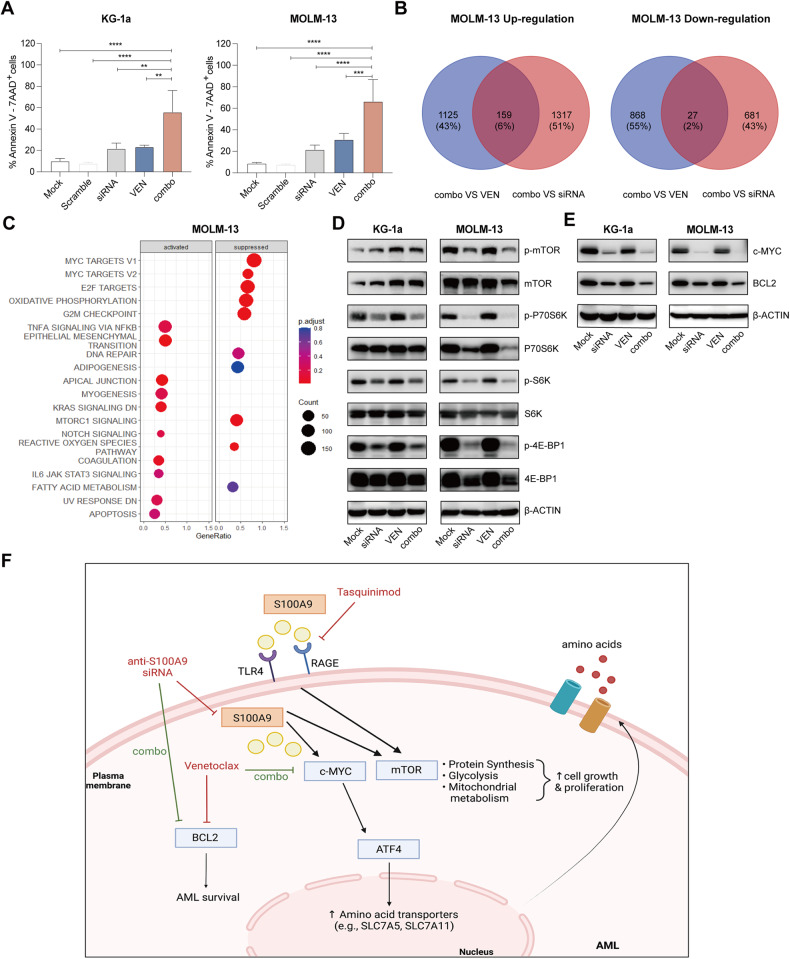
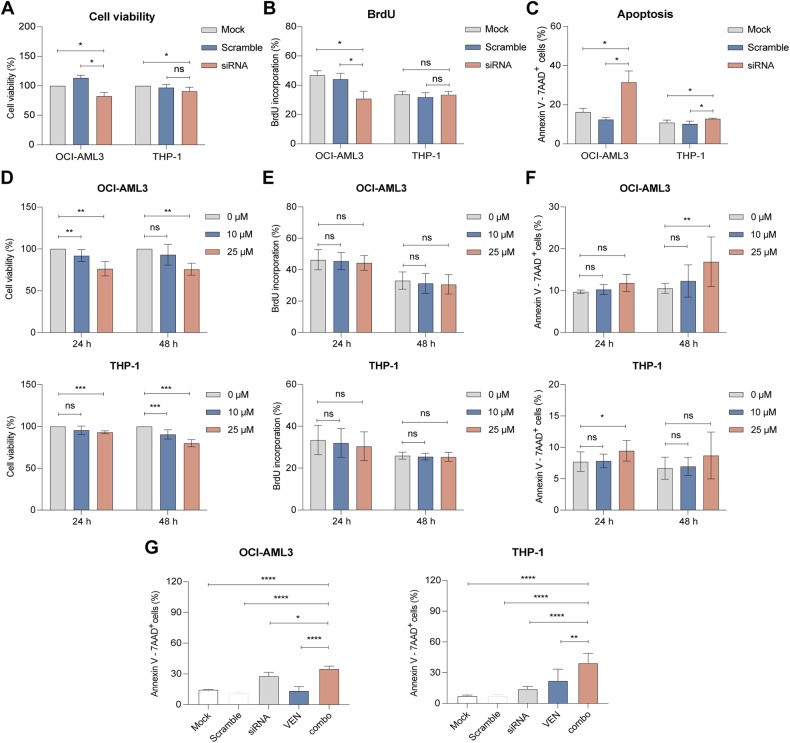
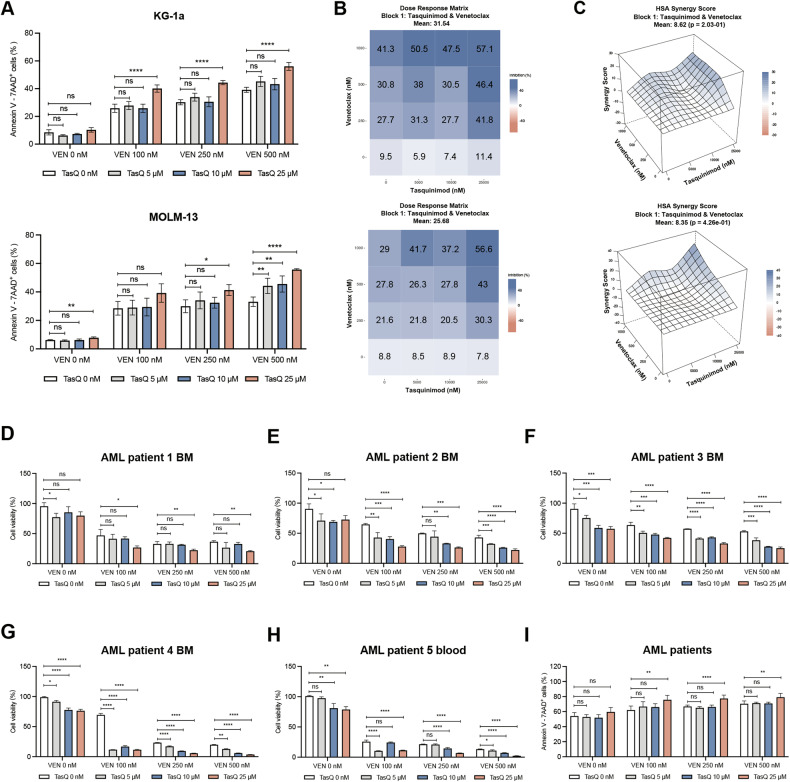
Acute Myeloid Leukemia (AML) is a heterogeneous disease with limited treatment options and a high demand for novel targeted therapies. Since myeloid-related protein S100A9 is abundantly expressed in AML, we aimed to unravel the therapeutic impact and underlying mechanisms of targeting both intracellular and extracellular S100A9 protein in AML cell lines and primary patient samples. S100A9 silencing in AML cell lines resulted in increased apoptosis and reduced AML cell viability and proliferation. These therapeutic effects were associated with a decrease in mTOR and endoplasmic reticulum stress signaling. Comparable results on AML cell proliferation and mTOR signaling could be observed using the clinically available S100A9 inhibitor tasquinimod. Interestingly, while siRNA-mediated targeting of S100A9 affected both extracellular acidification and mitochondrial metabolism, tasquinimod only affected the mitochondrial function of AML cells. Finally, we found that S100A9-targeting approaches could significantly increase venetoclax sensitivity in AML cells, which was associated with a downregulation of BCL-2 and c-MYC in the combination group compared to single agent therapy. This study identifies S100A9 as a novel molecular target to treat AML and supports the therapeutic evaluation of tasquinimod in venetoclax-based regimens for AML patients.


Conflict of interest statement

This study was in part funded by Active Biotech.

Figures

Fig. 1
Fig. 1. S100A9, S100A8, RAGE and TLR4 expression in AML patients and human AML cell lines.
A Violin plots illustrating the expression pattern of S100A9 during differentiation of the major hematopoietic lineages using published dataset (GSE42519). B Violin plot showing the expression pattern of S100A9 in HSC and AML blasts using a merged data set (Bloodpool) from the BloodSpot website. CF Box plot of the expression profile of S100A9, S100A8, RAGE, TLR4 in AML (n = 173) and normal bone marrow samples (n = 70) (GEPIA). *p < 0.05, t-test was used to compare the difference in expression between tumor and normal tissues. G, H The protein level of S100A9 in different human AML cell lines and primary patient samples detected by western blot.
Fig. 2
Fig. 2. Effect of S100A9 silencing using S100A9-siRNA on cell viability, proliferation and apoptosis in human AML cell lines.
KG-1a and MOLM-13 cells were exposed to 20 nM S100A9-siRNA and Lipofectamine 2000. A mock (only lipofectamine) and scramble condition (negative control) were included as controls. A Cell viability was detected by CellTiter-Glo at 72 h (n = 4). B Cell proliferation was investigated using BrdU staining at 72 h (n = 4). C Apoptosis was measured using an AnnexinV 7-AAD staining and flow cytometry at 72 h (n = 3). D RNA sequencing was performed on S100A9-siRNA treated KG-1a and MOLM13 cells at 72 h. The bubble plot shows the top 20 differentially regulated (activated/suppressed) pathways in the S100A9-siRNA group compared with mock (n = 3). E GSEA of the HEME_METABOLISM, MTORC1_SIGNALING and UNFOLD_PROTEIN_RESPONSE gene signature in KG-1a and MOLM-13 cells after treatment with 20 nM S100A9-siRNA for 72 h. GSEA of differentially expressed genes was determined by querying the MSigDB. False discovery rate (FDR) and normalized enrichment scores (NES) are indicated (n = 3). FH KG-1a and MOLM-13 cells were cultured with 20 nM S100A9-siRNA for 72 h. Whole-cell lysates were subjected to Western blot analysis using anti-p-mTOR, mTOR, p-P70S6K, P70S6K, p-S6K, S6K, p-4E-BP1, 4EBP1, GRP78, p-eIF2a, eIF2a, ATF4, p21, p27, S100A9, puromycin, SLC7A11, SLC7A5 and anti-β-Actin antibodies (n ≥ 3). *p < 0.05, **p < 0.01, ***p < 0.001, ****p < 0.0001, One-way ANOVA, Error bars indicate SD.
Fig. 3
Fig. 3. Tasquinimod inhibits AML cell proliferation and reduces colony formation by targeting of mTOR-ER stress signaling in vitro.
A Cell viability of tasquinimod-treated KG-1a and MOLM-13 cell lines (10 and 25 µM) was analyzed using a CellTiter-Glo assay after 24 and 48 h (n = 4). B Cell proliferation of tasquinimod-treated AML cells (10, 25 μM) was investigated using BrdU staining after 24 and 48 h (n = 4). C Methylcellulose colony formation assays were performed for KG-1a and MOLM-13 cell lines treated with vehicle or tasquinimod (10, 25 μM) for 14 days. D Quantification of the colony numbers is shown (n = 4). EG KG-1a and MOLM-13 cells were cultured with tasquinimod at indicated concentrations (10, 25 μM) for 48 h. Whole-cell lysates were subjected to Western blot analysis using anti-p-mTOR, mTOR, p-P70S6K, P70S6K, p-S6K, S6K, p-4E-BP1, 4E-BP1, GRP78, p-eIF2a, eIF2a, ATF4, p21, p27, S100A9, puromycin, SLC7A11, SLC7A5 and anti-β-Actin antibodies (n ≥ 3). *p < 0.05, **p < 0.01, ***p < 0.001, One-way ANOVA, Error bars indicate SD.
Fig. 4
Fig. 4. Seahorse analysis of cellular metabolic fluxes after siRNA-mediated knockdown or tasquinimod treatment in AML cells.
Mitochondrial bioenergetics was analyzed using the Agilent XF Seahorse technology. KG-1a and MOLM-13 cells were treated with 20 nm S100A9-siRNA or tasquinimod (25 μM) for 48 h (n = 3). A OCR assessment of siRNA-transfected KG-1a (up) and MOLM-13 (down) cells. B ECAR assessment of siRNA-transfected KG-1a (up) and MOLM-13 (down) cells. C MitoStress test parameters of siRNA-transfected KG-1a and MOLM-13 cell lines. D OCR assessment of tasquinimod-treated KG-1a (up) and MOLM-13 (down) cells. E ECAR assessment of tasquinimod-treated KG-1a (up) and MOLM-13 (down) cells. F MitoStress test parameters of tasquinimod-treated KG-1a and MOLM-13 cell lines. *p < 0.05, **p < 0.01, ***p < 0.001, Mann–Whitney U-test, Error bars indicate SD.
Fig. 5
Fig. 5. Combination of S100A9-siRNA with venetoclax has additive effects on AML cell apoptosis through downregulation of c-MYC and BCL2.
S100A9-siRNA combined with venetoclax induced apoptosis of KG-1a and MOLM-13 cells. A KG-1a and MOLM-13 cells were pre-plated in RPMI medium with 10% fetal bovine serum in the presence or absence of siS100A9 (20 nM) for 48 h and add venetoclax (250 nM) co-culture for 24 h. Annexin-V/7-AAD based flow cytometric assay for determination of apoptotic cells. B Venn’s diagram of protein expression with different intensity between venetoclax vs combo and siRNA vs combo in MOLM-13. C The bubble plot shows the top 20 differentially regulated (activated/suppressed) pathways in combo group compared with siRNA (72 h) (n = 3). D, E KG-1a, MOLM-13 cells were cultured with tasquinimod at indicated concentrations (10, 25 μM) for 48 h. Whole-cell lysates were subjected to Western blot using anti-p-mTOR, mTOR, p-P70S6K, P70S6K, p-S6K, S6K, p-4E-BP1, 4EBP1, BCL2, c-MYC and anti-β-Actin antibodies (n ≥ 3). F Graphical abstract of siS100A9 and tasquinimod mediated effects, created with Biorender.com. *p < 0.05, **p < 0.01, ***p < 0.001, One-way ANOVA, Error bars indicate SD.
Fig. 6
Fig. 6. Anti-leukemic effect of S100A9-siRNA and tasquinimod on cell viability, proliferation and apoptosis in venetoclax-resistant AML cell lines.
Venetoclax-insensitive OCI-AML3 and THP-1 cells were treated with 20 nM (OCI-AML3) or 60 nM (THP-1) S100A9-siRNA and Lipofectamine 2000. A mock (only lipofectamine) and scramble condition (negative control) were included as controls. A Cell viability was measured by CellTiter-Glo at 72 h (n = 4). B Cell proliferation was investigated using BrdU staining at 72 h (n = 4). C Apoptosis was measured using an AnnexinV 7-AAD staining and flow cytometry at 72 h (n = 3). D Cell viability of tasquinimod-treated OCI-AML3 and THP-1 cell lines (10 and 25 µM) was analyzed using a CellTiter-Glo assay after 24 and 48 h (n = 4). E Cell proliferation of tasquinimod-treated AML cells (10, 25 μM) was investigated using BrdU staining after 24 and 48 h (n = 4). F Apoptosis was measured using an AnnexinV 7-AAD staining and flow cytometry after 24 and 48 h (n = 4). G OCI-AML3 and THP-1 cells were pre-plated in RPMI medium with 10% fetal bovine serum in the presence or absence of S100A9-siRNA (20 nM) for 48 h and afterwards venetoclax (250 nM) was added for an additional 24 h. The Annexin-V/7-AAD based flow cytometric was used to determine the % of apoptotic cells. (*p < 0.05, **p < 0.01, ***p < 0.001, ****p < 0.0001, One-way ANOVA, Error bars indicate SD).
Fig. 7
Fig. 7. The effect in combination of TasQ and venetoclax in vitro and in primary AML patient samples.
A KG-1a and MOLM-13 cell lines were pre-treated with tasquinimod (5, 10, 25 μM) for 24 h, combined with venetoclax (100, 250, 500 nM) for 24 h. Cell apoptosis was determined using an Annexin V/7-AAD staining and flow cytometry. B, C The effect of the drug combination (synergism, additive effects or antagonism) was calculated and visualized using SynergyFinder plus software and the HSA (Highest Single Agent) reference model. Blue regions - synergism; white - additive effect; pink - antagonism (n = 4). DH AML patients BMMCs or PBMCs were pre-treated with TasQ (5, 10, 25 μM) for 24 h, combined with venetoclax (10, 20, 50 nM) for 24 h. Cell viability was determined by CellTiter-Glo (n = 3/sample). I Apoptosis was measured using flow cytometry and summarized in one graph for all tested samples (n = 5). *p < 0.05, **p < 0.01, ***p < 0.001, One-way ANOVA, Error bars indicate SD.

References

    1. Shimony S, Stahl M, Stone RM. Acute myeloid leukemia: 2023 update on diagnosis, risk-stratification, and management. Am J Hematol. 2023;98:502–26. doi: 10.1002/ajh.26822. - DOI - PubMed
    1. Chen KTJ, Gilabert-Oriol R, Bally MB, Leung AWY. Recent treatment advances and the role of nanotechnology, combination products, and immunotherapy in changing the therapeutic landscape of acute Myeloid Leukemia. Pharm Res. 2019;36:125. doi: 10.1007/s11095-019-2654-z. - DOI - PMC - PubMed
    1. Daver N, Wei AH, Pollyea DA, Fathi AT, Vyas P, DiNardo CD. New directions for emerging therapies in acute myeloid leukemia: the next chapter. Blood Cancer J. 2020;10:107. doi: 10.1038/s41408-020-00376-1. - DOI - PMC - PubMed
    1. Abuelgasim KA, Albuhayri B, Munshi R, Mugairi AA, Alahmari B, Gmati G, et al. Impact of age and induction therapy on outcome of 180 adult patients with acute myeloid leukemia; retrospective analysis and literature review. Leuk Res Rep. 2020;14:100206. - PMC - PubMed
    1. Yang J, Anholts J, Kolbe U, Stegehuis-Kamp JA, Claas FHJ, Eikmans M. Calcium-Binding Proteins S100A8 and S100A9: investigation of their immune regulatory effect in Myeloid cells. Int J Mol Sci. 2018;19:78650. - PMC - PubMed

Publication types

MeSH terms