. 2023 Dec 18;14(1):8393.
doi: 10.1038/s41467-023-44228-5.

Autophagy of OTUD5 destabilizes GPX4 to confer ferroptosis-dependent kidney injury

Affiliations

Autophagy of OTUD5 destabilizes GPX4 to confer ferroptosis-dependent kidney injury

Li-Kai Chu et al. Nat Commun. .

Abstract

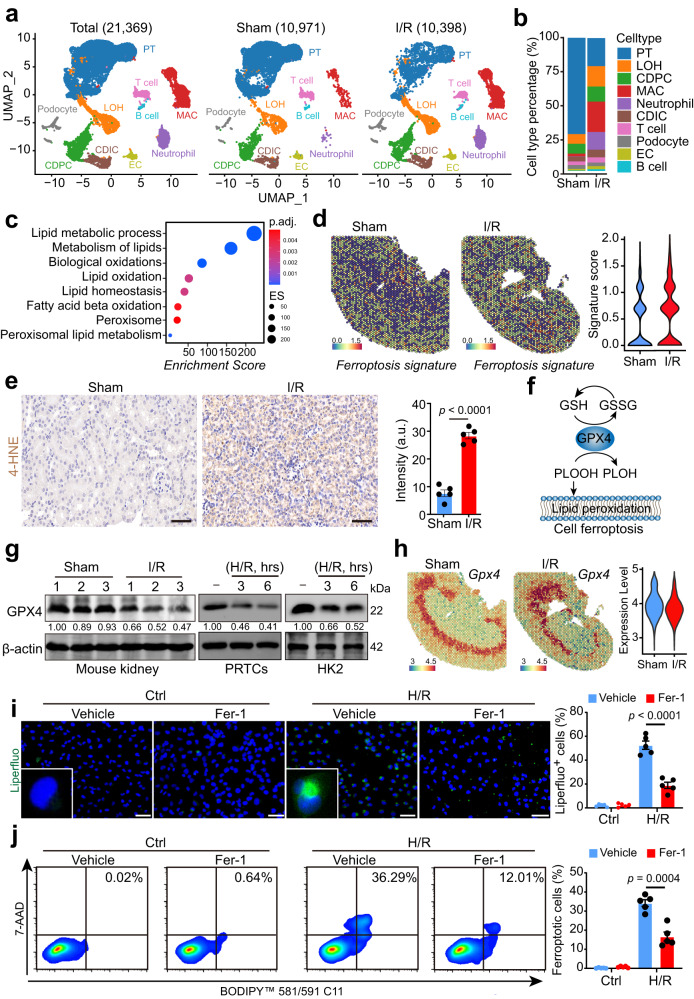
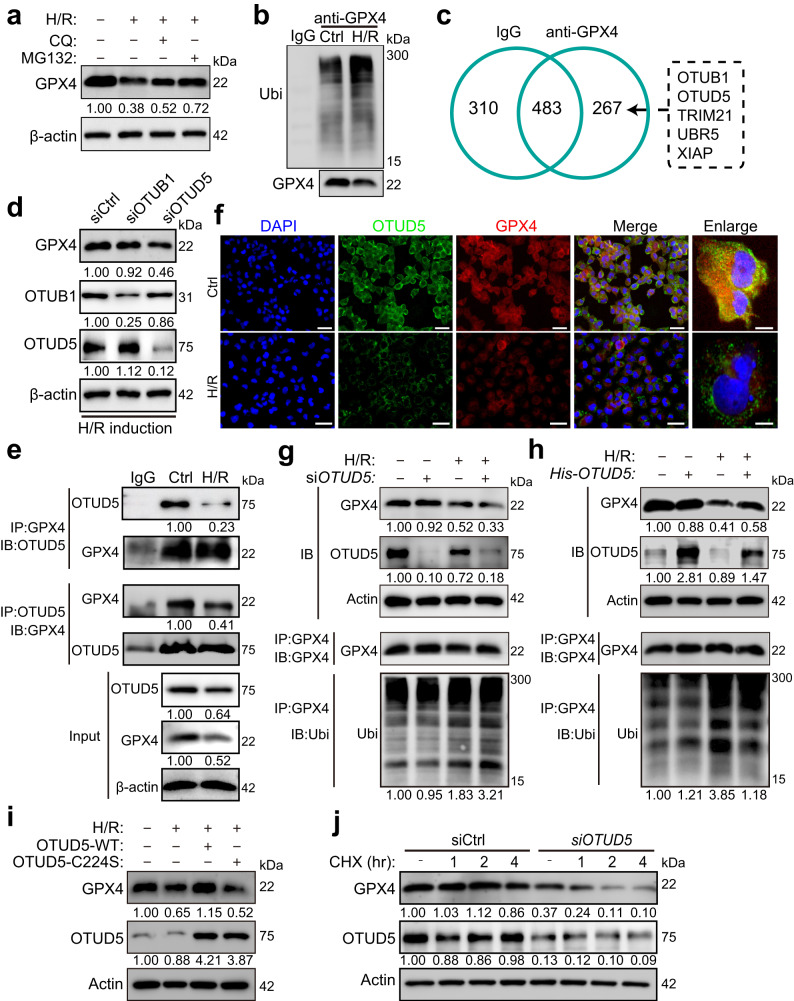
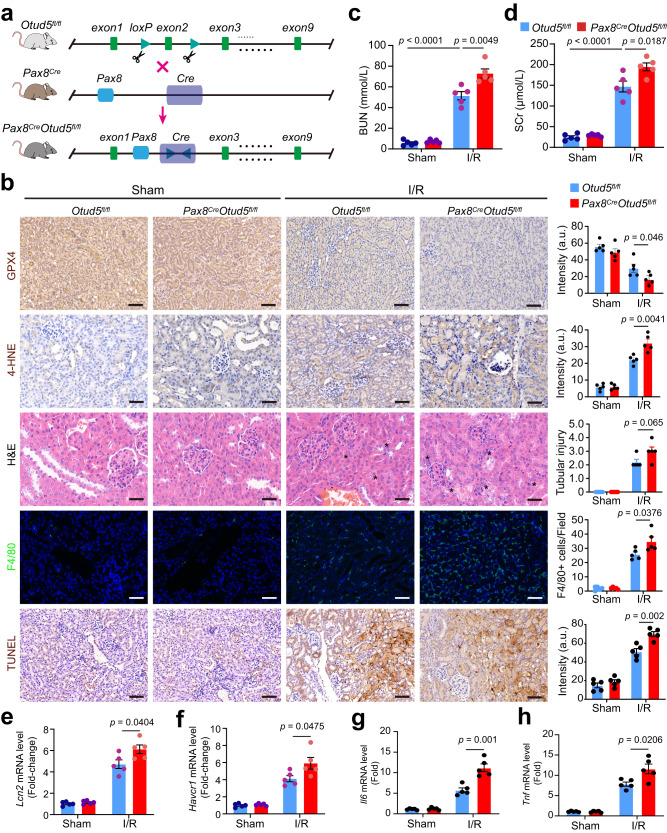
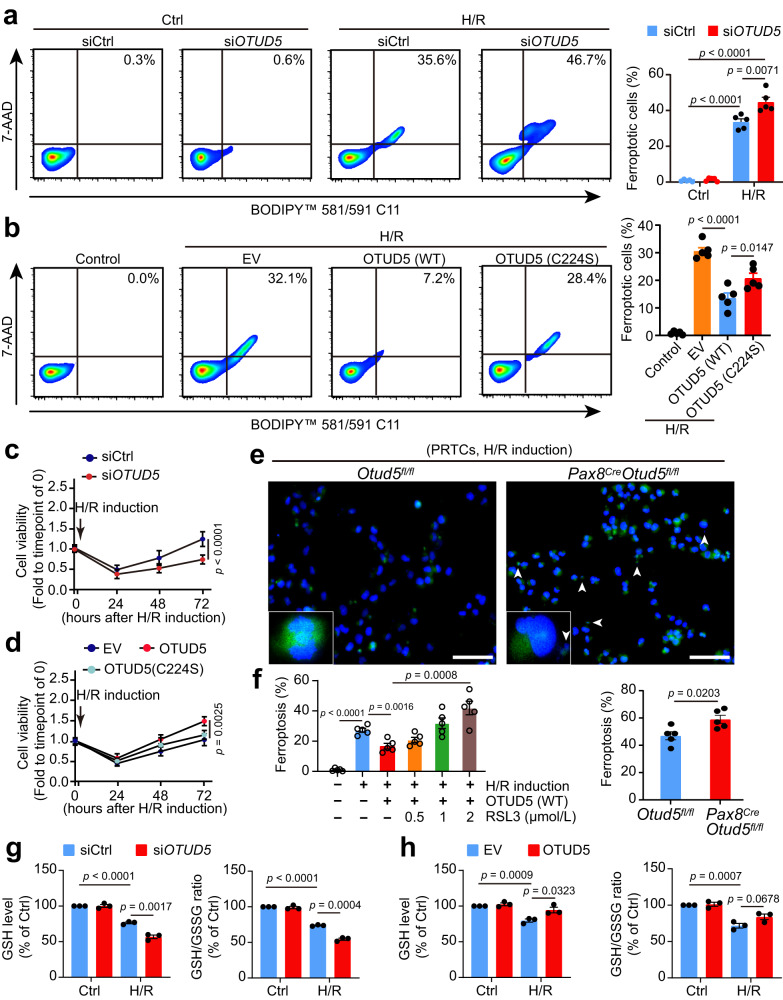
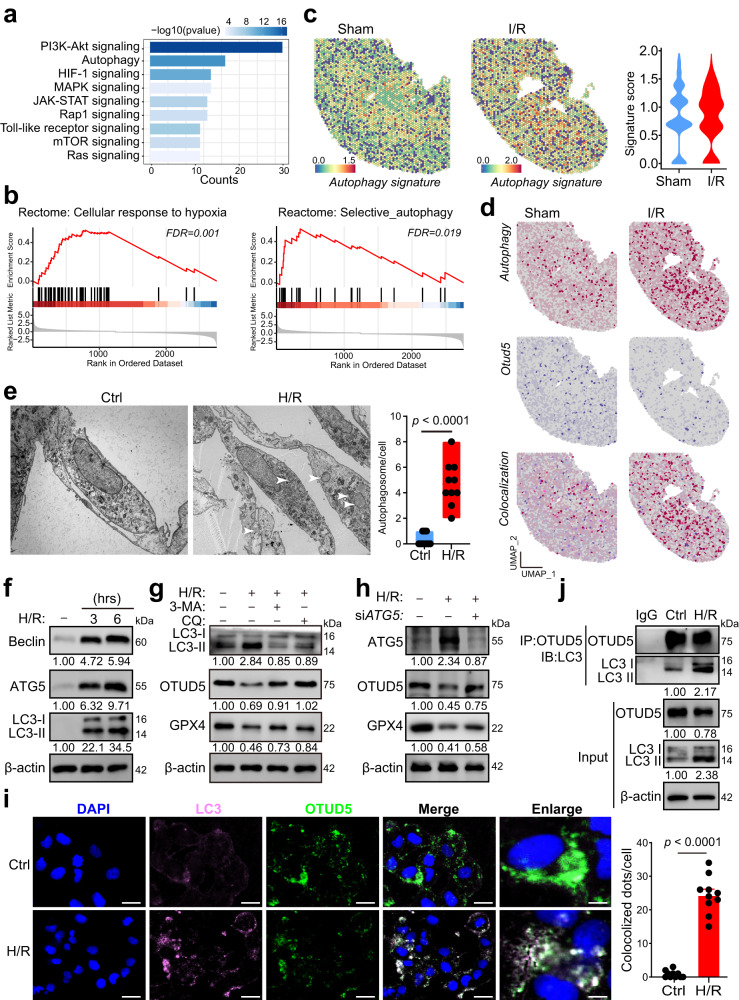
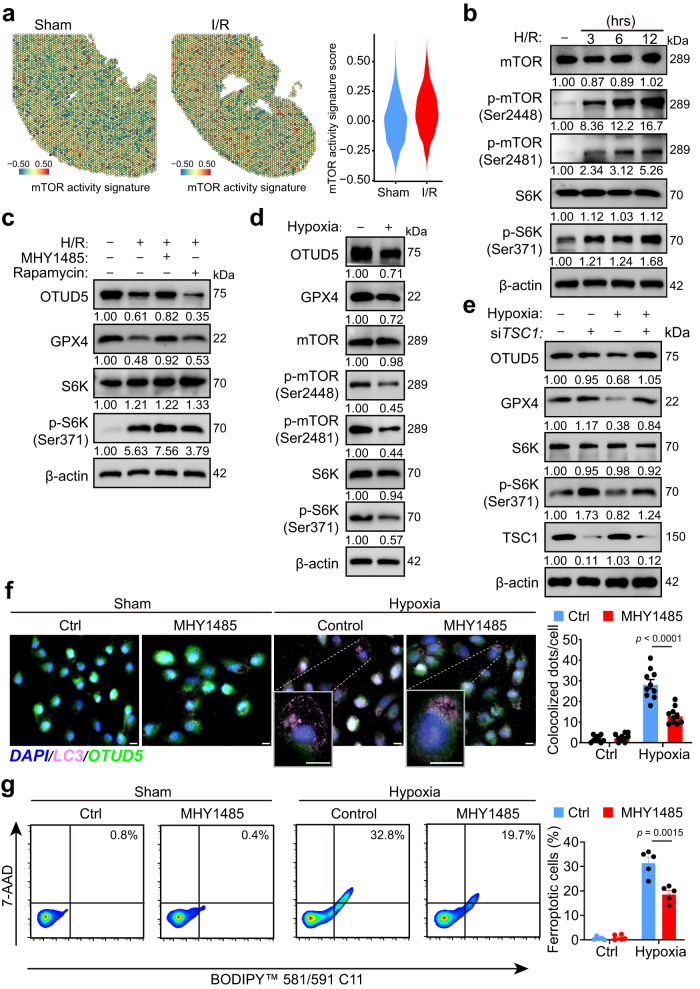
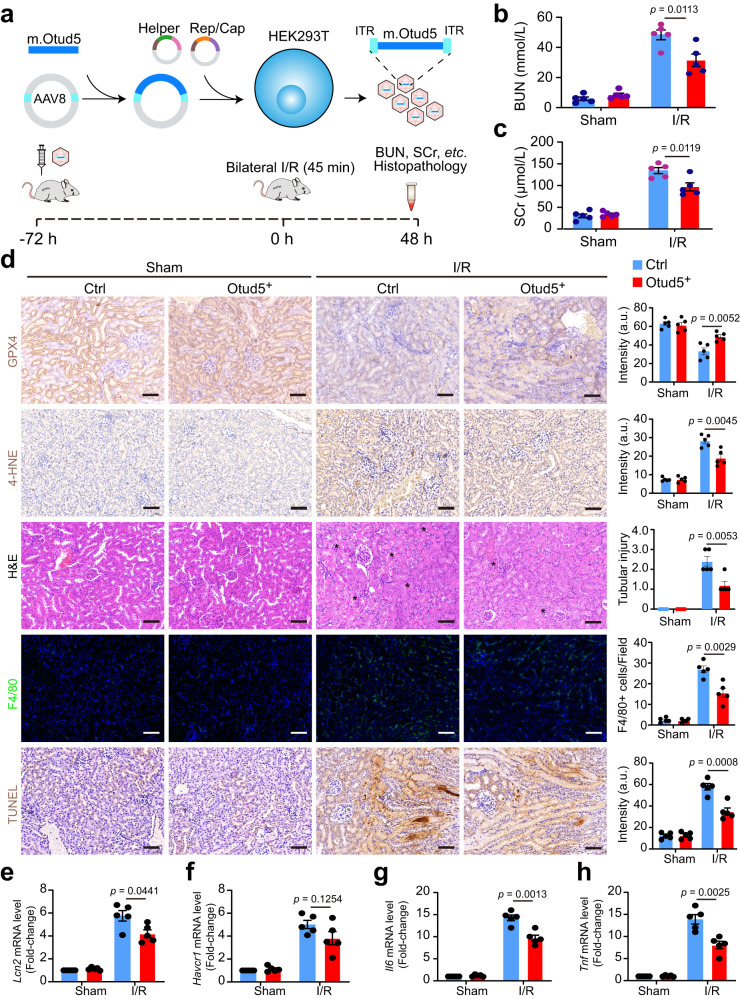
Ferroptosis is an iron-dependent programmed cell death associated with severe kidney diseases, linked to decreased glutathione peroxidase 4 (GPX4). However, the spatial distribution of renal GPX4-mediated ferroptosis and the molecular events causing GPX4 reduction during ischemia-reperfusion (I/R) remain largely unknown. Using spatial transcriptomics, we identify that GPX4 is situated at the interface of the inner cortex and outer medulla, a hyperactive ferroptosis site post-I/R injury. We further discover OTU deubiquitinase 5 (OTUD5) as a GPX4-binding protein that confers ferroptosis resistance by stabilizing GPX4. During I/R, ferroptosis is induced by mTORC1-mediated autophagy, causing OTUD5 degradation and subsequent GPX4 decay. Functionally, OTUD5 deletion intensifies renal tubular cell ferroptosis and exacerbates acute kidney injury, while AAV-mediated OTUD5 delivery mitigates ferroptosis and promotes renal function recovery from I/R injury. Overall, this study highlights a new autophagy-dependent ferroptosis module: hypoxia/ischemia-induced OTUD5 autophagy triggers GPX4 degradation, offering a potential therapeutic avenue for I/R-related kidney diseases.


Conflict of interest statement

The authors declare no competing interests.

Figures

Fig. 1
Fig. 1. Spatial resolution of GPX4-mediated tubular cell ferroptosis in I/R-induced AKI.
Wild-type C57BL/6J mice were subjected to bilateral ischemia/reperfusion (I/R) injury surgery, or a sham operation, and were sacrificed 48 h after the surgery. Injured and normal sham kidneys were harvested for experiments, including single-cell-RNA-sequencing and spatial transcriptomics. a UMAP projection of 10,971 cells from the sham kidney, and 10,398 cells from the injured kidney; cell identity was annotated based on cell type-specific markers (see the “Methods” section). b A bar plot shows the percentage of each cell type out of the total cells in each group. PT proximal tubular, LOH Loop of Henle, CDPC collecting duct principal cell, MAC macrophage, CDIC collecting duct intercalated cell, EC endothelial cell. c A dot plot shows the ferroptosis-associated signaling pathways among the enriched signaling pathways, using GSEA analysis based on the scRNA-seq data of PT cells from I/R-treated and sham kidneys. d Spatial feature plots and violin plots of the ferroptosis signature score in ST spots. e IHC staining and quantification of 4-HNE expression on kidney sections from sham or I/R-treated mice (n = 5); scale bars, 50 μm, a.u.: arbitrary units. f Schematic of GPX4-mediated lipid peroxidation and cell ferroptosis. g Immunoblot and quantification of GPX4 in mouse kidneys (n = 3 per group), primary renal tubular cells (PRTCs), and HK2 cells. h Spatial feature plots and violin plots of Gpx4 in ST spots from sham or I/R-treated mouse kidneys. i Representative images and quantification of cell membrane lipid peroxidation stained by the liperfluo probe (n = 5 independent experiments), scale bars, 50 μm. j Ferroptosis was measured using the fluorescent lipid peroxidation sensor BODIPY™ 581/591 C11 and cell death Dye 7-AAD in HK2 cells treated with or without Fer-1 following H/R induction (n = 5 independent experiments). Data are presented as mean ± s.e.m.; statistical significance was determined using an unpaired two-tailed Student’s t-test.
Fig. 2
Fig. 2. OTUD5 is a GPX4-interacting protein for stabilization in response to I/R.
a PRTCs were induced by H/R in the presence or absence of the proteasome inhibitor MG132, or the lysosome inhibitor chloroquine (CQ) for 3 h. Cells were collected, and the protein levels were analyzed by immunoblotting. b Immunoblot and quantification analysis of GPX4’s ubiquitination in PRTCs upon H/R induction. c The protein lysate of HK2 cells was combined with an anti-human GPX4 antibody or the isotype IgG for immunoprecipitation. The number of GPX4 interacting proteins in the protein complex was identified using LC–MS/MS. d Immunoblot and quantification analysis of GPX4 expression in HK2 cells infected with siOTUB1 or siOTUD5, respectively. e HK2 cells were treated with H/R for 3 h, and the cell lysates were mixed with an anti-human GPX4 or anti-human OTUD5 antibody for immunoprecipitation. The immunoprecipitated protein complex was collected, and protein levels were detected by immunoblotting. f Representative fluorescence images of GPX4 and OTUD5 expression in cells treated with or without H/R for 3 h. Scale bar = 50 or 10 μm. g Immunoblotting and quantification of GPX4 and OTUD5 expression, and GPX4’s ubiquitination in siOTUD5-infected HK2 cells treated with or without H/R for 3 h. h Immunoblotting and quantification of GPX4, OTUD5, and GPX4’s ubiquitination in His-tagged OTUD5 plasmid-infected HK2 cells treated with or without H/R for 3 h. i Immunoblotting and quantification of GPX4 and OTUD5 expression in HK2 cells infected with WT OTUD5 or C224S OTUD5 and subjected to H/R for 3 h. j Immunoblotting and quantification of GPX4 and OTUD5 expression in siOTUD5-infected HK2 cells, which were pretreated with Cycloheximide (CHX) for 1, 2, or 4 h and subjected to H/R for 3 h.
Fig. 3
Fig. 3. Deletion of Otud5 renders kidneys vulnerable to I/R.
a The schematic shows the crossing of Pax8-Cre mice and Otud5-floxed mice to generate renal tubular cell conditional Otud5 knockout (Pax8CreOtud5fl/fl) mice. b 4–6-week-old Pax8CreOtud5fl/fl mice and their WT littermates (n = 5) were subjected to kidney I/R surgery. After 48 h, kidneys were collected and subjected to H&E, IHC staining, immunofluorescence analysis, TUNEL staining and quantification for kidney injury score evaluation, GPX4 and 4-HNE expression, F4/80 expression, and cell death, respectively; Scale bars, 50 μm. The asterisk indicates the injured tubular area. a.u.: arbitrary units. ch Bar plots show the BUN (c), SCr levels (d), and mRNA level of kidney injury markers Lcn (e) and Havcr1 (f) Il6 (g), and Tnf (h) of Pax8CreOtud5fl/fl mice and their WT littermates in response to I/R. All values are presented as mean ± s.e.m., n = 5; p values were calculated by unpaired two-tailed Student’s t-test.
Fig. 4
Fig. 4. OTUD5 protects renal tubular cells from ferroptosis in response to H/R injury.
a Ferroptosis was measured using fluorescent lipid peroxidation sensor BODIPY™ 581/591 C11 and cell death Dye 7AAD in siControl or siOTUD5-transfected cells 3 h after H/R induction (n = 5 independent experiments). b Ferroptosis was measured in empty vector (EV), WT OTUD5, or enzymatically inactive OTUD5 (C224S) plasmid-transfected HK2 cells after H/R induction (n = 5 independent experiments). c Cell viability was measured in siControl or siOTUD5-transfected cells at 24, 48, and 72 h after ex vivo I/R induction (n = 5 independent experiments). d Cell viability was measured in EV, WT OTUD5, or OTUD5-C224S-transfected cells after H/R induction (n = 5 independent experiments). e Representative images and quantification of PRTCs ferroptosis from WT and Pax8CreOtud5fl/fl mouse stained by liperfluo; white arrowheads represent the broken nucleus in ferroptotic cells (n = 5 independent experiments), scale bars: 50 μm. The arrowhead indicates the broken nucleus. f Cell ferroptosis was measured in WT OTUD5-transfected cells, either in the presence or absence of various doses of the GPX4 inhibitor RSL3, under H/R induction (n = 5 independent experiments). g GSH/GSSG ratio and intracellular GSH level were measured in siControl or siOTUD5-transfected cells after H/R induction (n = 3 independent experiments). h GSH/GSSG ratio and intracellular GSH level were measured in EV or WT OTUD5 plasmid-transfected cells after ex vivo I/R induction (n = 3 independent experiments). Data are presented as mean ± s.e.m.; all statistical significance between groups as indicated was determined using an unpaired two-tailed Student’s t-test.
Fig. 5
Fig. 5. Hypoxia activates autophagy degradation of OTUD5.
a PRTCs were treated with H/R for 3 h, followed by RNA isolation and sequencing. A bar plot shows autophagy-associated signaling pathways among the enriched signaling pathways using KEGG analysis. Statistical significance between groups, as indicated, was determined using Fisher’s exact test. b GSEA analysis shows that the Reactome signaling terms: selective autophagy and cellular response to hypoxia were significantly enriched based on the scRNA-seq data of PT cells from I/R-treated kidneys and sham kidneys. c Spatial feature plot and Violin plot of autophagy signature score in ST spots of the two groups. d Feature plot of Otud5 expression, autophagy signature, and their colocalization in ST spots of the two groups. e PRTCs were treated with H/R for 3 h and observed for autophagosome formation using a transmission electron microscope (TEM). The representative TEM images and quantification of autophagosomes (white arrowhead) are displayed (n = 10 independent cells). p values were calculated by unpaired two-tailed Student’s t-test. f PRTCs were treated with H/R for 3 or 6 h, and cells were collected and analyzed by immunoblotting. g PRTCs were treated with H/R for 3 h in the presence or absence of the proteasome inhibitor 3-MA, or the lysosome inhibitor chloroquine (CQ). Cells were collected and analyzed by immunoblotting. h PRTCs were transfected with siControl or siATG5 for 48 h and treated with or without H/R. Cells were collected and analyzed by immunoblotting. i Representative fluorescence images of LC3 and OTUD5 in HK2 cells treated with or without H/R (n = 10 independent cells). Scale bar = 50 or 10 μm. j Cells were treated with H/R for 3 h and collected to analyze the interaction of LC3 and OTUD5 using immunoprecipitation (IP). Data are from three independent experiments and presented as mean ± s.e.m., statistical significance between groups as indicated was determined using an unpaired two-tailed Student’s t-test.
Fig. 6
Fig. 6. H/R reduces OTUD5 through repressing mTORC1 signaling.
a Spatial feature plot and Violin plot of mTOR activity signature score in ST spots of the two groups. b PRTCs were treated by H/R for 3, 6, or 12 h and then collected and analyzed by immunoblotting. c Cells were treated by H/R in the presence of mTOR activator MHY1485 or mTOR inhibitor rapamycin for 3 h and then collected and analyzed by immunoblotting. d HK2 cells were treated with hypoxia condition for 6 h and then collected and analyzed by immunoblotting. e HK2 cells were transfected with siControl or siTSC1 for 48 h and treated with or without hypoxia condition. Cells were collected and analyzed by immunoblotting. f, g HK2 cells were treated with hypoxia conditions in the presence or absence of mTOR activator MHY1485. And cells were collected for ferroptosis detection using flow cytometry. And cells were collected for detecting OTUD5’s autophagy (f, n = 10 independent cells) using IF staining, and cell ferroptosis (g, n = 5 independent experiments) using flow cytometry. The magnification images show the degrading OTUD5 in the lysosome (LC3). Scale bar, 20 μm.; Data are presented as mean ± s.e.m., statistical significance between groups, as indicated, was determined using an unpaired two-tailed Student’s t-test.
Fig. 7
Fig. 7. AAV-mediated OTUD5 therapy protects renal function against I/R injury.
a Schematic shows the generation of AAV-Otud5 virus. b 4–6-week-old C57BL/6J mice were intravenously injected with a single dose of 3 × 1011 copies of Otud5-contained virus. 48 h after injection, mice were subjected to I/R surgery and lived for another 48 h. b, c Levels of BUN and SCr were analyzed in control and Otud5-expressed mice before and 48 h after I/R surgery (n = 5). d Kidneys were collected and subjected to H&E, IHC staining, immunofluorescence analysis, TUNEL staining, and quantification for evaluating kidney injury score, GPX4, and 4-HNE expression, F4/80 expression, and cell death, respectively. Representative images of IHC staining for GPX4 and 4-HNE, H&E, F4/80-positive cells, and TUNEL staining in kidney sections from control and Otud5-expressed mice (n = 5); Scale bars, 50 μm. The asterisk indicates the injured tubular area. a.u.: arbitrary units. e–h The mRNA levels of Lcn2, Havcr1, and Tnf were analyzed in the kidneys of control and Otud5-expressed mice before and 48 h after I/R surgery. Data are mean ± s.e.m., n = 5; statistical significance between groups as indicated was determined using an unpaired two-tailed Student’s t-test.

References

    1. Kellum JA, et al. Acute kidney injury. Nat. Rev. Dis. Prim. 2021;7:52. doi: 10.1038/s41572-021-00284-z. - DOI - PubMed
    1. Hoste EAJ, et al. Global epidemiology and outcomes of acute kidney injury. Nat. Rev. Nephrol. 2018;14:607–625. doi: 10.1038/s41581-018-0052-0. - DOI - PubMed
    1. Wang Y, Bellomo R. Cardiac surgery-associated acute kidney injury: risk factors, pathophysiology and treatment. Nat. Rev. Nephrol. 2017;13:697–711. doi: 10.1038/nrneph.2017.119. - DOI - PubMed
    1. Doyle JF, Forni LG. Acute kidney injury: short-term and long-term effects. Crit. Care. 2016;20:188. doi: 10.1186/s13054-016-1353-y. - DOI - PMC - PubMed
    1. Granger DN, Kvietys PR. Reperfusion injury and reactive oxygen species: the evolution of a concept. Redox Biol. 2015;6:524–551. doi: 10.1016/j.redox.2015.08.020. - DOI - PMC - PubMed

Publication types