. 2023 Dec 18;14(1):8392.
doi: 10.1038/s41467-023-44255-2.

Proteomics-driven noninvasive screening of circulating serum protein panels for the early diagnosis of hepatocellular carcinoma

Affiliations

Proteomics-driven noninvasive screening of circulating serum protein panels for the early diagnosis of hepatocellular carcinoma

Xiaohua Xing et al. Nat Commun. .

Abstract

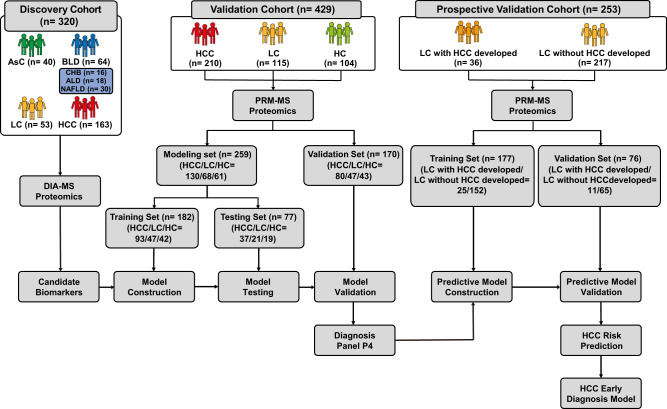
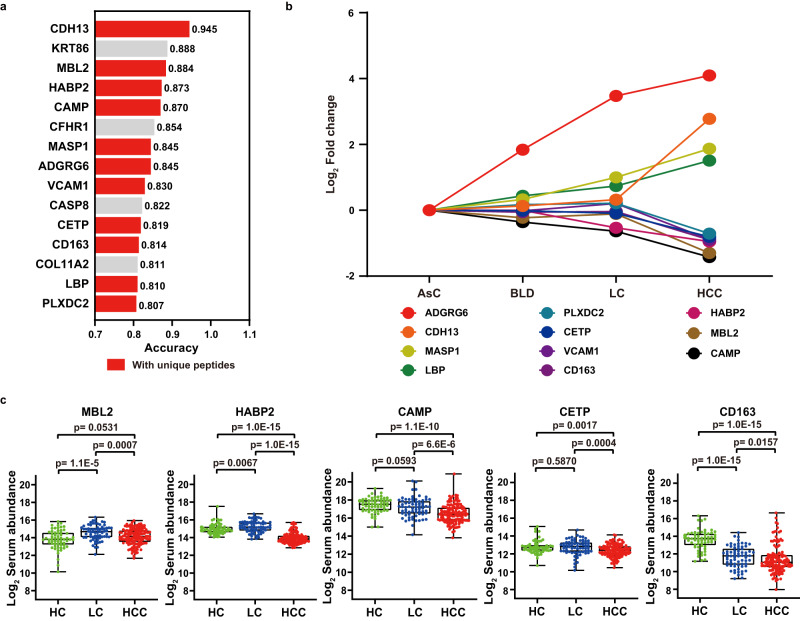
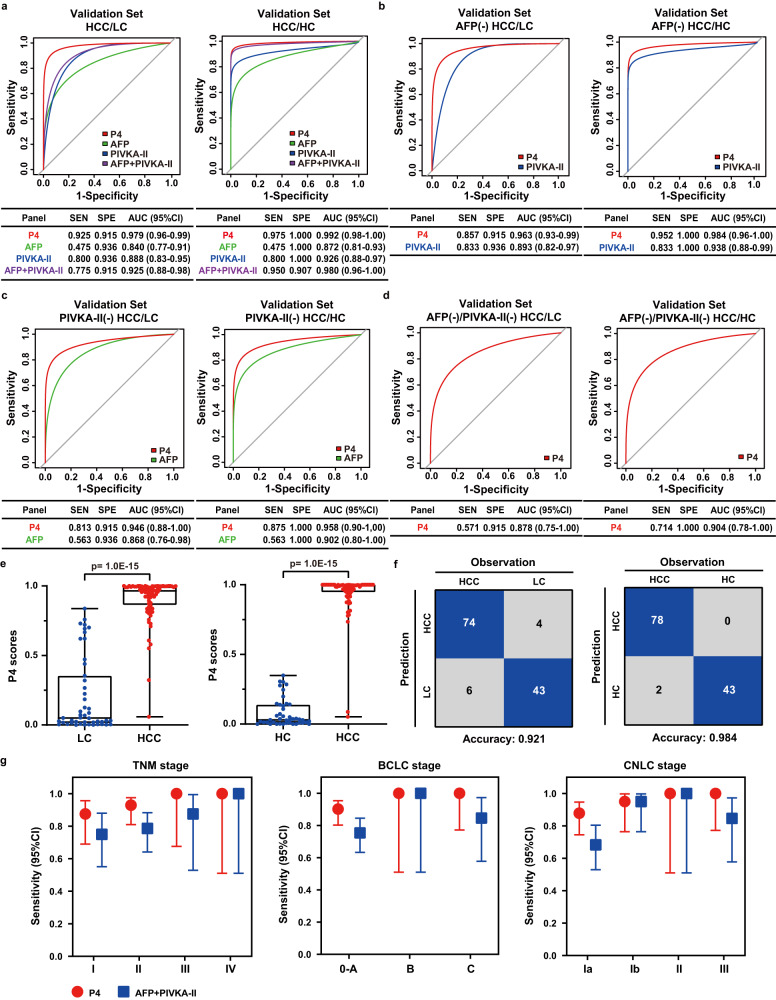
Early diagnosis of hepatocellular carcinoma (HCC) lacks highly sensitive and specific protein biomarkers. Here, we describe a staged mass spectrometry (MS)-based discovery-verification-validation proteomics workflow to explore serum proteomic biomarkers for HCC early diagnosis in 1002 individuals. Machine learning model determined as P4 panel (HABP2, CD163, AFP and PIVKA-II) clearly distinguish HCC from liver cirrhosis (LC, AUC 0.979, sensitivity 0.925, specificity 0.915) and healthy individuals (HC, AUC 0.992, sensitivity 0.975, specificity 1.000) in an independent validation cohort, outperforming existing clinical prediction strategies. Furthermore, the P4 panel can accurately predict LC to HCC conversion (AUC 0.890, sensitivity 0.909, specificity 0.877) with predicting HCC at a median of 11.4 months prior to imaging in prospective external validation cohorts (No.: Keshen 2018_005_02 and NCT03588442). These results suggest that proteomics-driven serum biomarker discovery provides a valuable reference for the liquid biopsy, and has great potential to improve early diagnosis of HCC.


Conflict of interest statement

The authors declare no competing interests.

Figures

Fig. 1
Fig. 1. Overall experimental design for biomarker model development.
Large-scale DIA-based proteomics was used to select HCC-related biomarker candidates, which were then validated in an independent validation cohort using PRM-based targeted proteomic approach. HCC diagnosis models were constructed based on machine learning and the efficacy of the models for HCC risk prediction was assessed through prospective long-term follow-up of LC patients.
Fig. 2
Fig. 2. MS-based serum proteomic analysis of discovery cohort.
a Overview of serum proteomics by DIA-MS. b Comparison of the number of proteins identified in the serum proteome and the spectral library. c Number of proteins identified and quantified with a 1% FDR in four groups (AsC, n = 40 biologically independent samples; BLD, n = 64 biologically independent samples; LC, n = 53 biologically independent samples; HCC, n = 163 biologically independent samples). Data represent mean ± SD. d Proteins identified in the 4 groups were ranked according to their median intensity. The top ten most abundant proteins are labeled, and their relative contribution to the total protein intensity is indicated. Source data are provided as a Source Data file.
Fig. 3
Fig. 3. Quality assessment of MS platform and serum proteomics data.
a The protein number of standards through library process and targeted process including data from DDA mode (n = 50 independent experiments) and DIA mode (n = 32 independent experiments). b Distribution of CVs of standards in DDA-MS (n = 50 independent experiments) and DIA-MS (n = 32 independent experiments). Data represent median, 25% quartile and 75% quartile. c Distribution of CVs of technical replicates of 6 serum samples (HCC, n = 2 independent experiments; LC, n = 2 independent experiments; CHB, n = 2 independent experiments) in the middle and at the end of the project. Data represent median, 25%, and 75% quartile. d Distribution of CVs of serum samples in four groups (AsC, n = 40 biologically independent samples; BLD, n = 64 biologically independent samples; LC, n = 53 biologically independent samples; HCC, n = 163 biologically independent samples). Data represent median, 25%, and 75% quartile. e Correlation analysis of AFP quantification results through DIS-MS strategy and clinical serological assays. Pearson’s correlation coefficients and p value are shown. Significance of linear correlation was determined by one-sided joint hypotheses test. f Distribution of AFP_MS, AFP_clinical and PIVKA-II_clinical abundance in four groups. The quantitation data were Log10 scaled. g Comparison of the consensus rates of AFP_MS negative and positive with AFP_clinical (20 ng/μL) and PIVKA-II_clinical (40 mAU/mL). Threshold of AFP_MS was determined by maximum Youden index. Source data are provided as a Source Data file.
Fig. 4
Fig. 4. Differentially abundant proteins and functional alterations related to HCC.
a Heatmap representation of abundance profile of differentially abundance proteins in four groups. The quantitation data were Log2 scaled. b Clustering analysis of differentially abundant proteins in four groups using Mfuzz method. The individual line colors reflect the correlation between trends of protein abundance in different groups and median trends in clustered subgroups, with colors closer to red indicating a higher positive correlation, and closer to blue indicating a higher negative correlation. c Biological processes (BP), cellular components (CC), molecular functions (MF) and pathways related to the HCC-associated differentially abundant proteins. Top ten terms were shown. Significance of GO items and proteins was determined by hypergeometric test with Benjamini-Hochberg multiple test adjustment. d Protein-protein interaction (PPI) network analysis of differentially abundant proteins. Source data are provided as a Source Data file.
Fig. 5
Fig. 5. Screening and validation of serum candidate biomarkers using PRM-targeted proteomics.
a Ranking of candidate biomarkers in the LVQ model with an accuracy of >0.8 in discriminating HCCs and LCs. The red color showed that the protein has unique peptides and could be used as PRM candidates. b Variation of fold changes of 11 candidate biomarkers for PRM target validation in four groups. c Comparison of PRM quantification of candidate biomarkers in HCC (n = 130), LC (n = 68) and HC (n = 61) groups. The quantitation data were Log2 scaled. Significance was determined by two-sided Wilcoxon test with Benjamini-Hochberg multiple test adjustment. Box plots indicate median (middle line), 25%, 75% percentile (box), and minimum and maximum (whiskers) as well as outliers (single points). Source data are provided as a Source Data file.
Fig. 6
Fig. 6. Diagnosis performance of the P4 model in validation cohort.
a ROC curves of P4 panel, AFP, PIVKA-II, and their combination for HCC patients (n = 80) versus LC patients (n = 47) and HCC patients (n = 80) versus HC (n = 43) in validation cohort. b ROC curves of P4 panel and PIVKA-II for AFP-negative HCC patients (n = 42) versus LC patients (n = 47) and HCC patients (n = 42) versus HC (n = 43) in validation cohort. c ROC curves of P4 panel and AFP for PIVKA-II -negative HCC patients (n = 16) versus LC patients (n = 47) and HCC patients (n = 16) versus HC (n = 43) in validation cohort. d ROC curves of P4 panel for AFP-negative and PIVKA-II-negative HCC patients (n = 7) versus LC patients (n = 47) and HCC patients (n = 7) versus HC (n = 43) in validation cohort. e Differences of P4 scores between HCC patients (n = 80) and LC patients (n = 47), and HCC patients (n = 80) and HC (n = 43). Significance was determined by two-sided Wilcoxon test with Benjamini-Hochberg multiple test adjustment. Box plots indicate median (middle line), 25%, 75% percentile (box) and minimum and maximum (whiskers) as well as outliers (single points). f Confusion matrix showed P4 panel performance for classifying HCC and LC, HCC and HC in the validation set. g Sensitivity with 95% confidence interval (CI) of P4 score and AFP + PIVKA-II in HCC of different clinical stages, such as TNM stages (Stage I, n = 24; Stage II, n = 42; Stage III, n = 8; Stage IV, n = 4), BCLC stages (Stage 0–A, n = 61; Stage B, n = 4; Stage C, n = 13) and CNLC stage (Stage Ia, n = 41; Stage Ib, n = 20; Stage II, n = 4; Stage III, n = 13). Error bars were defined to 95% CI of sensitivity. Source data are provided as a Source Data file.
Fig. 7
Fig. 7. Performance of the P4 model in predicting people at high risk of HCC in prospective validation cohort.
a Performance of the P4 score, serum biomarkers (AFP, PIVKA-II, AFP + PIVKA-II), and early diagnosis score models (ASAP and aMAP score model) for LC patients (n = 76) in prospective validation set to predict LC patients who developed to HCC at subsequent follow up. The upper panel illustrated ROC curves, and the lower panel showed the AUC, sensitivity, and specificity. b Differences of P4 scores between LC patients who developed HCC (n = 11) and LC patients who did not develop HCC (n = 65) in the validation cohort. Significance was determined by Wilcoxon test with Benjamini-Hochberg multiple test adjustment. Box plots indicate median (middle line), 25%, 75% percentile (box) and minimum and maximum (whiskers) as well as outliers (single points). c Confusion matrix showed P4 panel performance for predicting people at high risk of HCC in the validation cohort (n = 76). d The categorization of imaging results, P4 scores, serum biomarkers, ASAP model and aMAP score results of 11 LC patients in the validation cohort who developed HCC during follow-up was shown in each color-code plot. Blue indicated positive, gray indicated negative, while pink indicated no detection. e Time distribution of P4 panel predicted HCC occurrence earlier than imaging results. f The concordance comparison of P4 scores, serum biomarkers and risk scores compared with positive and negative of CT/MRI scan results during HCC occurrence. g The time-course demonstration of imaging results and quantified levels of P4 scores, serum biomarkers and risk scores during the clinical course of 11 patients who developed HCC. The corresponding cutoffs were indicated by dashed lines. Source data are provided as a Source Data file.

References

    1. Llovet JM, et al. Hepatocellular carcinoma. Nat. Rev. Dis. Prim. 2021;7:6. doi: 10.1038/s41572-020-00240-3. - DOI - PubMed
    1. General Office of National Health Commission Standard for diagnosis and treatment of primary liver cancer (2022 edition) J. Clin. Hepatol. 2022;38:288–303. doi: 10.3969/j.issn.1001-5256.2022.02.009. - DOI
    1. European Association for the Study of the Liver. Electronic address: easloffice@easloffice.eu; European Association for the Study of the Liver EASL clinical practice guidelines: management of hepatocellular carcinoma. J. Hepatol. 2018;69:182–236. doi: 10.1016/j.jhep.2018.03.019. - DOI - PubMed
    1. Patel M, et al. Hepatocellular carcinoma: diagnostics and screening. J. Eval. Clin. Pract. 2012;18:335–342. doi: 10.1111/j.1365-2753.2010.01599.x. - DOI - PubMed
    1. Tsukamoto M, et al. Clinical significance of half-lives of tumor markers alpha-fetoprotein and des-gamma-carboxy prothrombin after hepatectomy for hepatocellular carcinoma. Hepatol. Res. 2018;48:E183–E193. doi: 10.1111/hepr.12942. - DOI - PubMed

Publication types

Associated data