. 2023 Dec 18;14(1):8411.
doi: 10.1038/s41467-023-44087-0.

Personalized functional brain network topography is associated with individual differences in youth cognition

Affiliations

Personalized functional brain network topography is associated with individual differences in youth cognition

Arielle S Keller et al. Nat Commun. .

Abstract

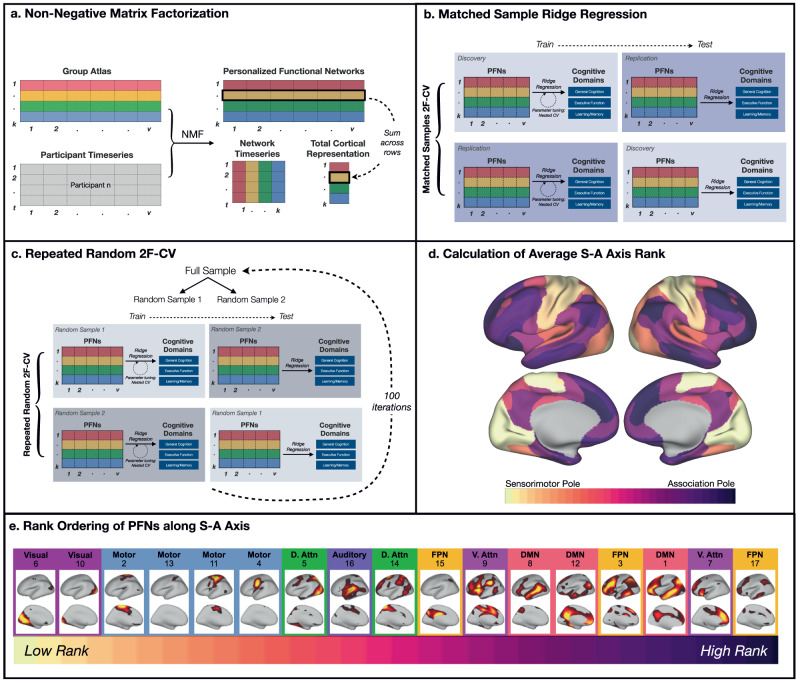
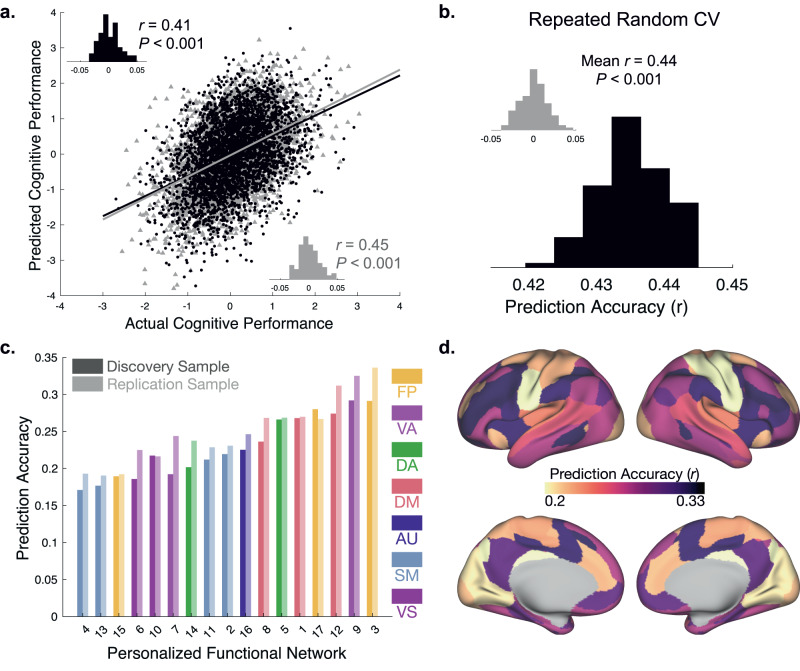
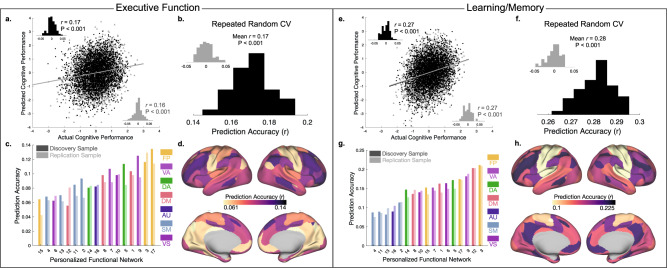
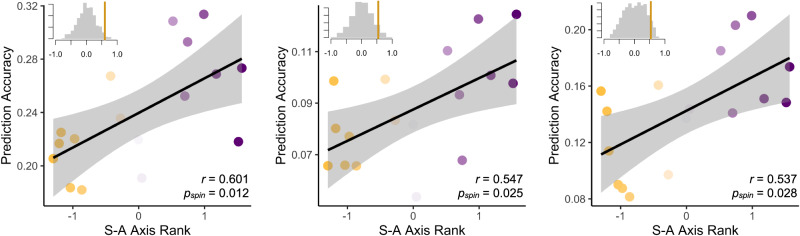
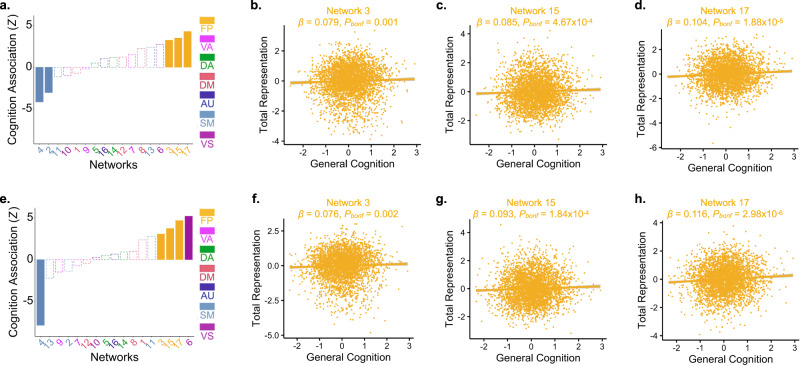
Individual differences in cognition during childhood are associated with important social, physical, and mental health outcomes in adolescence and adulthood. Given that cortical surface arealization during development reflects the brain's functional prioritization, quantifying variation in the topography of functional brain networks across the developing cortex may provide insight regarding individual differences in cognition. We test this idea by defining personalized functional networks (PFNs) that account for interindividual heterogeneity in functional brain network topography in 9-10 year olds from the Adolescent Brain Cognitive Development℠ Study. Across matched discovery (n = 3525) and replication (n = 3447) samples, the total cortical representation of fronto-parietal PFNs positively correlates with general cognition. Cross-validated ridge regressions trained on PFN topography predict cognition in unseen data across domains, with prediction accuracy increasing along the cortex's sensorimotor-association organizational axis. These results establish that functional network topography heterogeneity is associated with individual differences in cognition before the critical transition into adolescence.


Conflict of interest statement

R.B. reports owning stock in Taliaz Health and serving on the scientific boards of Taliaz Health and Zynerba Pharmaceuticals outside the submitted work. Dr. Shinohara has consulting income from Genentech/Roche and Octave Bioscience. All other authors report no competing interests.

Figures

Fig. 1
Fig. 1. Identification and analysis of Personalized Functional Networks (PFNs).
a Using a previously-defined group atlas as a prior, we generated personalized functional networks (PFNs) by applying non-negative matrix factorization (NMF) to each individual participant’s vertex by time matrix. This procedure allows each network in the consensus group atlas to have a varying cortical representation in each individual, thereby capturing individual differences in the size and layout of networks while simultaneously allowing for interpretable between-individual comparisons. We also calculated the total cortical representation of each PFN by summing each network’s loadings across all vertices. b To evaluate whether an individual’s multivariate pattern of PFN topography could accurately predict cognition in unseen data, we trained linear ridge regression models using the cortical representation of each PFN while controlling for age, sex, site, and head motion. Leveraging our matched discovery and replication samples for two-fold cross-validation (2F-CV), we first trained models in the discovery sample using nested cross-validation for parameter tuning, and then tested these models in the held-out replication sample. We then performed nested training in the replication sample and testing in the held-out discovery sample. c To demonstrate that our results were not dependent on the matched discovery and replication sample split, we conducted repeated random cross-validation over one hundred iterations, each time performing a random split of our full sample and applying two-fold cross-validation. d Next, we calculated the average sensorimotor-association (S-A) axis rank across the vertices contained within each PFN. e We then rank-ordered each PFN according to its average S-A rank. Brain maps depict vertex loadings for each PFN (D. Attn Dorsal Attention, V. Attn Ventral Attention, DMN Default Mode Network, FPN Fronto-Parietal Network).
Fig. 2
Fig. 2. Functional topography of association networks predicts individual differences in general cognition in unseen data.
a Association between actual and predicted cognitive performance using two-fold cross-validation (2F-CV) with nested cross-validation for parameter tuning across both the discovery (black scatterplot; r(3525) = 0.41, p = 3.050 × 10-146) and replication (gray scatterplot; r(3447) = 0.45, p = 3.850 × 10-174) samples. Inset histograms represent the distributions of prediction accuracies from a permutation test. b Repeated random 2F-CV (100 runs) provided evidence of stable prediction accuracy across splits of the data, which was far better than a null distribution with permuted data (inset). Two-sided t-test reveals that repeated random 2F-CV prediction accuracies are significantly greater than the null distribution of prediction accuracies with permuted data (t(100) = 261.274, p = 2.595 × 10-253). c Prediction accuracy is shown for seventeen models trained on each PFN independently for the discovery sample (dark bars) and replication sample (light bars), with the highest prediction accuracies found in the ventral attention and fronto-parietal control networks. Note that all p-values associated with prediction accuracies are significant after Bonferroni correction for multiple comparisons. (FP Fronto-Parietal, VA Ventral Attention, DA Dorsal Attention, DM Default Mode, AU Auditory, SM Somatomotor, VS Visual). d Functional topography within association networks yield the most accurate predictions of general cognition. Prediction accuracy across the full sample shown for seventeen cross-validated models trained on each PFN independently.
Fig. 3
Fig. 3. Functional topography of association networks predicts individual differences in multiple cognitive domains in unseen data.
Results of ridge regression models predicting individual differences in executive function (ad) and learning/memory (eh). Panels a/e: Association between actual and predicted executive function (a) or learning/memory (e) using two-fold cross-validation (2F-CV) across both the discovery (black scatterplot) and replication (gray scatterplot) samples. Inset histograms represent the distributions of prediction accuracies from a permutation test. Repeated random 2F-CV (100 runs) provided evidence of stable prediction accuracy across many splits of the data for both executive function (b) and learning/memory (f), which was far better than a null distribution with permuted data (inset). The PFNs with the highest prediction accuracies for executive function (c, d) and learning/memory (g, h) were found in association cortex and were maximal in the ventral attention and fronto-parietal control networks. Prediction accuracy is shown for seventeen models trained on each PFN independently for the discovery sample (dark bars) and replication sample (light bars) in (c, g). Note that all p-values associated with prediction accuracies are significant after Bonferroni correction for multiple comparisons. (FP Fronto-Parietal, VA Ventral Attention, DA Dorsal Attention, DM Default Mode, AU Auditory, SM Somatomotor, VS Visual).
Fig. 4
Fig. 4. Prediction accuracy of functional topography varies systematically along the S-A axis.
The sensorimotor-association (S-A) axis represents a hierarchy of cortical organization. The prediction accuracies of models trained on each PFN independently are significantly associated with the rank of each PFN along the S-A axis as shown by statistically significant Spearman correlations (two-sided) for the 17 networks across all three cognitive domains: general cognition (left), executive function (middle), and learning/memory (right). Shaded gray error bands represent 95% confidence intervals. Note: average S-A axis ranks for each PFN are z-scored for visualization purposes. Inset histograms depict the distribution of Spearman correlations between rank and prediction accuracy for 1000 spin-based permutations of the S-A axis, with the vertical line showing the true Spearman correlation value.
Fig. 5
Fig. 5. Total cortical representations of fronto-parietal PFNs are positively associated with cognition.
Ordering the seventeen PFNs by the strength of their signed association with general cognition, we found significant positive associations between general cognition and the total cortical representation of all three fronto-parietal PFNs and negative correlations with a somatomotor network in both the discovery (ad) and replication (eh) samples (PBonf < 0.05; dashed lines indicate networks with effects that were not statistically significant). Scatterplots depict the relationship between general cognition and the total cortical representation of fronto-parietal networks 3, 15, and 17. (FP Fronto-Parietal, VA Ventral Attention, DA Dorsal Attention, DM Default Mode, AU Auditory, SM Somatomotor, VS Visual).

References

    1. Cortés Pascual A, Moyano Muñoz N, Quílez Robres A. The relationship between executive functions and academic performance in primary education: review and meta-analysis. Front. Psychol. 2019;10:1582. doi: 10.3389/fpsyg.2019.01582. - DOI - PMC - PubMed
    1. Klassen AF, Miller A, Fine S. Health-related quality of life in children and adolescents who have a diagnosis of attention-deficit/hyperactivity disorder. Pediatrics. 2004;114:e541–e547. doi: 10.1542/peds.2004-0844. - DOI - PubMed
    1. Agha G, et al. Cognition level and change in cognition during adolescence are associated with cognition in midlife. Ann. Epidemiol. 2019;35:48–52.e2. doi: 10.1016/j.annepidem.2019.03.004. - DOI - PMC - PubMed
    1. Richards M, Shipley B, Fuhrer R, Wadsworth MEJ. Cognitive ability in childhood and cognitive decline in mid-life: Longitudinal birth cohort study. Br. Med. J. 2004;328:552–554. doi: 10.1136/bmj.37972.513819.EE. - DOI - PMC - PubMed
    1. Moffitt TE, et al. A gradient of childhood self-control predicts health, wealth, and public safety. Proc. Natl. Acad. Sci. USA. 2011;108:2693–2698. doi: 10.1073/pnas.1010076108. - DOI - PMC - PubMed

Publication types

Grants and funding