. 2023 Dec 18;9(1):166.
doi: 10.1038/s41531-023-00616-8.

Impaired neuron differentiation in GBA-associated Parkinson's disease is linked to cell cycle defects in organoids

Affiliations

Impaired neuron differentiation in GBA-associated Parkinson's disease is linked to cell cycle defects in organoids

Isabel Rosety et al. NPJ Parkinsons Dis. .

Abstract

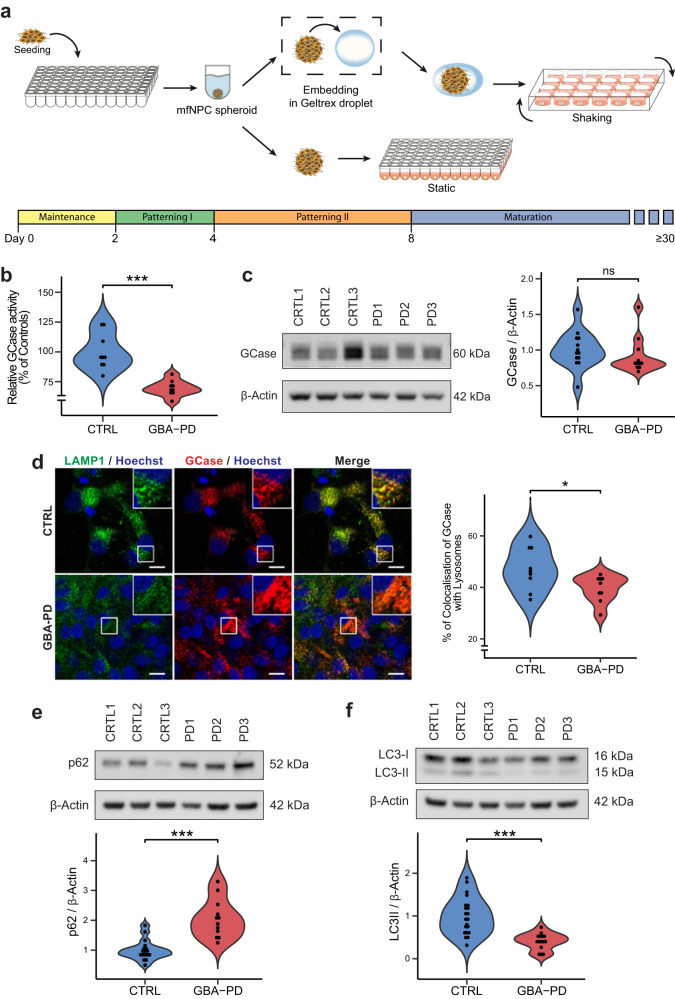
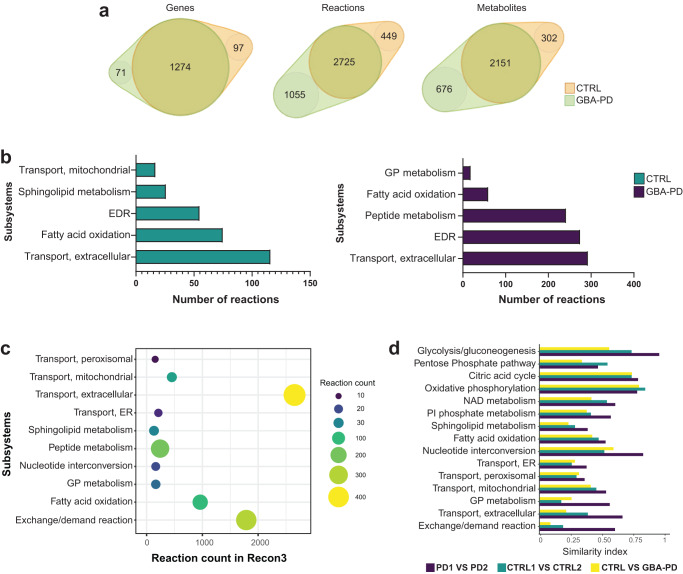
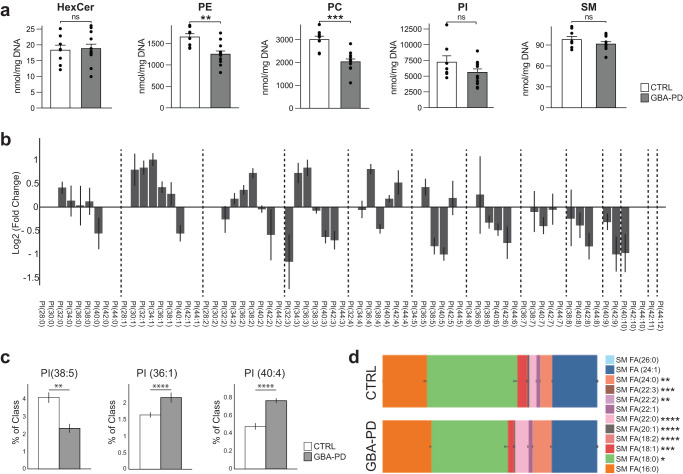
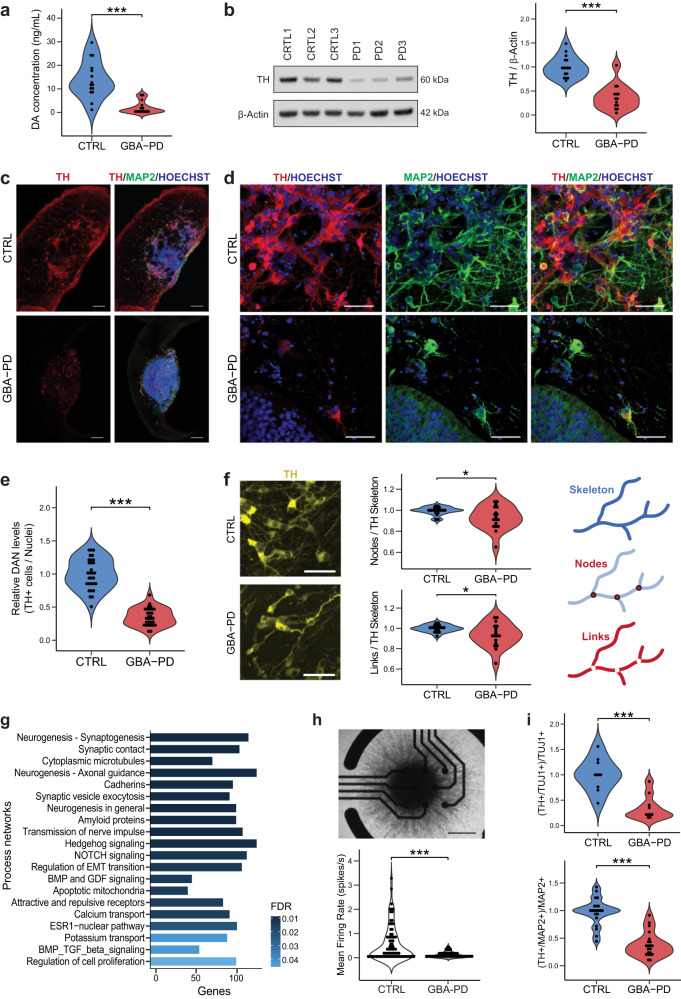
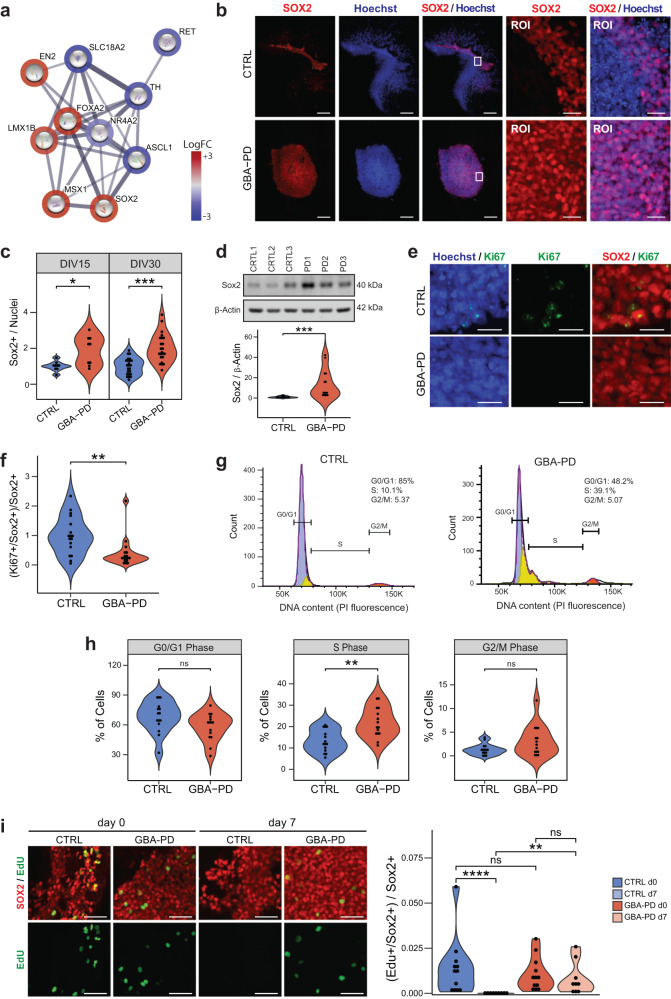
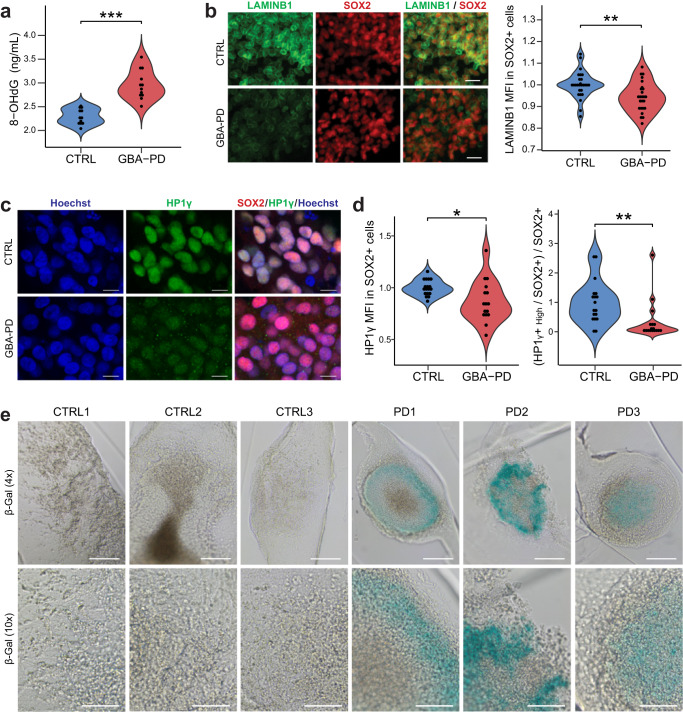
The mechanisms underlying Parkinson's disease (PD) etiology are only partially understood despite intensive research conducted in the field. Recent evidence suggests that early neurodevelopmental defects might play a role in cellular susceptibility to neurodegeneration. To study the early developmental contribution of GBA mutations in PD we used patient-derived iPSCs carrying a heterozygous N370S mutation in the GBA gene. Patient-specific midbrain organoids displayed GBA-PD relevant phenotypes such as reduction of GCase activity, autophagy impairment, and mitochondrial dysfunction. Genome-scale metabolic (GEM) modeling predicted changes in lipid metabolism which were validated with lipidomics analysis, showing significant differences in the lipidome of GBA-PD. In addition, patient-specific midbrain organoids exhibited a decrease in the number and complexity of dopaminergic neurons. This was accompanied by an increase in the neural progenitor population showing signs of oxidative stress-induced damage and premature cellular senescence. These results provide insights into how GBA mutations may lead to neurodevelopmental defects thereby predisposing to PD pathology.


Conflict of interest statement

The authors J.J., S.B. and J.C.S. declare no competing non-financial interests but declare competing financial interests as cofounders and shareholders of OrganoTherapeutics société à responsabilité limitée (SARL). The remaining authors declare no competing interests.

Figures

Fig. 1
Fig. 1. Generation and characterization GBA-PD midbrain organoids.
a Schematic overview of the protocol used for the generation of midbrain organoids. mfNPCs, floorplate neural precursors. b GCase enzyme activity in differentiated MO cultures was significantly decreased (40% reduction) when compared with controls. The data represent a summary of three independent differentiation experiments per line each analyzed in triplicate at DIV30. Values are normalized to the average of controls per experiment. Wilcoxon T-test; ***p < 0.001. c GCase protein levels are not altered at DIV30. Representative western blot analysis and respective quantification. The data represent a summary of at least three independent differentiation experiments per line each analyzed in triplicate. Values are normalized to the average of controls per experiment. d Decreased percentage of colocalization of GCase with lysosomes in GBA-PD organoids at DIV30. GCase (red), LAMP1 (green). Representative confocal images with their respective zoomed region of interest (ROI) and their quantification (scale bar, 10 μm). The data represent a summary of three independent differentiation experiments for all cell lines, normalized to the average of controls per experiment. Wilcoxon T-test; *p < 0.05. e, f Representative western blot and quantification of expression of the autophagy markers p62 and LC3 at DIV30. Data represents a summary of at least five independent differentiation experiments. Values are normalized to the average of controls per experiment. Wilcoxon T-test; ***p < 0.001.
Fig. 2
Fig. 2. Metabolic modeling of GBA-PD.
a Venn diagram representation of the structural model analysis. b Comparison of model composition by reactions. Reactions found exclusively in control models (green) or in GBA-PD (purple) were mapped to the Recon 3 subsystems, and the top five most different subsystems based on the reaction number are listed for each condition. EDR = exchange/demand reaction, GP = glycerophospholipid. c The top 10 most different subsystems between control (CTRL1 and CTRL2) and GBA-PD (PD1 and PD2) models after pooling the exclusive reactions of the two conditions. The size and color of the dot represent the number of reactions per subsystem. The location in relation to the x-axis represents the size of the subsystem in the generic Recon3. Subsystems are positioned on the y-axis in alphabetical order. GP = glycerophospholipid, ER = endoplasmic reticulum. d Similarity index of flux variability analysis optimizing for ATP demand for subsystems of interest. SI between CTRL1 vs CTRL2 and SI between PD1 and PD2 models were compared, as well as the SI between the CTRL (CTRL1 and CTRL2) and GBA-PD (PD1 and PD2). SI of 0 represents a complete mismatch in flux variability between the models, whereas a SI of 1 represents the highest similarity in flux variability. PI = Phosphatidylinositol, ER = endoplasmic reticulum, GP = glycerophospholipid.
Fig. 3
Fig. 3. Lipidomics analysis showing differences in lipid classes and lipid species composition.
a Differences in phosphatidylethanolamine (PE) and phosphatidylcholine (PC) levels but not hexosylceramides (HexCer), sphingomyelins (SM) or phosphatidylinositol (PI) in HILIC LC-MS/MS based lipidomic analysis of DIV30 organoids. Data represent a summary of four independent organoid differentiations, Mann–Whitney U test. **p < 0.01, ****p < 0.0001. Error bars represent standard error of the mean. b Pairwise comparison between GBA-PD vs control of phosphatidylinositol (PI) lipid species denoted by their sum notation. Data expressed as the Log2 of the fold change. Error bars represent standard error of the mean. c Plots for PI molecular species PI (38:5), PI (36:1), PI (40:4), each plot corresponds to the most enriched species for that sum notation: (18:1/20:4), PI (18:0/18:1), and PI (18:0/22:4), respectively. Data represent a summary of four independent organoid differentiations and is expressed as the percentage of the entire PI class. p-values were calculated using a one-way ANOVA test. FDR adjusted p-values were calculated using the Benjamini–Hochberg procedure. **p < 0.01, ****p < 0.0001. Error bars represent standard error of the mean. d Fatty acid composition of the lipid species within the sphingomyelin lipid class. Data represent a summary of four independent organoid differentiations expressed as relative quantification, where each species is normalized to the total amount of lipid of its class. p-values were calculated using a one-way ANOVA test. FDR adjusted p-values were calculated using the Benjamini–Hochberg procedure. *p < 0.05, **p < 0.01, ***p < 0.001, ****p < 0.0001. Error bars represent standard error of the mean.
Fig. 4
Fig. 4. Impaired dopaminergic and general neuronal differentiation in GBA-PD patient-specific midbrain organoids.
a Levels of extracellular dopamine in culture media at DIV60 were lower for GBA-PD organoids when compared with controls, measured by ELISA. The data represent a summary of five independent differentiation experiments for all cell lines. Wilcoxon T-test; ***p < 0.001. b Quantification of TH protein levels and representative western blot at DIV60 showing decreased levels of the protein in heterozygous GBA-N370S organoids. Data represents a summary of five independent differentiation experiments normalized to the mean of the controls per batch. Wilcoxon T-test; ***p < 0.001. c Representative images of DIV30 midbrain organoids sections stained for TH (red), MAP2 (green), nuclei (blue) (scale bar, 200 μm). d Immunofluorescence images of sections from Fig. 3c acquired at 40× (scale bar, 50 μm). e High-content automated image analysis of immunofluorescence stainings of dopaminergic neurons in organoids at DIV30 expressed as the proportion of cells expressing TH normalized by total nuclei. Data represents a summary of six independent differentiation experiments normalized to the mean of the controls per batch. Wilcoxon T-test; ***p < 0.001. f Neurite branching is less complex in dopaminergic neurons from GBA-PD organoids at DIV30 when compared with controls, measured by the number of nodes (branching points) and links (branches) extracted from the skeletonization of TH mask by the algorithm used for image analysis. Representative immunofluorescence images of TH+ neurons (yellow) showing less complex arborization in GBA-PD condition (scale bar, 50 μm) and graphic illustration of the morphometric features; links, nodes and skeleton. Data is normalized to the mean of the controls per experiment. n = 6, Wilcoxon T-test; *p < 0.05. g GeneGO MetaCoreTM enrichment analysis by process networks showing the top 20 overrepresented processes in DIV30 organoids. h Mean firing rate detected by individual electrodes of a multi-electrode array (MEA) system at DIV15 showing that mutant organoids are less electrophysiologically active. The data represent a summary of four independent differentiation experiments for all cell lines. Values are normalized to the mean of the controls per experiment. Wilcoxon T-test; ***p < 0.001. Upper panel shows a representative image of a midbrain organoid positioned on an 8-electrode array in a 96-well tissue culture plate (scale bar, 500 μm). i Decreased levels of TH+ cells normalized to the total neuronal population at DIV15 using the early neuronal marker TUJ1 and DIV30 using the late neuronal marker MAP2.
Fig. 5
Fig. 5. Increased levels of SOX2 and cell cycle arrest in GBA-PD organoids.
a DEGs involved in dopaminergic differentiation (PathCards) depicted via protein–protein associations obtained from the STRING database. The border of the nodes represents the log fold-change (logFC) of the gene expression in the comparison of control GBA-PD organoids vs controls. Edges depict protein–protein associations. b Representative immunofluorescence staining of SOX2 (red) in midbrain organoid sections at DIV15 (CTRL1 and PD1), along with an amplified region of interest (ROI) of the original. Nuclei stained with Hoechst 33342 (blue), scale bar is 200 μm and 25 μm, respectively. c Quantitative analyses of SOX+ population shows increased proportion of cells expressing the neural stem cell marker in GBA-PD MOs at DIV15 and DIV30. Each data point represents the average of technical replicates for each independent differentiation. Values are normalized to the mean of the controls per experiment. Wilcoxon T-test; *p < 0.05, **p < 0.01, n = 3. d Validation of the immunofluorescence results by immunoblotting against SOX2 in whole cell lysates obtained from organoids at DIV15. The data represent a summary of four independent differentiations. Values are normalized to the mean of the controls per experiment. Wilcoxon T-test; ***p < 0.001. e Representative images CTRL2 and PD2 expressing SOX2 (red) and Ki67(green) at DIV15. Nuclei stained with Hoechst 33342 (blue) (scale bar, 20 μm). f Decreased proportion of proliferative neural stem cells in mutant MOs (DIV30) compared to controls, represented by cells expressing both SOX2 and Ki67. Values are normalized to the mean of the controls per experiment. Wilcoxon T-test; *p < 0.05. g, h Propidium iodide (PI) fluorescence profiles of CTRL3 and PD3 with cell cycle distribution (Watson pragmatic model) (G). Percentage of cells in each cycle phase analyzed by flow cytometry using propidium iodide showing accumulation of cells in the S-phase at DIV30 in GBA-PD organoids. The experiment was repeated five times using organoids from five independent differentiations. Wilcoxon T-test; *p < 0.05. i Representative images (left) of EdU staining (green) for evaluation of the proliferation of SOX+ neural precursors (red) at the day of the exposure (day 0) and 7 days after the initial exposure to EdU (day 7). Images correspond to organoids at DIV30 of CTRL1 and PD1 cell lines (scale bar, 50 μm). Respective quantification (right) of the proportion of neural precursors with a positive signal for EdU showing a significant loss of the EdU staining in CTRL organoids at day 7 after EdU exposure. Data represents a summary of at least three independent differentiation experiments. Kruskal–Wallis with post hoc Dunn tests; **p < 0.01, ****p < 0.0001.
Fig. 6
Fig. 6. DNA oxidative damage and signs of senescence in GBA-PD organoids.
a Extracellular concentration of 8-OHdG in DIV30 organoids measured by ELISA. The data represent a summary of four independent differentiation experiments for all cell lines. Wilcoxon T-test; ***p < 0.001. b High content automated image analysis showed decreased MFI of LAMINB1 (green) within Sox+ population (red). Data is a summary of eight independent differentiation experiments, normalized to the average of controls per organoid batch. Wilcoxon T-test; **p < 0.01 (scale bar, 20 μm). c, d Representative images of HP1γ (green) and SOX2 (red) in CTRL2 and PD2 organoid sections acquired at 60× (C) (scale bar, 10 μm). Quantification of MFI of HP1γ within the SOX2+ population (D left) and proportion of neural precursor cells (SOX2+) expressing high levels of HP1γ (D right) in DIV30 organoid sections acquired at 20× using the automated image analysis pipeline. Data represents a summary of five independent differentiation experiments normalized to the mean of the controls per batch. Wilcoxon T-test; *p < 0.05, **p < 0.01. e Senescence-associated β-galactosidase staining (blue) of DIV30 organoids (scale bar, 200 μm, 4×; 100 μm, 10×).

Similar articles

Cited by

References

    1. Sidransky E, et al. Multicenter analysis of glucocerebrosidase mutations in Parkinson’s disease. N. Engl. J. Med. 2009;361:1651–1661. doi: 10.1056/NEJMoa0901281. - DOI - PMC - PubMed
    1. Boer DEC, van Smeden J, Bouwstra JA, Aerts J. Glucocerebrosidase: functions in and beyond the lysosome. J. Clin. Med. 2020;9:736. doi: 10.3390/jcm9030736. - DOI - PMC - PubMed
    1. Sun A. Lysosomal storage disease overview. Ann. Transl. Med. 2018;6:476. doi: 10.21037/atm.2018.11.39. - DOI - PMC - PubMed
    1. Sidransky E, Lopez G. The link between the GBA gene and parkinsonism. Lancet Neurol. 2012;11:986–998. doi: 10.1016/S1474-4422(12)70190-4. - DOI - PMC - PubMed
    1. Schwamborn JC. Is Parkinson’s disease a neurodevelopmental disorder and will brain organoids help us to understand it? Stem Cells Dev. 2018;27:968–975. doi: 10.1089/scd.2017.0289. - DOI - PubMed