. 2023 Dec 18;14(1):8410.
doi: 10.1038/s41467-023-44177-z.

Dissecting the genetic landscape of GPCR signaling through phenotypic profiling in C. elegans

Affiliations

Dissecting the genetic landscape of GPCR signaling through phenotypic profiling in C. elegans

Longjun Pu et al. Nat Commun. .

Abstract

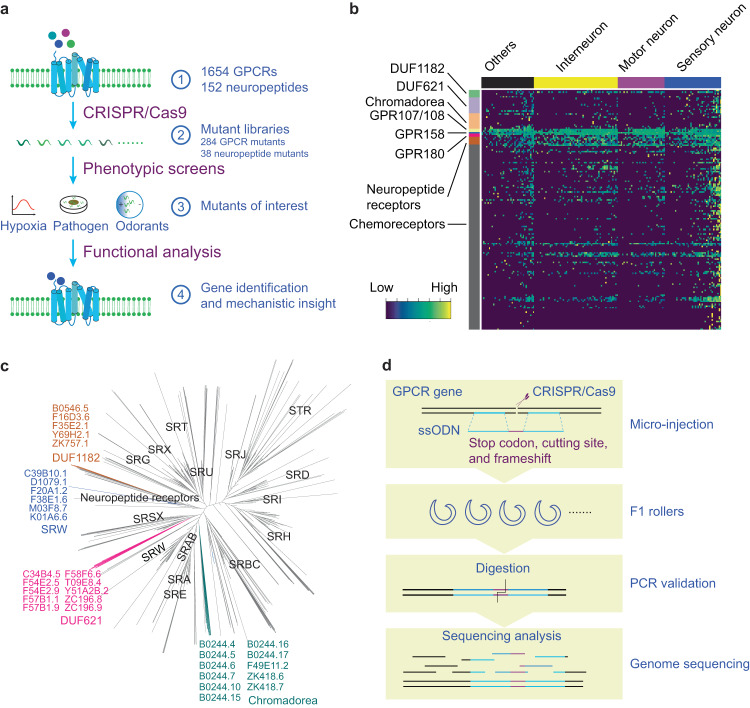
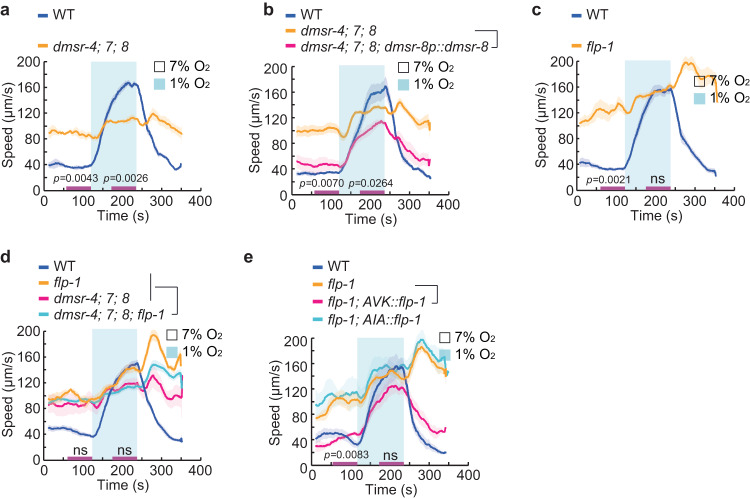
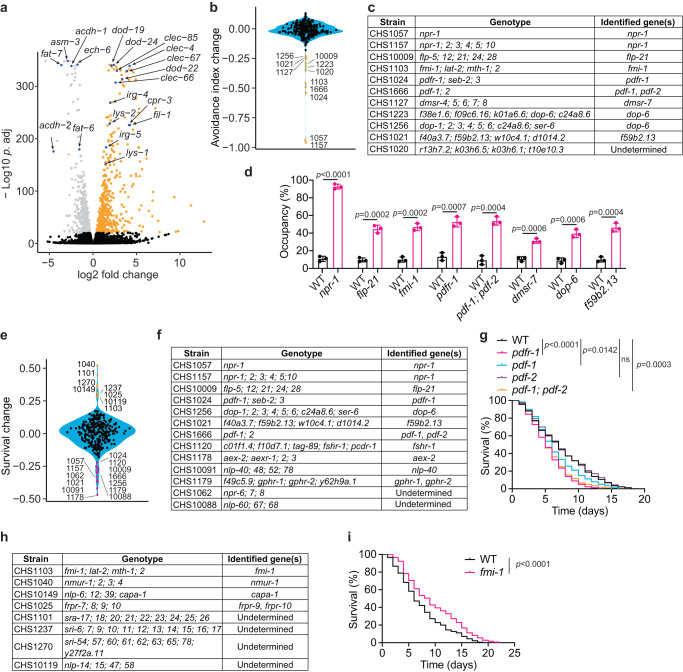
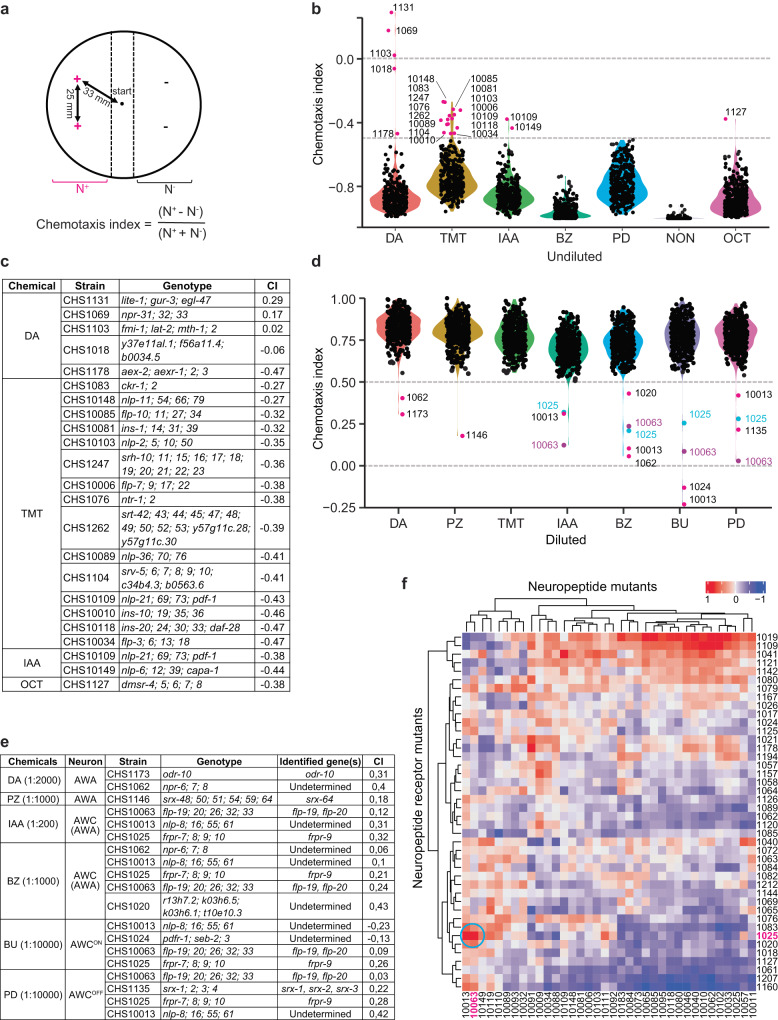
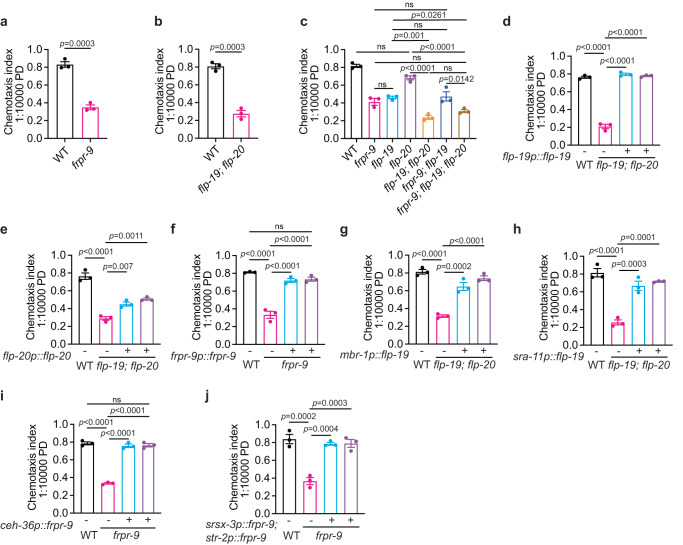
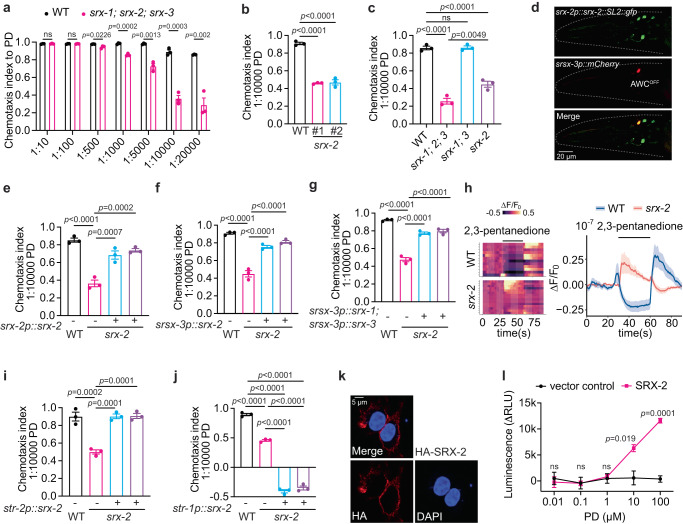
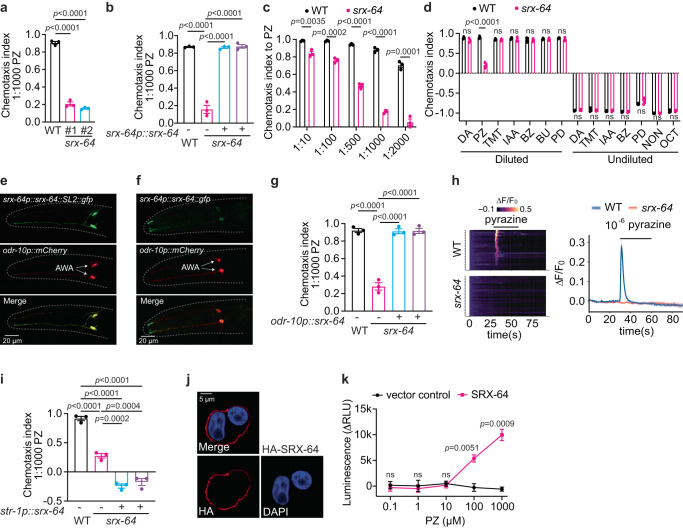
G protein-coupled receptors (GPCRs) mediate responses to various extracellular and intracellular cues. However, the large number of GPCR genes and their substantial functional redundancy make it challenging to systematically dissect GPCR functions in vivo. Here, we employ a CRISPR/Cas9-based approach, disrupting 1654 GPCR-encoding genes in 284 strains and mutating 152 neuropeptide-encoding genes in 38 strains in C. elegans. These two mutant libraries enable effective deorphanization of chemoreceptors, and characterization of receptors for neuropeptides in various cellular processes. Mutating a set of closely related GPCRs in a single strain permits the assignment of functions to GPCRs with functional redundancy. Our analyses identify a neuropeptide that interacts with three receptors in hypoxia-evoked locomotory responses, unveil a collection of regulators in pathogen-induced immune responses, and define receptors for the volatile food-related odorants. These results establish our GPCR and neuropeptide mutant libraries as valuable resources for the C. elegans community to expedite studies of GPCR signaling in multiple contexts.


Conflict of interest statement

The authors declare no competing interests.

Figures

Fig. 1
Fig. 1. The construction of GPCR and neuropeptide mutant libraries.
a Schematic drawing of our approach to phenotypic profiling of nearly all GPCR genes in C. elegans. b The gene expression pattern of unannotated GPCR genes, according to a previously published single-cell RNA-seq dataset of L4 worms. ‘Others’ indicates the non-neuronal tissues, such as intestine and muscle. c Phylogenetic tree analysis of 1675 GPCRs in C. elegans. The GPCR sub-families and relevant genes are highlighted. Six receptors of SRW subfamily, as indicated in blue, were clustered to the clade of neuropeptide receptors. 10 DUF621 domain-containing receptors (magenta) were closely related to chemoreceptors, and 5 DUF1182 domain-containing receptors (brown) were in the clade of neuropeptide receptors. 11 putative GPCRs (Teal), which were annotated as Chromadorea class in the Wormbase, were clustered closely to chemoreceptors. d Strategy for the generation and validation of GPCR mutant strains.
Fig. 2
Fig. 2. Peptidergic signaling is required for hypoxia-evoked locomotory responses.
a Locomotory responses to rapid shifts from 7% to 1% O2 of animals with indicated genotypes WT (N2) and dmsr-4(yum5084); dmsr-7(yum5085); dmsr-8(yum5086) triple mutants. In this and subsequent figure panels, purple bars on X-axis indicate the time intervals used for statistical analysis. n = 3 independent assays for each genotype. Data are presented as mean values +/- SEM. p values are displayed in the plot. Two-sided Welch’s t test. b Locomotory responses to rapid shifts from 7% to 1% O2 of animals with indicated genotypes WT, dmsr-4(yum5084); dmsr-7(yum5085); dmsr-8(yum5086) triple mutants, and transgenic triple mutants expressing dmsr-8 cDNA from its endogenous promoter. n = 3 independent assays for each genotype. Data are presented as mean values +/- SEM. p values are displayed in the plot. Two-sided Welch’s t test. c Locomotory responses to rapid shifts from 7% to 1% O2 of animals with indicated genotypes WT and flp-1(yum104) mutants. n = 4 independent assays for each genotype. Data are presented as mean values +/- SEM. p values are displayed in the plot. ns = not significant (1% O2). Two-sided Welch’s t test. d Locomotory responses to rapid shifts from 7% to 1% O2 of animals with indicated genotypes WT, flp-1(yum104), dmsr-4(yum5084); dmsr-7(yum5085); dmsr-8(yum5086) triple, and dmsr-4(yum5084); dmsr-7(yum5085); dmsr-8(yum5086); flp-1(yum5088) quadruple mutants. n = 4 independent assays for each genotype. Data are presented as mean values +/- SEM. ns = not significant. Two-sided Welch’s t test. e Locomotory responses to rapid shifts from 7% to 1% O2 of animals with indicated genotypes WT, flp-1(yum104), and transgenic flp-1(yum104) expressing flp-1 cDNA from a truncated version of flp-1 promoter, which drives the gene expression specifically in AVK neurons, and from gcy-28.d promoter in AIA neurons. n = 3 independent assays for each genotype except n = 4 for flp-1(yum104). Data are presented as mean values +/- SEM. p values are displayed in the plot. ns = not significant (1% O2). Two-sided Welch’s t test.
Fig. 3
Fig. 3. Seeking GPCR and neuropeptide mutants that are defective in response to V. cholerae.
a Volcano plot showing the differentially expressed genes with adjusted p < 1e-20 in L4 animals exposed to V. cholerae for 8 hours. A set of genes involved in defense against bacterial infection and fatty acid metabolism were highlighted in blue. Random variations (jitter) were added to adjusted p < 1e-300. Two-sided Wald test. b Violin plot of avoidance index changes of the mutants relative to WT after 24-hour on V. cholerae. Mutants with severe defects were highlighted in orange. c The genotype of each strain indicated in (b) and the confirmed genes in those strains were listed in the table. d The proportion of animals on pathogen lawn after 24 hours of V. cholerae exposure. n = 3 biological replicates. Data are presented as mean values +/- SEM. p values are displayed in the plot. Two-tailed t test. e Violin plot of mean survival changes of mutants relative to WT. Hypersensitivity mutants were marked in magenta, and resistant mutants were indicated in orange. f The genotypes of hypersensitive mutants to V. cholerae as indicated in magenta in (e). The genes required for survival on V. cholerae were identified in all strains except CHS1062 and CHS10088. g Survival of WT, pdfr-1(yum2896), pdf-1(yum2897), pdf-2(yum2898) and pdf-1(yum2897); pdf-2(yum2898) on V. cholerae. n = 2 biological replicates. p values are displayed in the plot. log-rank test. h The genotypes of resistant mutants to V. cholerae as indicated in orange in (e). The relevant genes in the strains CHS1025, CHS1040, CHS1103, and CHS10149 have been identified. i Survival of WT and fmi-1(yum2825) upon exposure to V. cholerae. n = 2 biological replicates. p values are displayed in the plot. log-rank test. Source data are provided in the Source Data file.
Fig. 4
Fig. 4. The identification of chemoreceptor and peptidergic mutants that are defective in response to volatile odorants.
a Plate format of population chemotaxis assays used in the screen. b Violin plots of chemotaxis indices of GPCR and neuropeptide mutants to undiluted diacetyl (DA), 2, 4, 5-trimethylthiazole (TMT), isoamyl alcohol (IAA), benzaldehyde (BZ), 2,3-pentanedione (PD), 2-nonanone (NON) and 1-octanone (OCT). The strains with chemotaxis indices (>−0.5) were indicated in magenta. c The genotypes of mutants that were indicated in (b). CI refers to chemotaxis index. d Violin plots of chemotaxis indices of GPCR and neuropeptide mutants to 1:2000 diacetyl (DA), 1:1000 pyrazine (PZ), 1:2000 2, 4, 5-trimethylthiazole (TMT), 1:200 isoamyl alcohol (IAA), 1:1000 benzaldehyde (BZ), 1:10,000 2-butanone (BU), and 1:10,000 2,3-pentanedione (PD). The strains that were defective in chemotaxis to each odorant were indicated. e The genotypes of mutants that were defective in chemotaxis to various odorants as indicated in (d). The relevant genes in the strains CHS1025, CHS1135, CHS1146, CHS1173 and CHS10063 have been identified and listed in the table. CI refers to chemotaxis index. f Heatmap of the correlation between neuropeptide and neuropeptide receptor mutants in response to both odorants and V. cholerae. Red or blue color indicates the positive or negative correlation, respectively. The neuropeptide receptor mutant CHS1025 and the neuropeptide mutant CHS10063 are indicated in magenta, and their correlation is highlighted within a cyan circle.
Fig. 5
Fig. 5. Neuropeptide FLP-19 acts on FRPR-9 receptor to regulate AWC mediated chemotaxis.
ac Chemotaxis indices to 1:10000 diluted 2,3-pentanedione (PD) of animals with indicated genotypes WT and frpr-9(yum1004) in (a), WT and flp-19(yum1005); flp-20(yum1006) double mutants in (b), and WT, frpr-9(yum1004), flp-19(yum1005), flp-20(yum1062), flp-19(yum1005); flp-20(yum1006) double, frpr-9(yum1004); flp-19(yum1005) double and frpr-9(yum1004); flp-19(yum1005) flp-20(yum1006) triple mutants in (c). p values are displayed in the plot. Two-tailed t test for (a) and (b), and one-way ANOVA, Tukey’s multiple comparison for (c). d, e Chemotaxis indices to 1:10000 diluted 2,3-pentanedione (PD) in WT, flp-19(yum1005); flp-20(yum1006) and two independent lines of transgenic flp-19(yum1005); flp-20(yum1006) expressing flp-19 genomic DNA from its endogenous promoter in (d), or expressing flp-20 genomic DNA from its endogenous promoter in (e). p values are displayed in the plot. One-way ANOVA, Tukey’s multiple comparison. f Chemotaxis indices to 1:10000 diluted 2,3-pentanedione (PD) of animals with indicated genotypes WT, frpr-9(yum1004) and two independent lines of transgenic frpr-9(yum1004) expressing frpr-9 genomic DNA from its endogenous promoter. p values are displayed in the plot. One-way ANOVA, Tukey’s multiple comparison. g, h Chemotaxis indices to 1:10000 diluted 2,3-pentanedione (PD) of animals with indicated genotypes WT (N2), flp-19(yum1005); flp-20(yum1006) and two independent lines of transgenic flp-19(yum1005); flp-20(yum1006) expressing flp-19 cDNA from mbr-1 promoter in (g), or from sra-11 promoter in (h). p values are displayed in the plot. One-way ANOVA, Tukey’s multiple comparison. i, j Chemotaxis indices to 1:10000 diluted 2,3-pentanedione (PD) of animals with indicated genotypes WT (N2), frpr-9(yum1004) and two independent lines of transgenic frpr-9(yum1004) expressing frpr-9 genomic DNA in AWC neurons from ceh-36 promoter in (i), or from both srsx-3 and str-2 promoters in (j). p values are displayed in the plot. One-way ANOVA, Tukey’s multiple comparison. In all the figure panels (a–j), data were generated from n = 3 biological replicates, and are presented as mean values +/- SEM. Source data are provided as a Source Data file.
Fig. 6
Fig. 6. SRX-1, SRX-2 and SRX-3 are the receptors for 2,3-pentanedione.
a Chemotaxis indices to different dilutions of 2,3-pentanedione (PD) in animals with indicated genotypes. p values are displayed in the plot. Two-tailed t test. b, c Chemotaxis indices to 1:10000 diluted 2,3-pentanedione (PD) in animals with indicated genotypes. #1 and #2 in (b) indicate two independent null alleles of srx-2. p values are displayed in the plot. One-way ANOVA, Tukey’s multiple comparison. d GFP is expressed from a srx-2p::srx-2::SL2::gfp polycistronic construct. mCherry expression under srsx-3 promoter indicates AWCOFF neuron. e–g Chemotaxis indices to 1:10000 diluted 2,3-pentanedione (PD) in WT, srx-2(yum1007) and two independent lines of transgenic srx-2(yum1007) expressing srx-2 genomic DNA from its endogenous promoter (e), expressing srx-2 cDNA from srsx-3 promoter in AWCOFF neuron (f), or simultaneously expressing srx-1 and srx-3 cDNAs from srsx-3 promoter in AWCOFF neuron (g). p values are displayed in the plot. One-way ANOVA, Tukey’s multiple comparison. h Heatmap (left) and average values (right) of GCaMP3 fluorescence intensity changes in response to 10−7 diluted 2,3-pentanedione in AWCOFF neuron of WT and srx-2(yum1007). i, j Chemotaxis indices to 1:10000 diluted 2,3-pentanedione (PD) in WT, srx-2(yum1007) and two independent lines of transgenic srx-2(yum1007) expressing srx-2 cDNA from str-2 promoter in AWCON neuron (i), or from str-1 promoter in AWB neurons (j). p values are displayed in the plot. One-way ANOVA, Tukey’s multiple comparison. k Cell surface expression of HA-SRX-2 stained with anti-HA antibody (red) and nuclei stained with DAPI (blue). l Intracellular cAMP concentrations in response to different dilutions of 2,3-pentanedione in SRX-2 (magenta) and vector (black) transfected cells. p values are displayed in the plot. Two-tailed t test. In all figure panels (a–c, e–g, i, j, and l), data were generated from n = 3 biological replicates, and are presented as mean values +/- SEM. Source data are provided as a Source Data file.
Fig. 7
Fig. 7. SRX-64 is a cognate receptor for the odorant pyrazine.
a, b Chemotaxis indices to 1:1000 diluted pyrazine (PZ) of animals with indicated genotypes. #1 and #2 indicate two independent null alleles of srx-64 in (a). srx-64 genomic DNA was expressed from its endogenous promoter in srx-64(yum1002) in (b). p values are displayed in the plot. One-way ANOVA, Tukey’s multiple comparison. c Chemotaxis indices to different dilutions of pyrazine (PZ) in WT and srx-64(yum1002). p values are displayed in the plot. Two-tailed t test. d Chemotaxis indices of WT and srx-64(yum1002) to various diluted and undiluted odorants. p values are displayed in the plot. Two-tailed t test. e GFP is expressed from a srx-64p::srx-64::SL2::gfp polycistronic construct. mCherry expression under odr-10 promoter indicates AWA neurons. f GFP is expressed from a srx-64p::srx-64::gfp construct. mCherry under odr-10 promoter indicates AWA neurons. g Chemotaxis indices to 1:1000 diluted pyrazine (PZ) of animals with indicated genotypes. srx-64 cDNA was expressed in AWA neurons under odr-10 promoter in srx-64(yum1002). p values are displayed in the plot. One-way ANOVA, Tukey’s multiple comparison. h Heatmap (left) and average values (right) of GCaMP2 fluorescence intensity changes to 10−6 diluted pyrazine in AWA neurons of WT and srx-64(yum1002). i Chemotaxis indices to 1:1000 diluted pyrazine (PZ) of animals with indicated genotypes. srx-64 cDNA was expressed in AWB neurons under str-1 promoter in srx-64(yum1002). p values are displayed in the plot. One-way ANOVA, Tukey’s multiple comparison. j Cell surface expression of HA-SRX-64 stained with anti-HA antibody (red) and nuclei stained with DAPI (blue) in HEK293T cells. k Intracellular cAMP concentrations in response to different dilutions of pyrazine in SRX-64 (magenta) or vector (black) transfected HEK293T cells. p values are displayed in the plot. Two-tailed t test. In all figure panels (ad, g, i, and k), data were generated from n = 3 biological replicates, and are presented as mean values +/- SEM. Source data are provided in the Source Data file.

Similar articles

Cited by

References

    1. Flock T, et al. Universal allosteric mechanism for Galpha activation by GPCRs. Nature. 2015;524:173–179. doi: 10.1038/nature14663. - DOI - PMC - PubMed
    1. Venkatakrishnan AJ, et al. Molecular signatures of G-protein-coupled receptors. Nature. 2013;494:185–194. doi: 10.1038/nature11896. - DOI - PubMed
    1. Lagerstrom MC, Schioth HB. Structural diversity of G protein-coupled receptors and significance for drug discovery. Nat. Rev. Drug Discov. 2008;7:339–357. doi: 10.1038/nrd2518. - DOI - PubMed
    1. Wootten D, Christopoulos A, Marti-Solano M, Babu MM, Sexton PM. Mechanisms of signalling and biased agonism in G protein-coupled receptors. Nat. Rev. Mol. Cell Biol. 2018;19:638–653. doi: 10.1038/s41580-018-0049-3. - DOI - PubMed
    1. Congreve M, de Graaf C, Swain NA, Tate CG. Impact of GPCR Structures on Drug Discovery. Cell. 2020;181:81–91. doi: 10.1016/j.cell.2020.03.003. - DOI - PubMed

Publication types