. 2023 Dec 18;14(1):8397.
doi: 10.1038/s41467-023-44020-5.

Potent latency reversal by Tat RNA-containing nanoparticle enables multi-omic analysis of the HIV-1 reservoir

Affiliations

Potent latency reversal by Tat RNA-containing nanoparticle enables multi-omic analysis of the HIV-1 reservoir

Marion Pardons et al. Nat Commun. .

Abstract

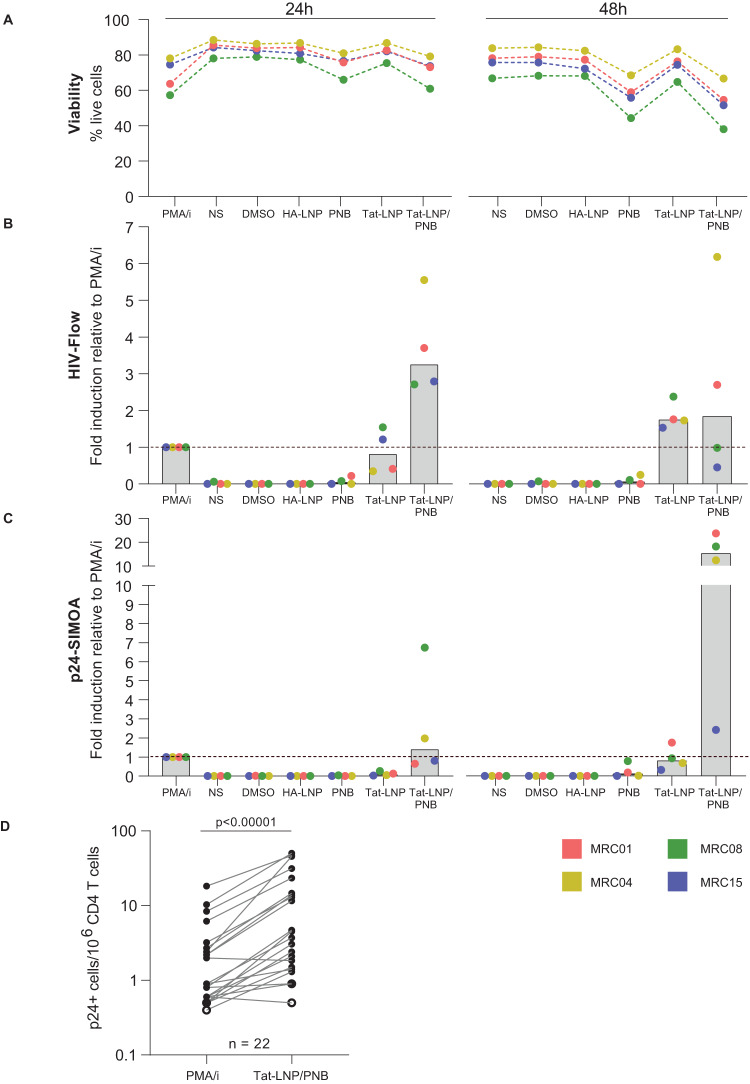
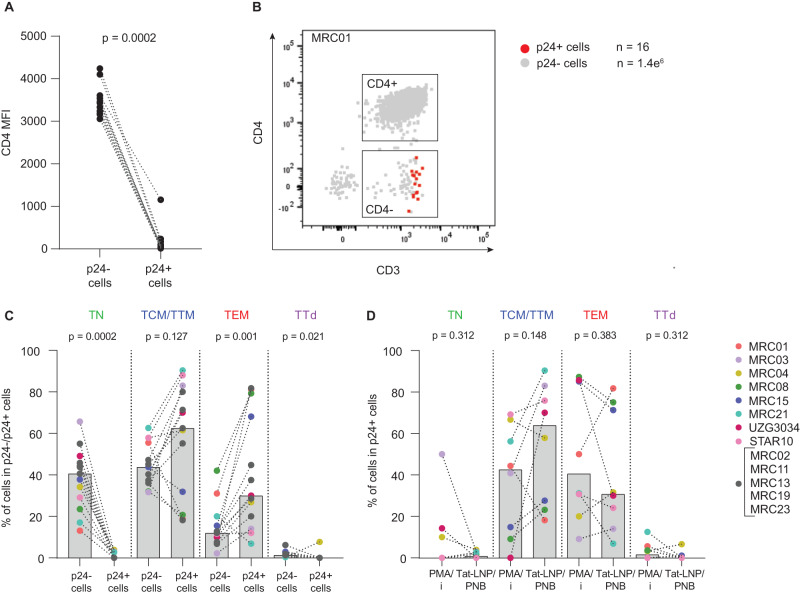
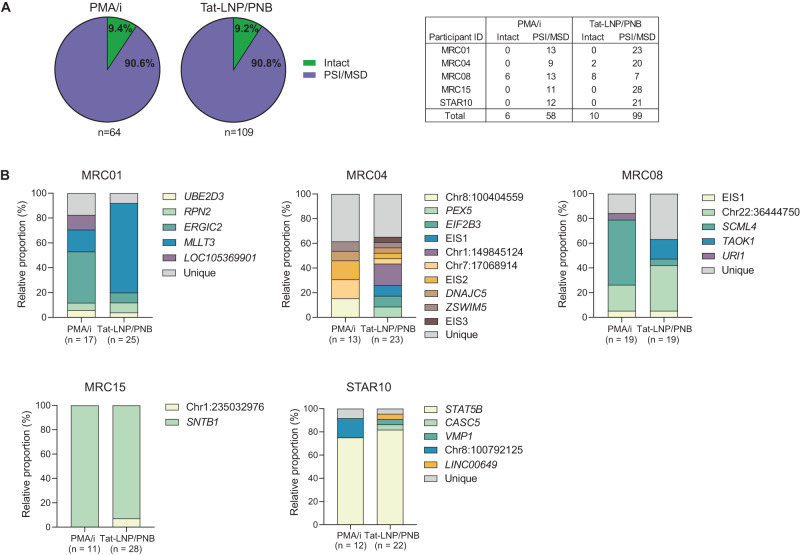
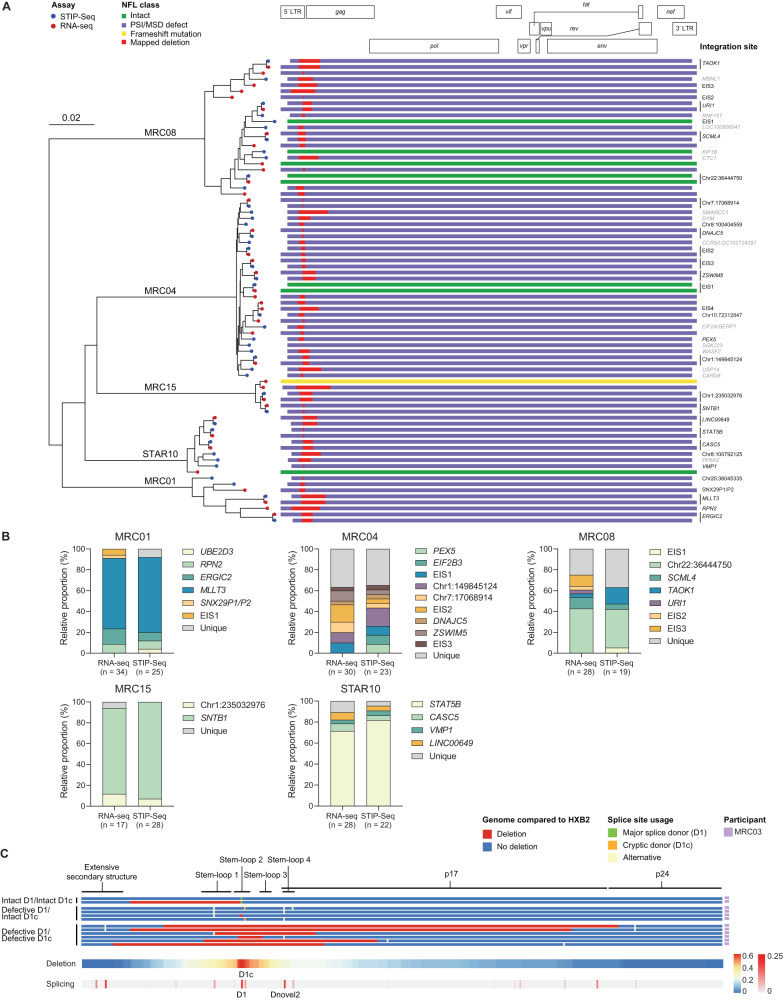
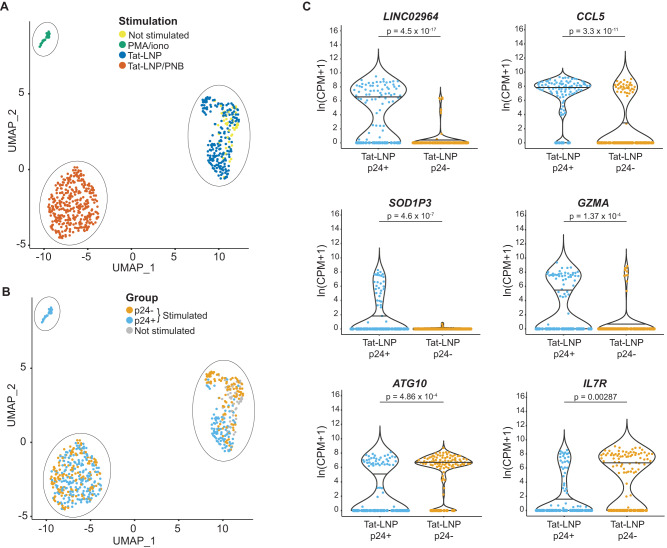
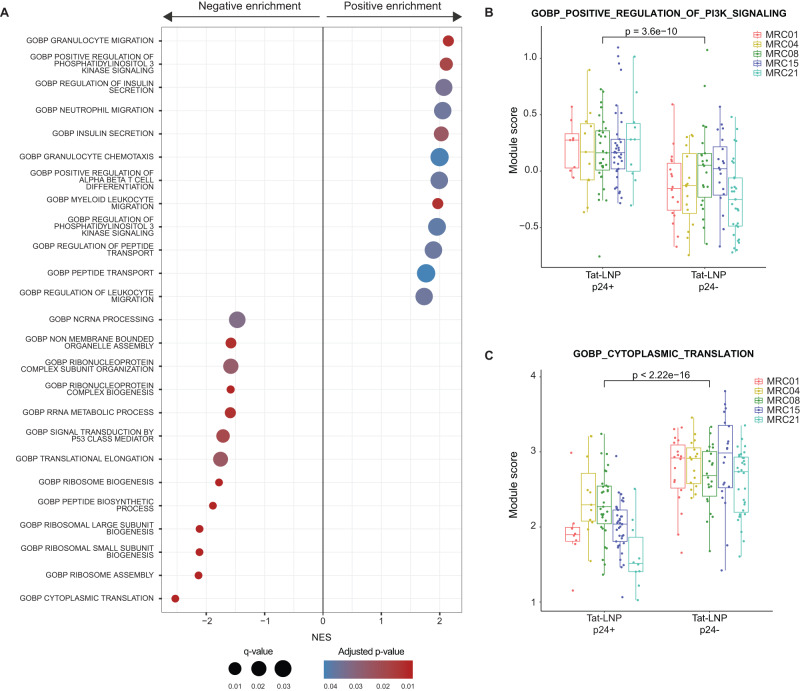
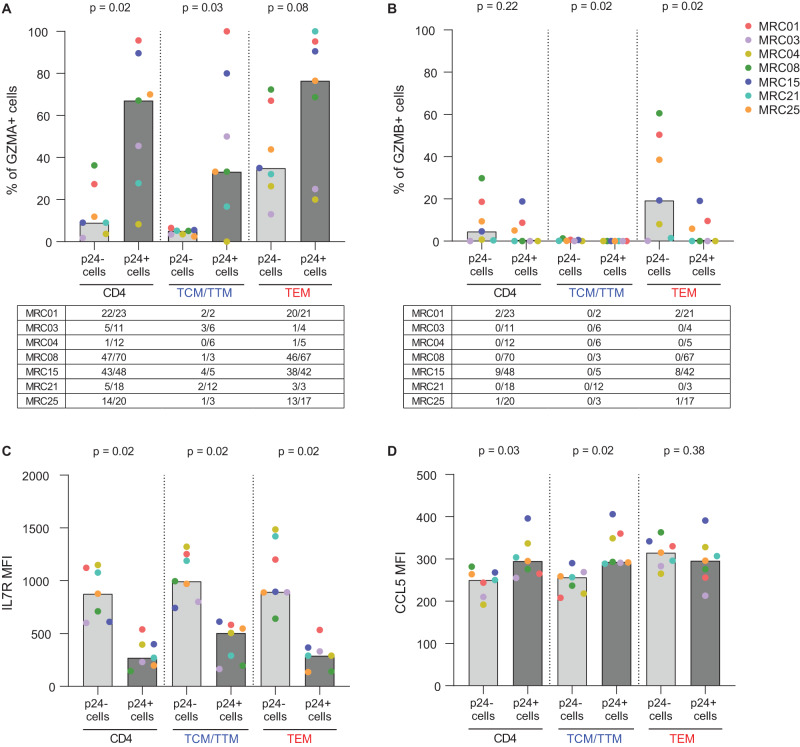
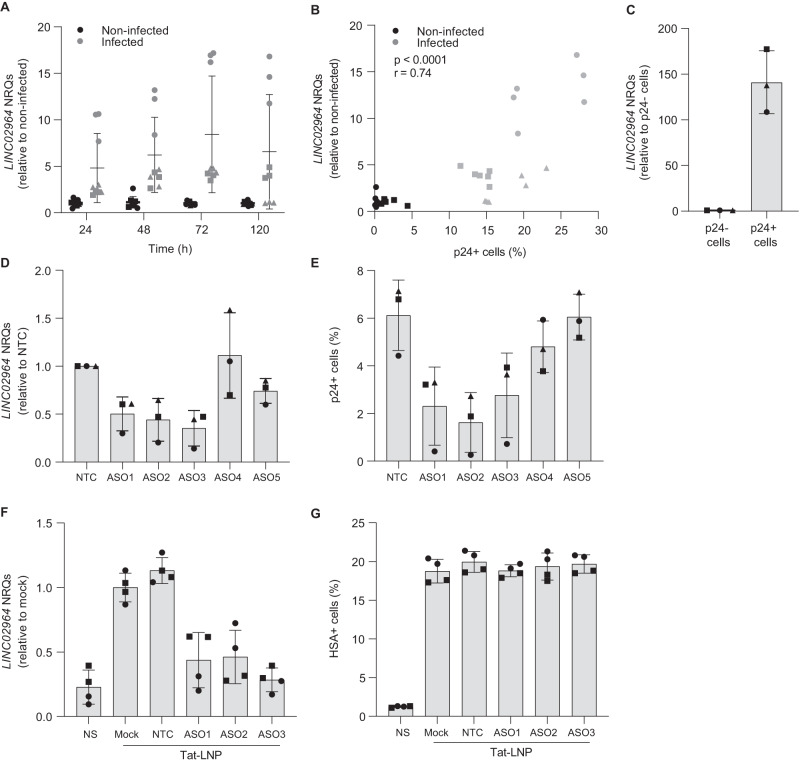
The development of latency reversing agents that potently reactivate HIV without inducing global T cell activation would benefit the field of HIV reservoir research and could pave the way to a functional cure. Here, we explore the reactivation capacity of a lipid nanoparticle containing Tat mRNA (Tat-LNP) in CD4 T cells from people living with HIV undergoing antiretroviral therapy (ART). When combined with panobinostat, Tat-LNP induces latency reversal in a significantly higher proportion of latently infected cells compared to PMA/ionomycin (≈ 4-fold higher). We demonstrate that Tat-LNP does not alter the transcriptome of CD4 T cells, enabling the characterization of latently infected cells in their near-native state. Upon latency reversal, we identify transcriptomic differences between infected cells carrying an inducible provirus and non-infected cells (e.g. LINC02964, GZMA, CCL5). We confirm the transcriptomic differences at the protein level and provide evidence that the long non-coding RNA LINC02964 plays a role in active HIV infection. Furthermore, p24+ cells exhibit heightened PI3K/Akt signaling, along with downregulation of protein translation, suggesting that HIV-infected cells display distinct signatures facilitating their long-term persistence. Tat-LNP represents a valuable research tool for in vitro reservoir studies as it greatly facilitates the in-depth characterization of HIV reservoir cells' transcriptome and proteome profiles.


Conflict of interest statement

The authors M.P., B.C., L.L., W.V.S., S.R., Y.N., N.D.L., A.D. and L.V.D. declare no competing interests. The authors E.V.G., E.N., F.E. and D.B. declare the following competing interests: these authors are employees of Johnson & Johnson and may be Johnson & Johnson, stockholders. The author J.V. declares the following competing interests: this author was an employee of Arcturus Therapeutics and may be an Arcturus Therapeutics stockholder.

Figures

Fig. 1
Fig. 1. Tat-LNP in combination with PNB induces latency reversal in a higher fraction of cells than PMA/i.
AC CD4 T cells from n = 4 ART-treated individuals were stimulated for 24 h or 48 h with Tat-LNP and PNB alone or combined (Tat-LNP/PNB). A 24h-stimulation with PMA/i was used as a positive control. A Percentage of live cells (as defined by a negative Live/Dead stain) among all recorded events. B HIV-Flow was used to measure the frequency of p24+ cells following reactivation: data are represented as fold inductions relative to frequencies obtained by PMA/i at 24 h. Gray columns depict median values. C p24-SIMOA was used to measure the concentrations of p24 in the culture supernatants following reactivation: data are represented as fold inductions relative to p24 concentrations measured by PMA/i at 24 h. Gray columns depict median values. D Frequencies of p24+ cells as measured by HIV-Flow in PMA/i versus Tat-LNP/PNB-stimulated cells (n = 22 ART-treated individuals). For statistical analysis, a two-sided non-parametric Wilcoxon test was used (p = 0.000004). Source data are provided with this paper.
Fig. 2
Fig. 2. Tat-LNP/PNB-stimulated p24+ cells express low levels of CD4 and are enriched in the effector memory fraction.
AD CD4 T cells were stimulated for 24 h with Tat-LNP/PNB and PMA/i. Participants with a minimal number of 7 p24+ cells are represented. A Median fluorescence intensity (MFI) for CD4 expression is compared between p24− cells and p24+ cells (n = 13 ART-treated individuals); gated on LiveDead−/CD8−/CD3+/CD4− and CD4+ cells. B Representative dot plot showing the CD4 phenotype of p24+ cells (in red) overlaid to p24− cells (in gray). C Percentage of cells with a given phenotype (TN, TCM/TTM, TEM, TTd) in the p24+ and p24− fractions (n = 13 ART-treated individuals). HIV-Flow data (PFA-fixed cells) are used to generate Fig. 2C. D Percentage of cells with a given phenotype (TN, TCM/TTM, TEM, TTd) in the p24+ fraction following stimulation with PMA/i or Tat-LNP/PNB (n = 8 ART-treated individuals). HIV-Flow (PFA-fixed cells) and STIP-Seq (methanol-fixed cells) phenotypic data are combined to generate Fig. 2D. Gray bars depict median values. For statistical analyses, two-sided non-parametric Wilcoxon tests were used. TN naive T cells, TCM/TTM central and transitional memory T cells, TEM effector memory T cells, TTd terminally differentiated T cells. Source data are provided with this paper.
Fig. 3
Fig. 3. HIV-1 proviruses reactivated by Tat-LNP/PNB mostly overlap with those retrieved by PMA/i.
A, B CD4 T cells from 5 ART-treated individuals were stimulated for 24 h with Tat-LNP/PNB and PMA/i. P24+ cells were single-cell sorted and subjected to STIP-Seq (median number of p24+ cells per participant = 23 for Tat-LNP/PNB and 13 for PMA/i). A Pie charts showing the fraction of sorted p24+ cells carrying an intact or a PSI/MSD-defective provirus. The counts of intact and PSI/MSD-defective proviruses for each participant and for each stimulation condition are reported in the accompanying table. B Bar plots comparing the relative proportion of each proviral population between PMA/i and Tat-LNP/PNB-stimulated cells. EIS expansion of identical sequences (several proviruses with the same near full-length sequence were retrieved but the IS could not be identified). Supplementary Data 1 provides information on the single-sorted p24+ cells for STIP-Seq analyses.
Fig. 4
Fig. 4. Single-cell RNA-sequencing of p24+ cells identifies the same viruses as STIP-Seq.
A Maximum-likelihood phylogenetic tree representing viral sequences for which we have full coverage both with Smart-seq2 (red dots) and STIP-Seq (blue dots). The phylogenetic tree includes sequences from p24+ cells retrieved following Tat-LNP, Tat-LNP/PNB, and PMA/i stimulation. The viral sequences and the corresponding IS are represented on the right-hand side of the phylogenetic tree. Sequences belonging to a clone are represented only once. IS from clonal cells are depicted in black, while IS retrieved only once are depicted in gray. HXB2 is used as a reference genome, and the scale indicates the number of nucleotide substitutions per site. B The relative proportions of each clone retrieved by Smart-seq2 and STIP-Seq following Tat-LNP/PNB stimulation are compared. For Smart-seq2, the IS associated to each viral sequence were inferred based on the IS retrieved by STIP-Seq. EIS expansion of identical sequences (several proviruses with the same near full-length sequence were retrieved but the IS could not be identified). C Top panel: virogram depicting the 5’ UTR region of representative viral sequences retrieved with Smart-seq2 in MRC03. Viral sequences are grouped into three categories: intact major splice donor (MSD; D1) and cryptic donor (CD; D1c) sites, defective MSD/intact CD, defective MSD and CD. Type of defects and splice site usage are color-coded. Bottom panel: heatmap of the deletions and donor splice sites detected over the entire dataset (n = 7 ART-treated individuals; n = 29 intact MSD/CD, 12 defective MSD/intact CD, 61 defective MSD/CD sequences). HXB2 is used as a reference genome. Supplementary Data 1 and 2 provide information on the single-sorted p24+ cells for STIP-Seq and Smart-seq2 analyses, respectively.
Fig. 5
Fig. 5. P24+ cells display a distinct transcriptional landscape compared to p24− cells.
A, B CD4 T cells were stimulated for 24 h with Tat-LNP/PNB and PMA/i, and for 48 h with Tat-LNP. Uniform manifold approximation and projection (UMAP) of Smart-seq2 data, colored by stimulation (A), or p24 expression (B). C Significantly differentially expressed genes (DEG) between p24+ and p24− cells following a 48h-stimulation with Tat-LNP. Horizontal bars depict median values. P values were derived from likelihood ratio tests, with a Bonferroni correction for multiple comparisons. CPM Counts per million mapped reads. The list of DEG between p24+ and p24− cells is shown in Supplementary Data 5.
Fig. 6
Fig. 6. Gene set enrichment analysis.
AC CD4 T cells from n = 5 ART-treated individuals were stimulated for 48 h with Tat-LNP. p24− and p24+ cells were single-cell sorted and subjected to Smart-seq2. A ranked list of log2(fold change) was used as input for the “GSEA” function of the clusterProfiler package. A Dotplot showing the 25 most differentially regulated gene sets between p24+ and p24− cells (ranked by adjusted p value). NES normalized enrichment score (positive enrichment: upregulated in p24+ cells; negative enrichment: downregulated in p24+ cells). The list of significantly up/downregulated gene sets between p24+ and p24− cells is shown is Supplementary Data 6. B, C Box plots showing the average expression levels for the “positive regulation of PI3K signaling” gene set (B), and for the “cytoplasmic translation” gene set (C), for each single cell from the p24− and p24+ fractions. Median values, interquartile ranges, minima and maxima are depicted on the graphs. For statistical analyses, two-sided non-parametric Mann–Whitney tests were used. The Gene Set Enrichment Analysis (GSEA) on the order ranked gene list can be found in Supplementary Data 6.
Fig. 7
Fig. 7. Validation of the transcriptomic hits.
AD CD4 T cells from n = 7 ART-treated individuals were stimulated for 48 h with Tat-LNP: GZMA, GZMB, IL7R, and CCL5 expression were assessed. A, B The percentage of GZMA+ cells (A) and GZMB+ cells (B) is compared between p24− cells versus p24+ cells. The tables below graphs show the number of p24+ cells that are GZMA+ or GZMB+ out of the total number of recorded p24+ cells for each analyzed fraction (all CD4 T cells, TCM/TTM, TEM). C, D The mean fluorescence intensity for IL7R (C) and CCL5 (D) is compared between p24− cells versus p24+ cells. Gray bars depict median values. For statistical analyses, two-sided non-parametric Wilcoxon tests were used. TN naive T cells, TCM/TTM central and transitional memory T cells, TEM effector memory T cells, TTd terminally differentiated T cells. When a clear distinction between positive and negative subsets could be defined (GZMA, GZMB), results are expressed as a percentage of GZMA+/GZMB+ cells in the p24−/p24+ fractions; when a continuum of expression was observed with no clear distinction between positive and negative subsets (IL7R, CCL5), the results are expressed as IL7R/CCL5 MFI in the p24−/p24+ fractions (gating strategy in Supplementary Fig. 7A). Source data are provided with this paper.
Fig. 8
Fig. 8. Assessment of the role of LINC02964 in HIV-1 pathogenesis and latency reversal.
A, B Infection time course in CD4 T cells using the HIV strain 89.6 (n = 3 HIV- donors depicted by symbols, three technical replicates per condition). A Normalized relative quantities (NRQs) of LINC02964 obtained by RT-qPCR (expressed as fold inductions relative to non-infected samples). B Correlation plot between the expression levels of LINC02964 and the percentage of p24+ cells (defined by p24 KC57-RD1 intracellular staining) found at 48 h and 120 h post-infection. Non-parametric Spearman rank correlation test was performed (p = 0.0000003). C Bar plot showing LINC02964 NRQs in bulk sorted p24− and p24+ cells from 3 viremic donors, expressed as fold inductions relative to the “p24− cells” condition. D, E ASOs treatment of CD4 T cells prior to infection with the HIV strain 89.6 (n = 3 HIV- donors depicted by symbols). Bar plot showing LINC02964 NRQs, expressed as fold inductions relative to NTC (D), and the percentage of p24+ cells defined by p24 KC57-RD1 intracellular staining (E), when using a non-targeting control ASO (NTC) and five ASOs targeting the last intron of LINC02964. F, G ASOs treatment of SupT1 cells latently infected with the NL4.3-∆ENV-IRES-HSA lab strain prior to latency reversal with Tat-LNP (n = 2 independent experiments depicted by symbols, 2 technical replicates per condition). NS non-stimulated, Mock no ASO, NTC non-targeting control ASO. Bar plot showing LINC02964 NRQs, expressed as fold inductions relative to mock (F), and the percentage of HSA+ cells (G). Means and standard deviations are depicted on all graphs. Source data are provided with this paper.

Similar articles

Cited by

References

    1. Wong JK, et al. Recovery of replication-competent HIV despite prolonged suppression of plasma viremia. Science. 1997;278:1291–1295. doi: 10.1126/science.278.5341.1291. - DOI - PubMed
    1. Finzi D, et al. Identification of a reservoir for HIV-1 in patients on highly active antiretroviral therapy. Science. 1997;278:1295–1300. doi: 10.1126/science.278.5341.1295. - DOI - PubMed
    1. Chun TW, et al. Presence of an inducible HIV-1 latent reservoir during highly active antiretroviral therapy. Proc. Natl. Acad. Sci. USA. 1997;94:13193–13197. doi: 10.1073/pnas.94.24.13193. - DOI - PMC - PubMed
    1. Procopio FA, et al. A novel assay to measure the magnitude of the inducible viral reservoir in HIV-infected individuals. EBioMedicine. 2015;2:874–883. doi: 10.1016/j.ebiom.2015.06.019. - DOI - PMC - PubMed
    1. Baxter AE, et al. Single-cell characterization of viral translation-competent reservoirs in HIV-infected individuals. Cell Host Microbe. 2016;20:368–380. doi: 10.1016/j.chom.2016.07.015. - DOI - PMC - PubMed

Publication types

MeSH terms