. 2023 Dec 18;13(1):22471.
doi: 10.1038/s41598-023-49534-y.

Effective processing pipeline PACE 2.0 for enhancing chest x-ray contrast and diagnostic interpretability

Affiliations

Effective processing pipeline PACE 2.0 for enhancing chest x-ray contrast and diagnostic interpretability

Giulio Siracusano et al. Sci Rep. .

Abstract

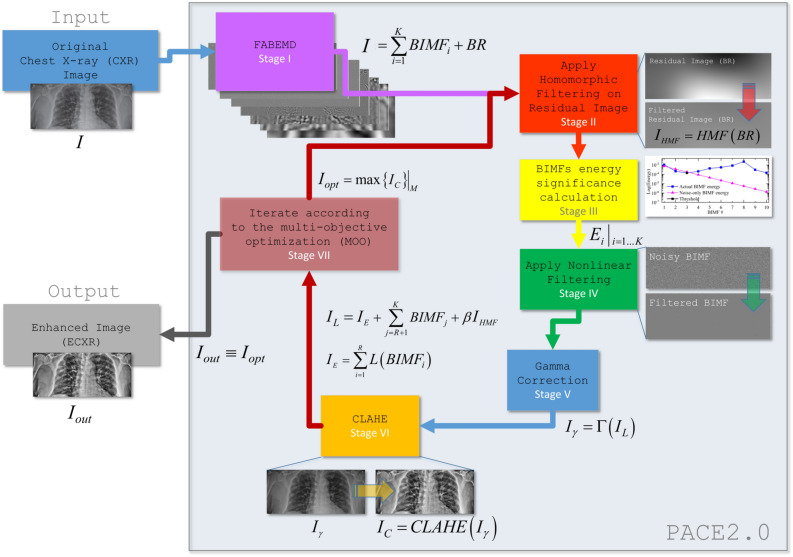
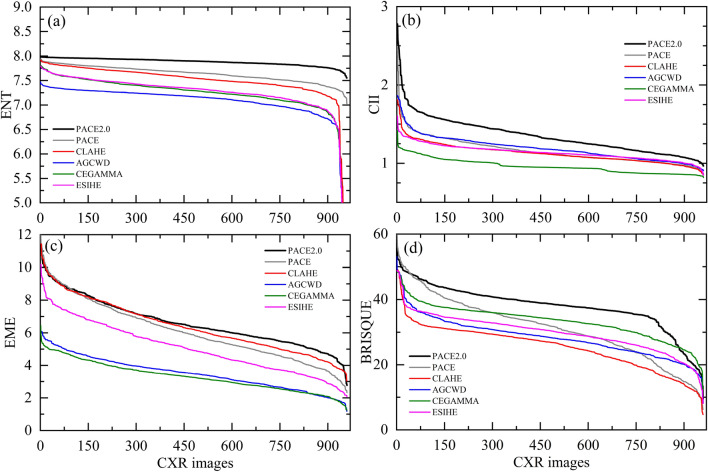
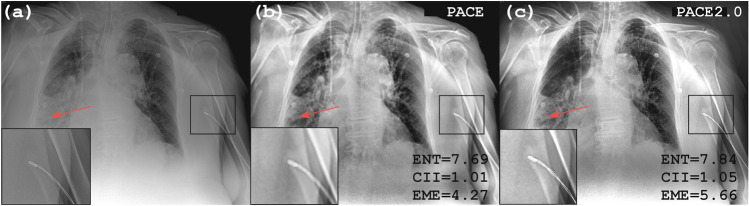
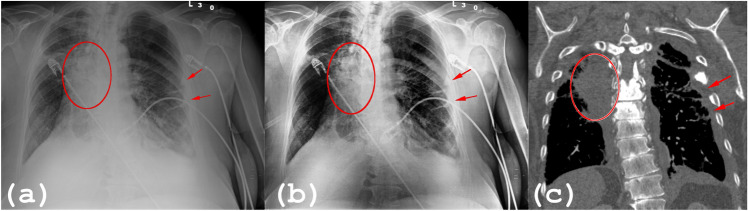
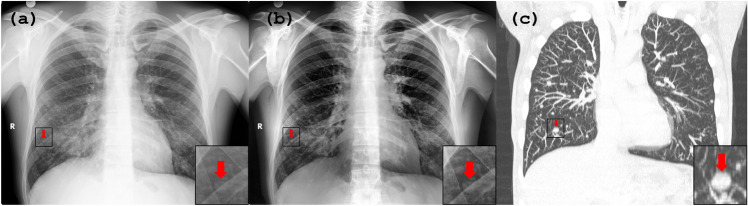
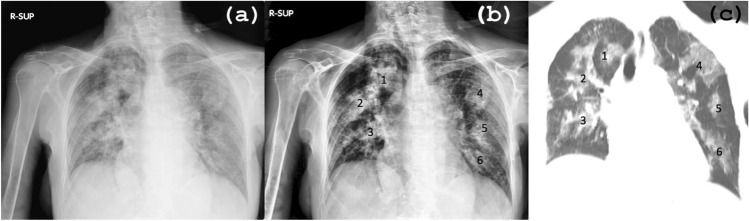
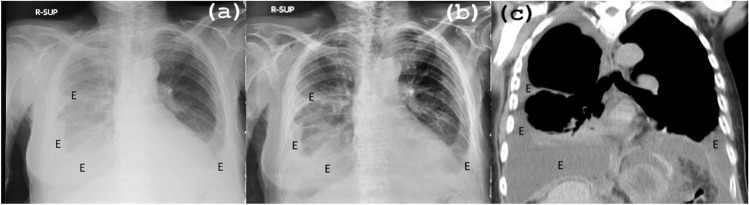
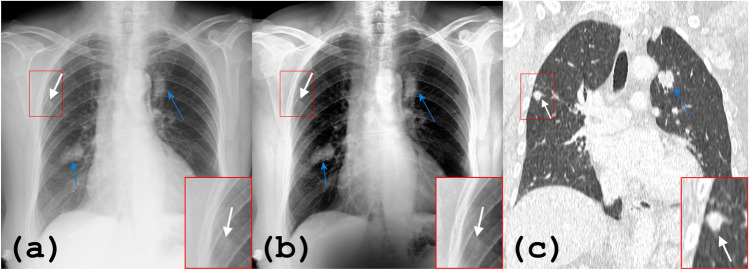
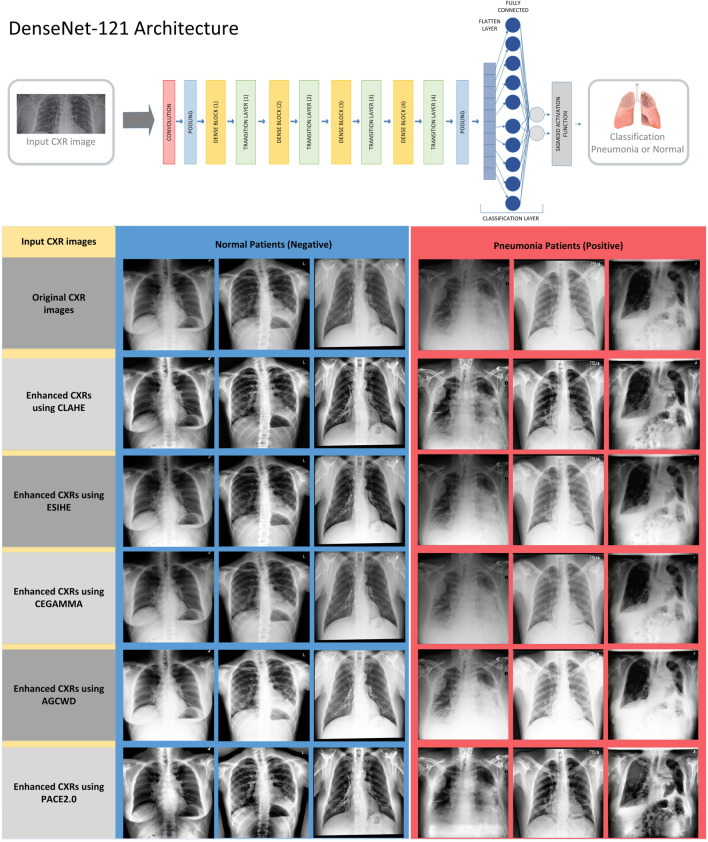
Preprocessing is an essential task for the correct analysis of digital medical images. In particular, X-ray imaging might contain artifacts, low contrast, diffractions or intensity inhomogeneities. Recently, we have developed a procedure named PACE that is able to improve chest X-ray (CXR) images including the enforcement of clinical evaluation of pneumonia originated by COVID-19. At the clinical benchmark state of this tool, there have been found some peculiar conditions causing a reduction of details over large bright regions (as in ground-glass opacities and in pleural effusions in bedridden patients) and resulting in oversaturated areas. Here, we have significantly improved the overall performance of the original approach including the results in those specific cases by developing PACE2.0. It combines 2D image decomposition, non-local means denoising, gamma correction, and recursive algorithms to improve image quality. The tool has been evaluated using three metrics: contrast improvement index, information entropy, and effective measure of enhancement, resulting in an average increase of 35% in CII, 7.5% in ENT, 95.6% in EME and 13% in BRISQUE against original radiographies. Additionally, the enhanced images were fed to a pre-trained DenseNet-121 model for transfer learning, resulting in an increase in classification accuracy from 80 to 94% and recall from 89 to 97%, respectively. These improvements led to a potential enhancement of the interpretability of lesion detection in CXRs. PACE2.0 has the potential to become a valuable tool for clinical decision support and could help healthcare professionals detect pneumonia more accurately.


Conflict of interest statement

The authors declare no competing interests.

Figures

Figure 1
Figure 1
A block diagram of PACE2.0 method as developed in this work. The method is designed to convert input chest X-ray (CXR) images into enhanced CXR (ECXR) images through a series of different steps. (1) FABEMD generates the bi-dimensional intrinsic mode functions and residual image, (2) the HMF stage is used to filter the BR while BIMF energy significance is calculated (3). In (4) Nonlinear Filtering is performed on the least significant BIMFs and the image is reconstructed (by combining BIMFs and BR). (5) Gamma correction is applied on the reconstructed image IL, to generate Iγ. (6) Then, CLAHE is executed on the GC image Iγ to improve the overall contrast and compute IC. Now, steps (2–6) are repeated iteratively until the best result is given under MOO criteria (7), Iopt. Then, the best result is chosen, and the enhanced image is generated and provided as output Iout.
Figure 2
Figure 2
An example of a BIMF energy calculation according to Ref.. The energy of the actual BIMFs is visualized (solid blue line) against the energy of the BIMFs in case they represent noise-only signals (solid magenta line). Information-wise, for the input image I in Fig. 1, the BIMFs 1–3 (R = 3) are the least significant. The cut-off is located on the first relevant BIMF (RBIMF) which is # 3 (black squared dot). This can be observed also by evaluating the output of the decomposition. On the other hand, starting from BIMF 4 we observe components having higher energy (which in turn means edges and details that need to be preserved).
Figure 3
Figure 3
Results as obtained using new PACE2.0 (black line) from the public database (960 CXR images of pneumonia patients processed) and evaluated against PACE (gray line), CLAHE (red line), AGCWD (blue line), CEGAMMA (green line), ESIHE (magenta line) for Entropy (a), CII (b), EME (c), and BRISQUE (d), respectively. Our findings demonstrate that PACE2.0 consistently outperforms these methods and provides better performance over the vast majority of the considered cases.
Figure 4
Figure 4
(ac) we analyze the impact of non-anatomical object in the enhanced image obtained using PACE (b) and PACE2.0 (c), respectively. A medical device projecting on the soft tissues on the left arm can be seen (a). PACE (b) causes blurring of the edges of the object and this can be observed in the magnified area in the bottom left corner. Contrarily, PACE2.0 (c) eliminates such an artifact preserving the details of the object. Results obtained using the above defined metrics are visualized (ENT, CII and EME) on the enhanced images Fig. 4 (b, c).
Figure 5
Figure 5
A comparison among (a) the original CXR image, (b) the enhanced CXR image obtained with PACE2.0, (c) the corresponding CT scan. (a) on conventional radiography the borders of the lung cancer are not well defined and it is not possible distinguish the lung lesion form adjacent spine (red encircled area). A thickening of the left pleura can be also detected (red arrows). (b) On PACE2.0, the image of the right lung mass is easily detectable from spine (red encircled area). In addition, the edges of the left pleural abnormalities are more easily recognizable from lung and ribs (red arrows). The correlation between the PACE2.0 output and the coronal CT reconstruction (c) is highly remarkable and indicative of the efficacy of the algorithm as an image enhancement technique.
Figure 6
Figure 6
The patient in question has multiple lung metastases resulting from malignant paraganglioma. The image set comprises (a) the original anteroposterior CXR, (b) the image obtained after applying PACE2.0, and (c) the corresponding CT image. The initial chest radiograph displays haziness in both lungs, with multiple small nodules that are poorly defined (red arrow), resulting in low diagnostic confidence. In contrast, the nodules are more apparent in (b), the PACE2.0-processed image, where there is a noticeable improvement in the edge definition of one nodule (red arrow), which can be seen more clearly in the insets. The apparent difference of position of nodule between the X-ray image (a and b) and CT scan (c) is due to the different position of the patient during acquisition of images (supine on CT and in standing position on x-ray) and consequent differences in inspiration depth. The reconstructed coronal chest CT image (c) confirms the presence of multiple nodular (red nodule) metastases in both lungs.
Figure 7
Figure 7
Female patient diagnosed with bilateral pneumonia. The image set includes (a) the original CXR image, (b) the output using PACE2.0, and (c) the corresponding CT scan. The PACE2.0-processed output image allows for better definition of the extension of the disease in comparison with the native CXR due to the enhanced contrast between the edges of the pneumonia and the normal lung tissue. The correlation analysis shows a perfect correspondence between the PACE2.0 output and the coronal CT reconstruction (c), with both examinations detecting six areas of pneumonia. This finding highlights the accuracy of PACE2.0 in detecting and characterizing pulmonary abnormalities, particularly in low-contrast images.
Figure 8
Figure 8
Male patient with bilateral pleural effusion, comparison among (a) original CXR image, (b) output using PACE2.0 and CT scan (c). The effusions are better visible on the resulting image with PACE2.0 due to more defined borders between lungs and pleural opacities. Correlation with a coronal CT reconstruction demonstrates the perfect correspondence between the two examinations. E = pleural effusion.
Figure 9
Figure 9
Chest radiography (a), resulting output using PACE2.0 (b) and (c) coronal multiplanar reconstruction of high-resolution computed tomography (CT) of a female patient with high-grade breast cancer. (a) The CXR reveals two metastases: one in the left upper lobe (indicated by a blue arrow) and one in the middle lobe of the right lung (also indicated by a blue arrow). However, the PACE2.0-enhanced image (b) reveals an additional small metastasis in the right upper lobe, which was previously obscured in (a) by a rib (indicated by a white arrow). The coronal CT (c) scan reconstruction (different plane) conclusively confirms the presence of the small lesion.
Figure 10
Figure 10
(Top) The deep learning-based architecture for pneumonia detection using DenseNet-121. (Bottom) Some examples of testing images during experiment considering different types of inputs: original CXR images (no enhancement), enhanced CXRs using CLAHE, ESIHE CEGAMMA, AGCWD and PACE2.0, respectively.

Similar articles

Cited by

References

    1. Troeger C, et al. Estimates of the global, regional, and national morbidity, mortality, and aetiologies of lower respiratory infections in 195 countries, 1990–2016: A systematic analysis for the Global Burden of Disease Study 2016. Lancet Infect. Dis. 2018;18:1191–1210. doi: 10.1016/S1473-3099(18)30310-4. - DOI - PMC - PubMed
    1. Kroft LJM, et al. Added value of ultra–low-dose computed tomography, dose equivalent to chest X-ray radiography, for diagnosing chest pathology. J. Thorac. Imaging. 2019;34:179–186. doi: 10.1097/RTI.0000000000000404. - DOI - PMC - PubMed
    1. Masjedi H, et al. European trends in radiology: Investigating factors affecting the number of examinations and the effective dose. Radiol. Med. 2020;125:296–305. doi: 10.1007/s11547-019-01109-6. - DOI - PubMed
    1. Delrue, L. et al. Difficulties in the interpretation of chest radiography. In (eds. Coche, E. E., Ghaye, B., de Mey, J. & Duyck, P.) 27–49 (Springer Berlin Heidelberg, 2011). 10.1007/978-3-540-79942-9_2.
    1. Rahman T, et al. Exploring the effect of image enhancement techniques on COVID-19 detection using chest X-ray images. Comput. Biol. Med. 2021;132:104319. doi: 10.1016/j.compbiomed.2021.104319. - DOI - PMC - PubMed