

Hemodynamic effects of entry and exit tear size in aortic dissection evaluated with in vitro magnetic resonance imaging and fluid-structure interaction simulation
- PMID: 38110526
- PMCID: PMC10728172
- DOI: 10.1038/s41598-023-49942-0
Hemodynamic effects of entry and exit tear size in aortic dissection evaluated with in vitro magnetic resonance imaging and fluid-structure interaction simulation
Abstract
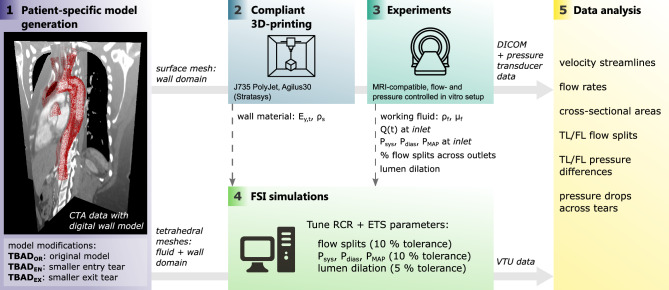
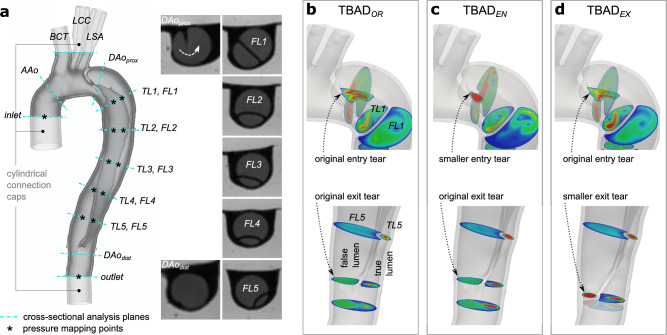
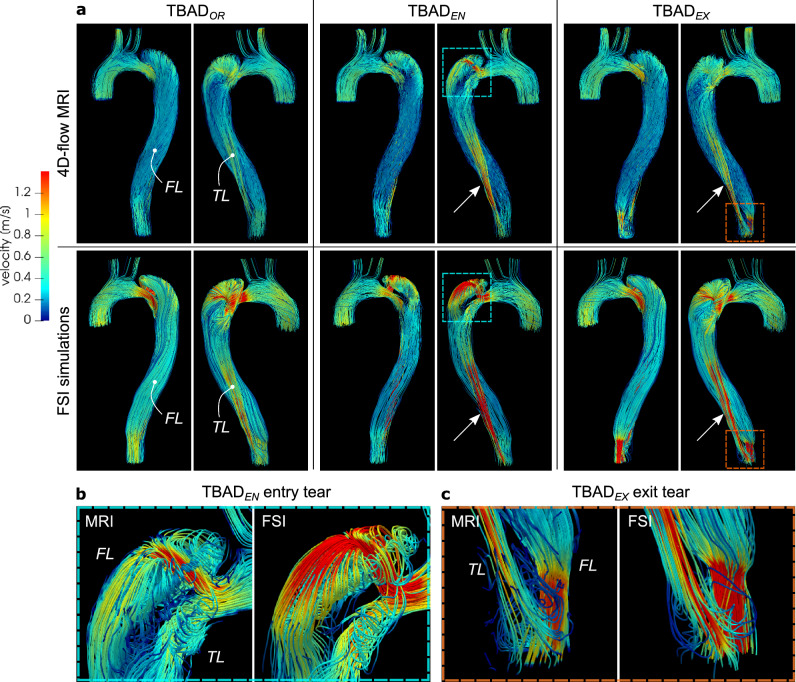
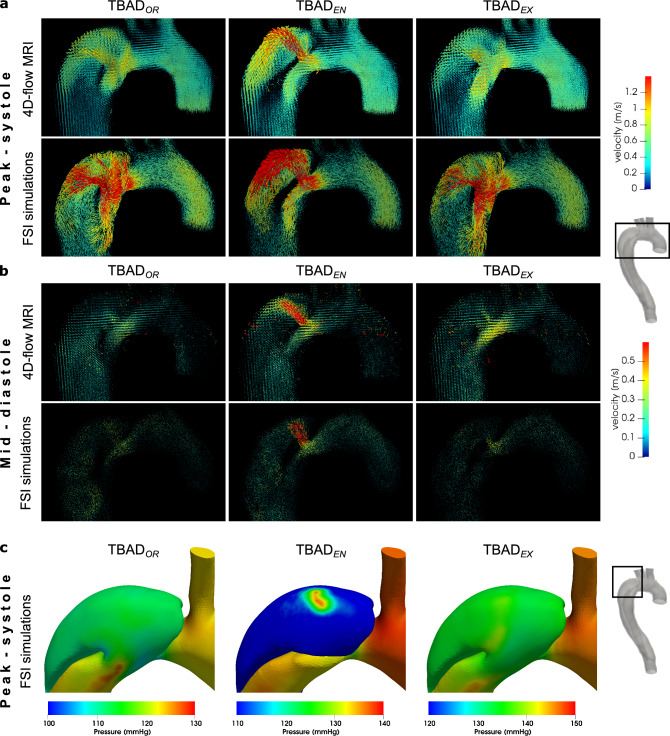
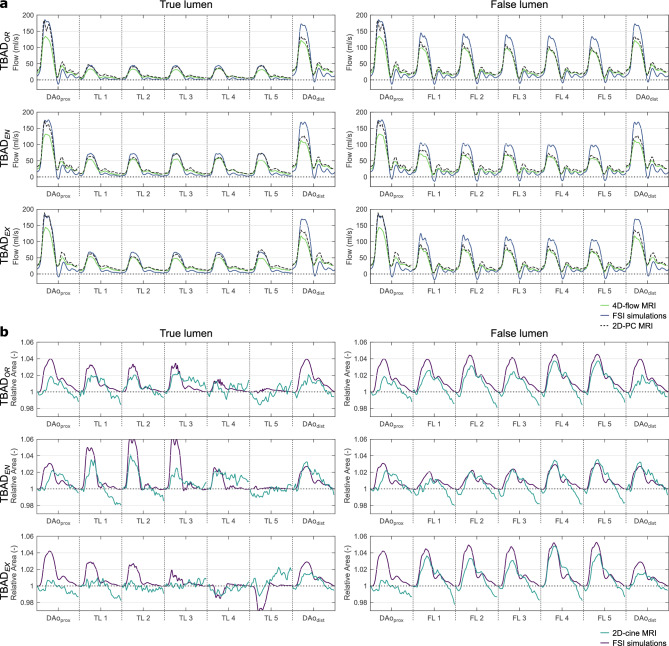
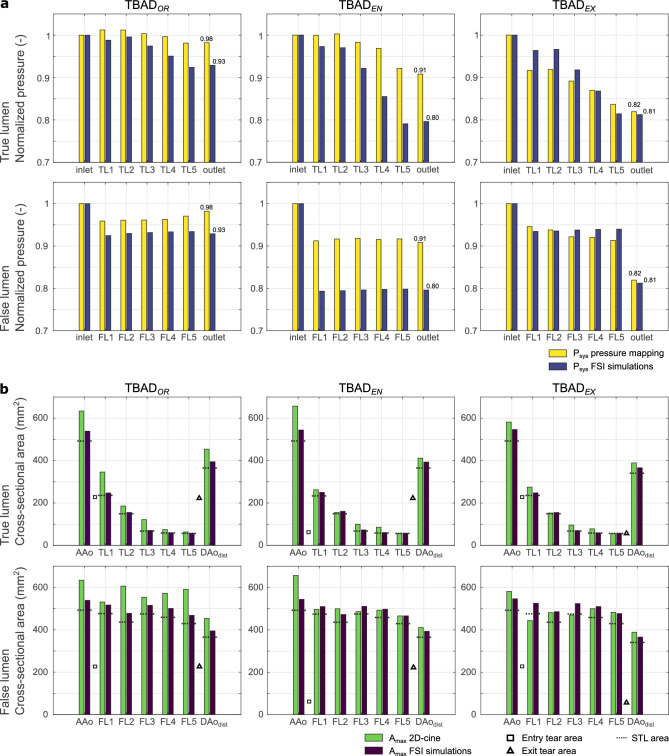
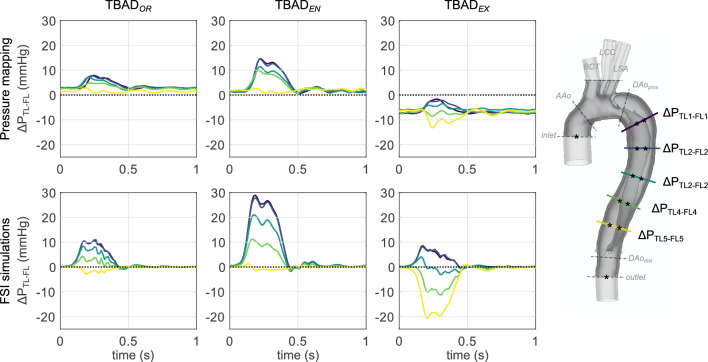
Understanding the complex interplay between morphologic and hemodynamic features in aortic dissection is critical for risk stratification and for the development of individualized therapy. This work evaluates the effects of entry and exit tear size on the hemodynamics in type B aortic dissection by comparing fluid-structure interaction (FSI) simulations with in vitro 4D-flow magnetic resonance imaging (MRI). A baseline patient-specific 3D-printed model and two variants with modified tear size (smaller entry tear, smaller exit tear) were embedded into a flow- and pressure-controlled setup to perform MRI as well as 12-point catheter-based pressure measurements. The same models defined the wall and fluid domains for FSI simulations, for which boundary conditions were matched with measured data. Results showed exceptionally well matched complex flow patterns between 4D-flow MRI and FSI simulations. Compared to the baseline model, false lumen flow volume decreased with either a smaller entry tear (- 17.8 and - 18.5%, for FSI simulation and 4D-flow MRI, respectively) or smaller exit tear (- 16.0 and - 17.3%). True to false lumen pressure difference (initially 11.0 and 7.9 mmHg, for FSI simulation and catheter-based pressure measurements, respectively) increased with a smaller entry tear (28.9 and 14.6 mmHg), and became negative with a smaller exit tear (- 20.6 and - 13.2 mmHg). This work establishes quantitative and qualitative effects of entry or exit tear size on hemodynamics in aortic dissection, with particularly notable impact observed on FL pressurization. FSI simulations demonstrate acceptable qualitative and quantitative agreement with flow imaging, supporting its deployment in clinical studies.
© 2023. The Author(s).
Conflict of interest statement
ALM is an editorial board member of the journal and serves as guest editor of this special issue.
Figures
Update of
-
Hemodynamic Effects of Entry and Exit Tear Size in Aortic Dissection Evaluated with In Vitro Magnetic Resonance Imaging and Fluid-Structure Interaction Simulation.ArXiv [Preprint]. 2023 Mar 23:arXiv:2303.13639v1. ArXiv. 2023. Update in: Sci Rep. 2023 Dec 18;13(1):22557. doi: 10.1038/s41598-023-49942-0. PMID: 36994169 Free PMC article. Updated. Preprint.
Similar articles
-
Investigating the role of thrombosis and false lumen orbital orientation in the hemodynamics of Type B aortic dissection.Sci Rep. 2024 Nov 9;14(1):27379. doi: 10.1038/s41598-024-78348-9. Sci Rep. 2024. PMID: 39521863 Free PMC article.
-
Hemodynamic Effects of Entry and Exit Tear Size in Aortic Dissection Evaluated with In Vitro Magnetic Resonance Imaging and Fluid-Structure Interaction Simulation.ArXiv [Preprint]. 2023 Mar 23:arXiv:2303.13639v1. ArXiv. 2023. Update in: Sci Rep. 2023 Dec 18;13(1):22557. doi: 10.1038/s41598-023-49942-0. PMID: 36994169 Free PMC article. Updated. Preprint.
-
Three-dimensional modelling and hemodynamic simulation of the closure of multiple entry tears in type B aortic dissection.Med Phys. 2024 Jan;51(1):42-53. doi: 10.1002/mp.16852. Epub 2023 Dec 1. Med Phys. 2024. PMID: 38038366
-
Advanced risk prediction for aortic dissection patients using imaging-based computational flow analysis.Clin Radiol. 2023 Mar;78(3):e155-e165. doi: 10.1016/j.crad.2022.12.001. Epub 2022 Dec 23. Clin Radiol. 2023. PMID: 36610929 Review.
-
Fluid-Structure Interaction Within Models of Patient-Specific Arteries: Computational Simulations and Experimental Validations.IEEE Rev Biomed Eng. 2024;17:280-296. doi: 10.1109/RBME.2022.3215678. Epub 2024 Jan 12. IEEE Rev Biomed Eng. 2024. PMID: 36260570 Review.
Cited by
-
Investigating the role of thrombosis and false lumen orbital orientation in the hemodynamics of Type B aortic dissection.Sci Rep. 2024 Nov 9;14(1):27379. doi: 10.1038/s41598-024-78348-9. Sci Rep. 2024. PMID: 39521863 Free PMC article.
-
Mechanisms of aortic dissection: From pathological changes to experimental and in silico models.Prog Mater Sci. 2025 Apr;150:101363. doi: 10.1016/j.pmatsci.2024.101363. Epub 2024 Sep 12. Prog Mater Sci. 2025. PMID: 39830801 Free PMC article.
-
Multifactorial considerations in frozen elephant trunk selection and treatment strategies for acute type A aortic dissection.JTCVS Open. 2024 Mar 26;19:39. doi: 10.1016/j.xjon.2024.03.008. eCollection 2024 Jun. JTCVS Open. 2024. PMID: 39015449 Free PMC article. No abstract available.
-
4D computed tomography assessment of ruptured triple-lumen type B aortic dissection: a case report.Eur Heart J Case Rep. 2024 Nov 19;8(12):ytae613. doi: 10.1093/ehjcr/ytae613. eCollection 2024 Dec. Eur Heart J Case Rep. 2024. PMID: 39659454 Free PMC article.
-
Impact of Residual Intimal Flap Displacement Post-TEVAR on TBAD Haemodynamics in Compliant, Patient-specific CFD Simulations Informed by MRI.Ann Biomed Eng. 2025 Aug;53(8):1834-1851. doi: 10.1007/s10439-025-03739-6. Epub 2025 May 9. Ann Biomed Eng. 2025. PMID: 40346352 Free PMC article.
References
MeSH terms
Grants and funding
LinkOut - more resources
Full Text Sources
