. 2024 Jun;49(7):1091-1103.
doi: 10.1038/s41386-023-01779-x. Epub 2023 Dec 19.

TAAR1 agonist ulotaront modulates striatal and hippocampal glutamate function in a state-dependent manner

Affiliations

TAAR1 agonist ulotaront modulates striatal and hippocampal glutamate function in a state-dependent manner

Sung M Yang et al. Neuropsychopharmacology. 2024 Jun.

Abstract

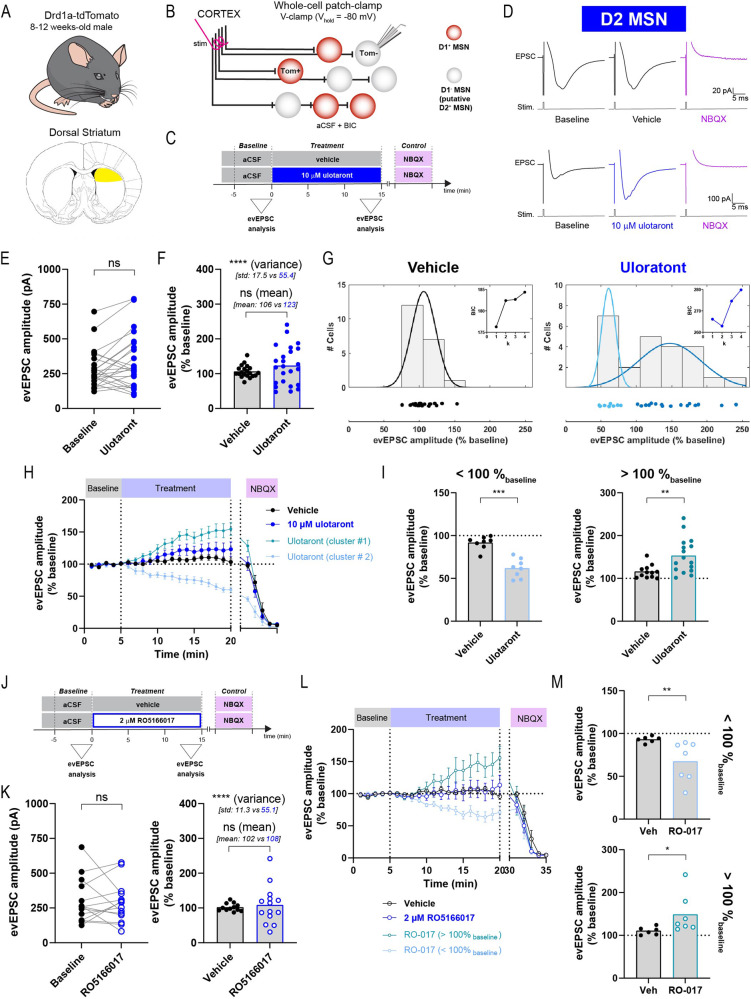
Aberrant dopaminergic and glutamatergic function, particularly within the striatum and hippocampus, has repeatedly been associated with the pathophysiology of schizophrenia. Supported by preclinical and recent clinical data, trace amine-associated receptor 1 (TAAR1) agonism has emerged as a potential new treatment approach for schizophrenia. While current evidence implicates TAAR1-mediated regulation of dopaminergic tone as the primary circuit mechanism, little is known about the effects of TAAR1 agonists on the glutamatergic system and excitation-inhibition balance. Here we assessed the impact of ulotaront (SEP-363856), a TAAR1 agonist in Phase III clinical development for schizophrenia, on glutamate function in the mouse striatum and hippocampus. Ulotaront reduced spontaneous glutamatergic synaptic transmission and neuronal firing in striatal and hippocampal brain slices, respectively. Interestingly, ulotaront potentiated electrically-evoked excitatory synaptic transmission in both brain regions, suggesting the ability to modulate glutamatergic signaling in a state-dependent manner. Similar striatal effects were also observed with the TAAR1 agonist, RO5166017. Furthermore, we show that ulotaront regulates excitation-inhibition balance in the striatum by specifically modulating glutamatergic, but not GABAergic, spontaneous synaptic events. These findings expand the mechanistic circuit hypothesis of ulotaront and TAAR1 agonists, which may be uniquely positioned to normalize both the excessive dopaminergic tone and regulate abnormal glutamatergic function associated with schizophrenia.


Conflict of interest statement

SMY, SCH, KSK, LJB and ND are employees of Sumitomo Pharma America, Inc. (formerly Sunovion Pharmaceuticals). AG was an employee of Sunovion Pharmaceuticals Inc. at the time of the study. JH, FG, RT are employees of Neuroservices Alliance. SAN is an employee of Neurexpert Limited.

Figures

Fig. 1
Fig. 1. Ulotaront decreases the frequency of mEPSC in striatal MSNs.
A Schematics of the mouse line (left), brain area (middle) and recording strategy (right). mEPSCs were recorded in D1-expressing (tdTom + ) and D1-non-expressing (tdTom-) MSNs using whole-cell V-clamp configuration and with TTX and PTX added into the aCSF. B Experimental time course. Frequency and amplitude of mEPSCs were analyzed during pre-drug baseline condition and for the last 5 min of treatment with 10 μM ulotaront or vehicle. CH mEPSC in D1-expressing MSNs. C Representative traces of mEPSC activity before (top) and during ulotaront application (bottom). Average frequency (D) and amplitude (F) of mEPSC during baseline condition and upon bath application of 10 μM ulotaront or vehicle. Effect of treatment with vehicle control vs ulotaront on frequency (E) and amplitude (G) of mEPSC. Data were normalized to baseline and presented as average time course (left) as well as summary plot (right). H Coefficient of variation analysis for the treatment with ulotaront. IN Analysis on D1-non-expressing MSNs (putative D2-expressing), corresponding to (CH). Data are mean ± s.e.m. Each dot represents a cell (n = 8−9), except in the average time course (E, G, K and M, left). Statistics are described in Table S1. ns, not significant; *p < 0.05; **p < 0.01.
Fig. 2
Fig. 2. Ulotaront does not affect the mIPSC in striatal MSNs.
A Schematics of recording strategy (top) and experimental time course (bottom). mIPSCs were recorded in D1-expressing (tdTom + ) and D1-non-expressing (tdTom-) MSNs using whole-cell V-clamp configuration and with TTX, D-AP5 and NBQX added into the aCSF. Frequency and amplitude of mIPSC were analyzed during pre-drug baseline condition and for the last 5 min of treatment with 10 μM ulotaront or vehicle. B Representative traces of mIPSC activity before (left) and during ulotaront application (right), for both D1-expressing (top) and D1-non-expressing (bottom) MSNs. CF mIPSC in D1-expressing MSNs. Average frequency (C) and amplitude (E) of mIPSC during baseline and upon bath application of 10 μM ulotaront or vehicle. Effect of treatment with vehicle vs ulotaront on frequency (D) and amplitude (F) of mIPSC. Data were normalized to baseline and presented as time course (left) as well as summary plot (right; each dot represents a cell, as in (C, E)). GJ Analysis on D1-non-expressing (putative D2-expressing) MSNs, corresponding to (CF). Data are mean ± s.e.m; n = 8 -9 slices. Statistics are described in Table S1. ns, not significant.
Fig. 3
Fig. 3. Ulotaront and selective TAAR1 agonist RO5166017 bidirectionally modulate the amplitude of evoked EPSC in putative D2 MSNs.
Schematic of the mouse line (A, top), brain area (A, bottom) and recording strategy (B). Evoked EPSCs were elicited by stimulation of the deep cortical layer and recorded in D1-non-expressing (tdTom-) MSNs using whole-cell V-clamp configuration, with bicuculline (BIC) added into the aCSF. CH Effect of ulotaront on evEPSC in putative D2-expressing MSNs. C Experimental time course. Evoked EPSC amplitude was analyzed during pre-drug baseline condition and for the last 3 min of treatment with 10 μM ulotaront or vehicle. D Representative average traces of evEPSCs before and during vehicle (top) and ulotaront application (bottom), as well as upon perfusion with of 10 μM NBQX. E Amplitude during baseline condition and upon bath application of ulotaront. F Comparison of the normalized-to-baseline evEPSC amplitude for vehicle- vs ulotaront-treated groups, at the level of mean and variance (average mean and standard deviation are presented in parentheses). G Individual data (bottom) and count histogram (top) of the normalized amplitude for vehicle (left) and ulotaront (right) groups. The histogram is overlaid by the optimal Gaussian mixture model (number of components k = 1 and k = 2 for vehicle and ulotaront groups, respectively; see Table S1) and the individual values were color-coded based on a cluster analysis run on the distribution model (see Supplementary Materials and Methods). Inset, plot of the Bayes information criterion (BIC) generated for the Gaussian mixture models with k components. H Average time course of the normalized evEPSC amplitude. The ulotaront data is presented as a single group, and also split into the two clusters found in G. I Analysis of vehicle vs ulotaront groups after the cells were clustered based on the direction of the change relative to baseline; decrease (left, < 100%baseline) and increase (right, > 100%baseline). JM Effect of 2 μM RO5166017 (RO-017) on evEPSC, corresponding to (C), (E), (F), (H) and (I). In (L) and (M), cells were grouped based on the direction of the effect; decrease (M top, <100%baseline) and increase (M bottom, >100%baseline) relative to baseline. Data are mean ± s.e.m. Each dot represents a cell (n = 7−24), except in the average time course (H, L). Statistics are described in Table S1. ns, not significant; *p < 0.05; **p < 0.01; ***p < 0.001; ****p < 0.0001.
Fig. 4
Fig. 4. Ulotaront enhances excitatory synaptic transmission in hippocampal CA1.
Schematics of animal model (A, top), brain area (A, bottom), recording strategy (B, top) and experimental time course (B, bottom). Field EPSP were measured in the stratum radiatum of the CA1 by means of extracellular field potential recordings upon stimulation of the Schaffer Collateral pathway (SC). Peak amplitude and initial slope of fEPSP were analyzed during pre-drug baseline condition and for the last 5 min of treatment with ulotaront (10 μM and 30 μM) or vehicle. C Representative average traces of fEPSP responses before (left) and during compound application (right). D, E Peak amplitude of fEPSP in CA1. D fEPSP amplitude during baseline condition (b) and upon bath application (t) of ulotaront (10 μM and 30 μM) or vehicle. E Effect of treatment with vehicle control vs ulotaront on fEPSP amplitude. Data were normalized to baseline and presented as average time course (left) as well as summary plot (right; each dot represents a brain slice, as in (D)). F, G Analysis on fEPSP slope, corresponding to (D, E). Data are mean ± s.e.m; n = 10 -14 slices. For statistics, see Table S1. ns, not significant; *p < 0.05.
Fig. 5
Fig. 5. Ulotaront reduces spontaneous firing in hippocampal CA1.
AG Spontaneous firing in the CA1 recorded by multi-electrode array (MEA). Schematic of the mouse line (A, left), brain area (A, right), recording strategy (B) and experimental time course (C). Spontaneous neuronal firing activity was extracellularly recorded in the dorsal CA1 by means of a MEA. Firing rate was analyzed during pre-drug baseline condition and for the last 5 min of treatment with ulotaront (1 μM, 10 μM and 30 μM) or vehicle. D Left, Representative traces of spontaneous firing before (top) and during (middle) vehicle application, and upon TTX (bottom). Right, representative raster plots displaying the firing activity for the ulotaront groups (each line represents a spike). E Firing rate during baseline (b) and upon bath application (t) of ulotaront (1 μM, 10 μM, 30 μM) or vehicle. F, G Effect of treatment with vehicle control vs ulotaront on firing rate. Data were normalized to baseline and presented as average time course (F) as well as summary plot (G; each dot represents an electrode, as in (E)). HL Spontaneous firing in the CA1 recorded by micropipette. H, I Recording strategy (H) and experimental time course (I). Extracellular single-unit recordings were acquired by means of a micropipette positioned in the stratum pyramidale of the CA1. Firing rate was analyzed during pre-drug baseline condition and for the last 5 min of treatment with 30 μM ulotaront or vehicle. J Representative raster plots displaying the spontaneous firing for the vehicle (top) and ulotaront (bottom) groups. KM Analysis on firing rate recorded by micropipette, corresponding to (EG). In (K) and (M), each dot represents a unit. Data are mean ± s.e.m; n = 27−45 electrodes, 9−16 cells. Statistics are described in Table S1. ns, not significant; **p < 0.01; ****p < 0.0001.

Similar articles

Cited by

References

    1. S. G. Sepanlou. The global, regional, and national burden of cirrhosis by cause in 195 countries and territories, 1990–2017: a systematic analysis for the Global Burden of Disease Study 2017. Lancet Gastroenterol Hepatol. 2020;5:245–66. doi: 10.1016/S2468-1253(19)30349-8. - DOI - PMC - PubMed
    1. Howes OD, Murray RM. Schizophrenia: an integrated sociodevelopmental-cognitive model. Lancet. 2014;383:1677–87. 10.1016/S0140-6736(13)62036-X. - PMC - PubMed
    1. Biedermann F, Fleischhacker WW. Psychotic disorders in DSM-5 and ICD-11. CNS Spectrums. 2016;21:349–54. 10.1017/S1092852916000316. - PubMed
    1. Keeley JW, Gaebel W. Symptom rating scales for schizophrenia and other primary psychotic disorders in ICD-11. Epidemiol. Psychiatr Sci. 2018;27:219–24. doi: 10.1017/S2045796017000270. - DOI - PMC - PubMed
    1. McCutcheon RA, Reis Marques T, Howes OD. Schizophrenia - An Overview. JAMA Psychiatry. 2020;77:201–10. 10.1001/jamapsychiatry.2019.3360. - PubMed

MeSH terms

Substances